Download presentation
Presentation is loading. Please wait.

1
CEMS School Profile 2009

2
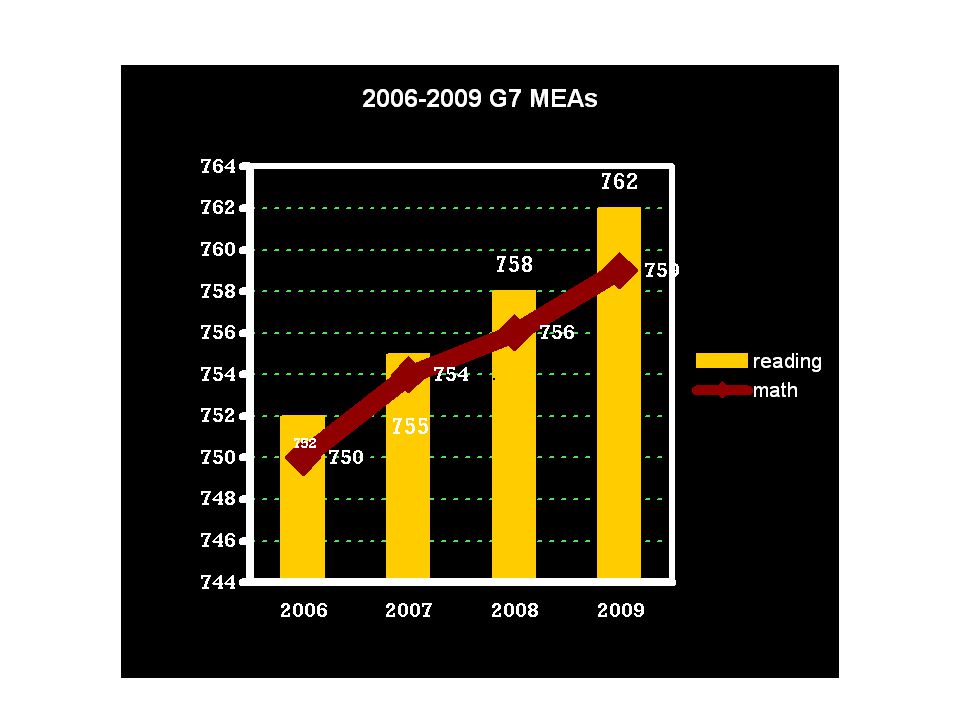
2006-2009 The following line graphs represent 2006-2009 MEA scores in reading and math for each grade level. It is important to note that this data represents three different classes per chart.

7
2009 MEA School Comparison The following tables represent a comparison of 2009 MEA scores for similar districts - Falmouth Middle School, Frank Harrison Middle School (Yarmouth), Greely Middle School (MSAD 51), and CEMS.
, Greely Middle School (MSAD 51), and CEMS.")
11
2009 MEA Performance Level Three and Four-Year Review The following bar graphs represent the performance level percentages- exceeds (E), meets (M), partially meets (PM), and does not meet the standard (DNM) - for reading and math. This data represents MEA performance of the same class over time.

20
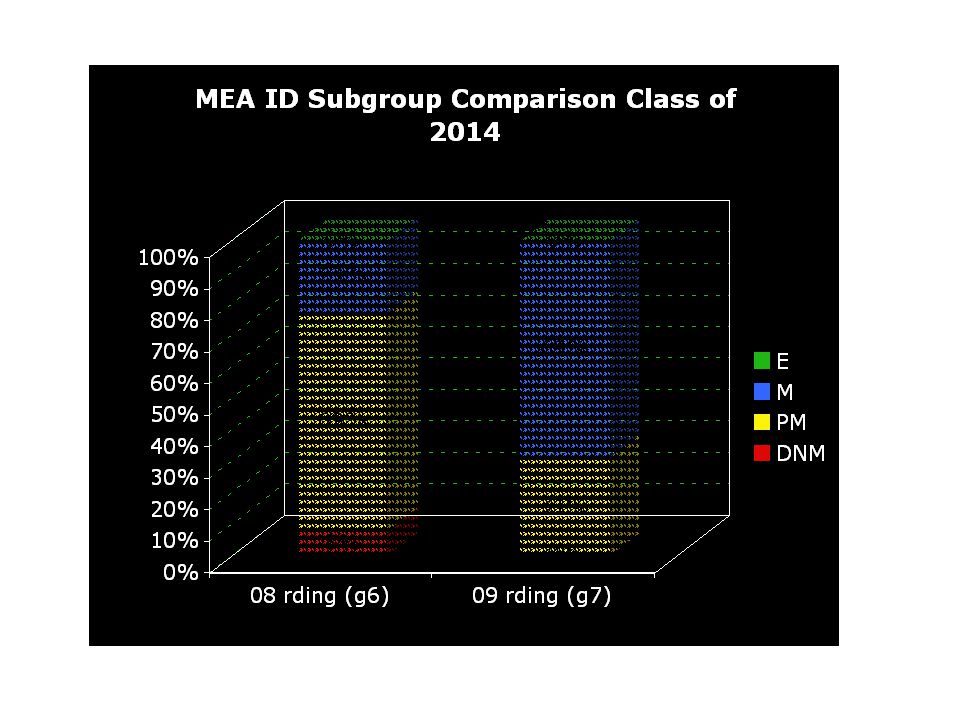
MEA Two-Year Subgroup Comparison The following bar graphs represent performance level comparisons of the same subgroup - Identified Disability- for the 2008 and 2009 test sessions.

Similar presentations


 2012 Science Results Carolyn M. Wood, Ph.D. Assistant Superintendent, Accountability, Assessment, and Data Systems August.>")


 Line graphPictogram.>")


 Steps of School Improvement 2014 Results MSP-HSPE-EOC.>")


