Download presentation
Presentation is loading. Please wait.

1
Kayla Hartwell 1, Hugh Notman 1,2, & Mary Pavelka 1 1 University of Calgary and 2 Athabasca University, Alberta, Canada

2
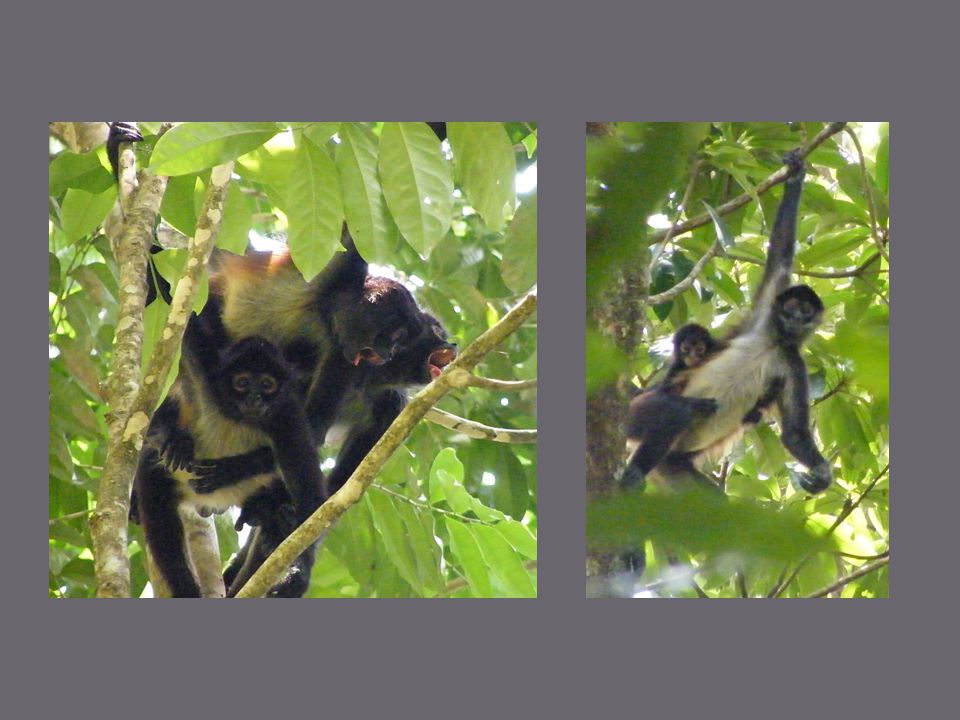
Described in a number of studies (Campbell 2003; Link et al. 2009; Slater et al. 2009) Low intensity intra-group aggression directed from males to females “Stereotyped displays and chases” (Link et al. 2009) Photo: Kayley Evans
 Low intensity intra-group aggression directed from males to females Stereotyped displays and chases (Link et al. 2009) Photo: Kayley Evans.")
4
Sexual Segregation and Aggregation Statistic (SSAS) (Bonenfant et al. 2007) Association = presence in the same subgroup using 30min subgroup scan data Distinguishes active segregation and aggregation from random association Calculates index value ranging from 0 (significant aggregation) to 1 (significant segregation)
 Association = presence in the same subgroup using 30min subgroup scan data Distinguishes active segregation and aggregation from random association Calculates index value ranging from 0 (significant aggregation) to 1 (significant segregation).")
5
1 Jan Mar May Jul Sep Nov 0.5 0 SSAS Month (Segregation) (Aggregation)
 (Aggregation)")
7
1.Compare rates of aggression by Males to females Males to males Females to males Females to females 2.Compare the contexts in which these aggressive interactions occurred

9
34 - 38 group members over course of study 2008-2011 All individuals habituated and individually recognizable Year MaleFemales AdultSubadultAdultSubadult 200832113 200932122 201052124 201153132

10
Collect scan & focal data All observations of fission- fusion events & aggression For aggression: ID of director(s) & receiver(s) & context ~2000 contact hours over 601 days 193 aggressive interactions
 & receiver(s) & context ~2000 contact hours over 601 days 193 aggressive interactions")
11
Food: receiver was feeding when aggression occurred Fusion: subgroup fusion occurred within 5min of aggression (food took precedence over fusion) Sexual: copulation, place sniff, genital inspect occurred immediately following aggression Other: any other context
 Sexual: copulation, place sniff, genital inspect occurred immediately following aggression Other: any other context")
12
Results 80% M-F (N=154) 15% F-F (N=30) 3% F-M (N=5) 2% M-M (N=4)
 15% F-F (N=30) 3% F-M (N=5) 2% M-M (N=4)")
13
Context of aggression differed between M-F & F-F ( X 2 = 12 df=3 P =.007) M-F occurred most often during subgroup fusions (38%) or feeding (31%) F-F occurred most often during feeding (41%) or other (45%)
 M-F occurred most often during subgroup fusions (38%) or feeding (31%) F-F occurred most often during feeding (41%) or other (45%)")
14
Sociogram of asymmetric matrix of dyadic aggression rates (arrow points from director to receiver) Males Females Aggression rate/hour
 Males Females Aggression rate/hour")
15
Patterns of female- directed aggression at Runaway Creek are consistent with that found at other Ateles sites Results support Link et al. 2009: M-F aggression is a form of social control (indirect sexual coercion) May encourage sexual segregation as females try to avoid attacks from males
 May encourage sexual segregation as females try to avoid attacks from males.")
16
Brittany Dean, Kayley Evans, & Jane Champion Stevan Reneau, Gilroy Welch, & Birds Without Borders Dr. Tak Fung Natural Sciences and Engineering Research Council of Canada, University of Calgary, & National Geographic

17
XY = total number of males and females sampled k = total number of subgroups sampled i = selected subgroup N i = subgroup size X i Y i = number of males and females is a subgroup

Similar presentations


 at Runaway Creek Nature.>")


 at which their child first crawled.>")


 2009 Results Stuart Kerachsky Deputy Commissioner December 7, 2010.>")


>")


