Download presentation
Presentation is loading. Please wait.

1
Foundations of Comparative Analytics for Uncertainty in Graphs Lise Getoor, University of Maryland Alex Pang, UC Santa Cruz Lisa Singh, Georgetown University

2
Overview Mathematical Foundations -Probabilistic Soft Logic (PSL) Comparative Operators -Structural and semantic operators Comparative Visual Analytics of Uncertain Graphs -Novel, linked views 2
 Comparative Operators -Structural and semantic operators Comparative Visual Analytics of Uncertain Graphs -Novel, linked views 2")
3
Applications Personalized medicine Dog kennel data Dolphin social networking Ontology alignment Diffusion modeling … 3

4
PSL Overview

5
What is PSL? Declarative language based on logic to express collective probabilistic inference problems -Predicate = relationship or property -(Ground) Atom = (continuous) random variable -Rule = capture dependency or constraint -Set = define aggregates PSL Program = Rules, Sets, Constraints, Atoms 5
 Atom = (continuous) random variable -Rule = capture dependency or constraint -Set = define aggregates PSL Program = Rules, Sets, Constraints, Atoms 5.")
6
Collective Similarity Reasoning 6 Structure Weights Soft SpaceData SpaceModel Formal (Logic) Language Relations, Text, Factoids, Images, etc Inference MAP / Marginal Weight / Structure Learning
 Language Relations, Text, Factoids, Images, etc Inference MAP / Marginal Weight / Structure Learning")
7
PSL Implementation Implemented in Java / Groovy ~40k lines of code, but still alpha Performance oriented -Database backend -Memory efficient data structures -High performance solver integration

8
Comparative Operators

9
Comparing Models Output of PSL and other SRL systems can be viewed as an uncertain graph -Uncertainty attribute values -Uncertainty over edges -Uncertainty over node labels and existence Want methods for comparing, constrasting and understanding the output of two different models.

10
Operators for Comparing Uncertain Graphs Compare two graphs at different levels: attribute level, element level, ego network level, and graph level. Output of operators used as input to comparative visualizations. Example operators -Structural similarity Similarity between the general shape of two distributions. Calculated using a ratio of entropy values and ratio of absolute distances. -Semantic similarity Similarity between the probability of different values of two distributions. Calculated using KL-divergence, histogram intersection, and Minkowski- Form distance. Investigating extensions for ego network and graph level comparisons. -About 25 operators identified and being developed 10

11
Comparative Visual Analytics

12
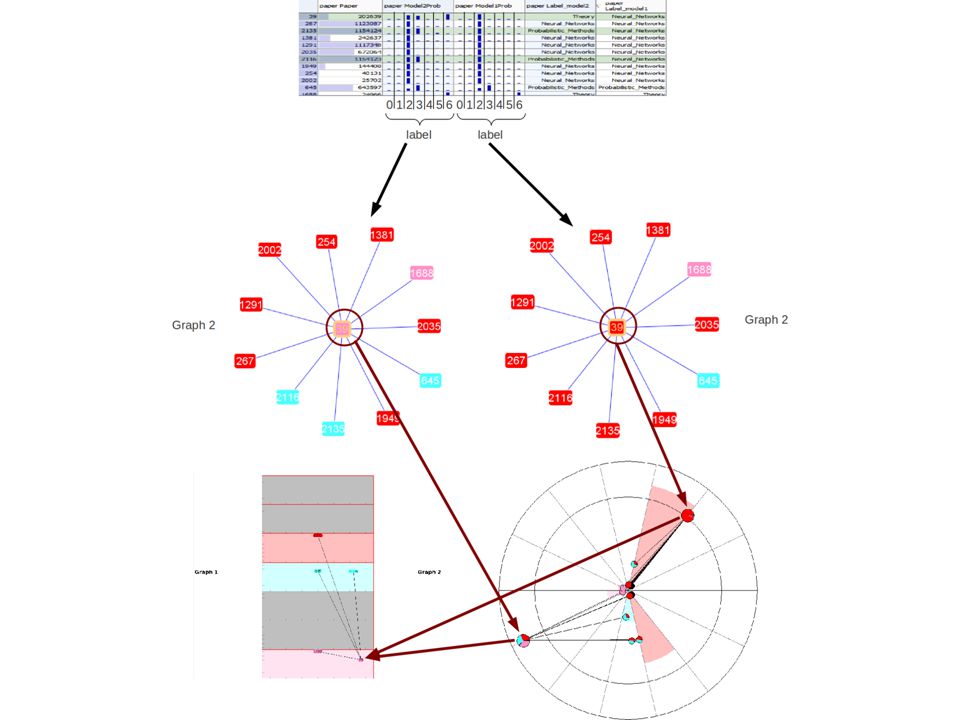
Coordinated Views (work in progress) Table View : Compare feature values from both models. Ego View : Node-link diagram of ego networks of selected node(s). OverView: Comparative column and bullseye views of both models others
. OverView: Comparative column and bullseye views of both models others.")
14
Table View

15
Filtering in Table View

16
Model 1 Model 2 Nodes: Paper, Edges: Citation Node Labels: Red=Neural Network, Blue=Probabilistic Learning, Pink=Theory Ego View: Side-by-Side

17
Ego View: Overlaid Model 1 and Model 2 in the same diagram

18
OverView 18

19
Data & Programs Other Statistical Relational Learning Software PSL Comparative Analysis Visual Analytics of Uncertain Graphs … System Overview

20
References

21
[1] Visualizing Node Attribute Uncertainty in Graphs, Nathaniel Cesario, Alex Pang, and Lisa Singh, SPIE Conference on Visualization and Data Analysis (VDA) 2011 [2] Comparative Visual Analytics for Network Data, Lise Getoor, Invited talk at NIPS Workshop on Challenges in Data Visualization, 2010 [3] Computing marginal distributions over continuous Markov networks for statistical relational learning, Matthias Broecheler, and Lise Getoor, Advances in Neural Information Processing Systems (NIPS) 2010 [4] A Scalable Framework for Modeling Competitive Diffusion in Social Networks, Matthias Broecheler, Paulo Shakarian, and V.S. Subrahmanian, International Conference on Social Computing (SocialCom) 2010, Symposium Section [5] Probabilistic Similarity Logic, Matthias Broecheler, Lilyana Mihalkova and Lise Getoor, Conference on Uncertainty in Artificial Intelligence 2010 [6] Decision-Driven Models with Probabilistic Soft Logic, Stephen H. Bach, Matthias Broecheler, Stanley Kok, Lise Getoor, NIPS Workshop on Predictive Models in Personalized Medicine 2010 21
![[1] Visualizing Node Attribute Uncertainty in Graphs, Nathaniel Cesario, Alex Pang, and Lisa Singh, SPIE Conference on Visualization and Data Analysis (VDA) 2011 [2] Comparative Visual Analytics for Network Data, Lise Getoor, Invited talk at NIPS Workshop on Challenges in Data Visualization, 2010 [3] Computing marginal distributions over continuous Markov networks for statistical relational learning, Matthias Broecheler, and Lise Getoor, Advances in Neural Information Processing Systems (NIPS) 2010 [4] A Scalable Framework for Modeling Competitive Diffusion in Social Networks, Matthias Broecheler, Paulo Shakarian, and V.S.](http://images.slideplayer.com/15/4626577/slides/slide_21.jpg "Subrahmanian, International Conference on Social Computing (SocialCom) 2010, Symposium Section [5] Probabilistic Similarity Logic, Matthias Broecheler, Lilyana Mihalkova and Lise Getoor, Conference on Uncertainty in Artificial Intelligence 2010 [6] Decision-Driven Models with Probabilistic Soft Logic, Stephen H. Bach, Matthias Broecheler, Stanley Kok, Lise Getoor, NIPS Workshop on Predictive Models in Personalized Medicine")
22
References [7] Efficient visual dynamic clustering of time varying social networks, Paul Caravelli. A senior thesis. Technical Report CSTR-20100506-6. 2010, Department of Computer Science, Georgetown University, Washington, DC 20057 [8] What are we missing? Perspectives on social network analysis for observational scientific data, L. Singh, E.J. Bienenstock and J. Mann, Handbook of Social Networks: Technologies and Applications. Ed. B. Furht., Springer, 2010 [9] Probabilistic Similarity Logic, Matthias Broecheler, and Lise Getoor, International Workshop on Statistical Relational Learning 2009 [10] Visual Graph Comparisons with Bullseyes, Nathaniel Cesario, Alex Pang, Lisa Singh, and Lise Getoor, “, Poster at IEEE VisWeek (2009) 22
![References [7] Efficient visual dynamic clustering of time varying social networks, Paul Caravelli.](http://images.slideplayer.com/15/4626577/slides/slide_22.jpg "A senior thesis. Technical Report CSTR , Department of Computer Science, Georgetown University, Washington, DC [8] What are we missing. Perspectives on social network analysis for observational scientific data, L. Singh, E.J. Bienenstock and J. Mann, Handbook of Social Networks: Technologies and Applications. Ed. B. Furht., Springer, 2010 [9] Probabilistic Similarity Logic, Matthias Broecheler, and Lise Getoor, International Workshop on Statistical Relational Learning 2009 [10] Visual Graph Comparisons with Bullseyes, Nathaniel Cesario, Alex Pang, Lisa Singh, and Lise Getoor, , Poster at IEEE VisWeek (2009) 22.")
23
Future Work Uncertainty-centric layout algorithms Limitations of linked-views Animations as a learning tool Comparative operators Integration / Components Dolphin data

24
? Questions? Comments?

Similar presentations


 Ifeoma Nwogu Lecture 27 – Overview of probability concepts 1.>")


 NETWORKS Chanhyun Kang Computer Science Dept. University of Maryland, USA Andrea Pugliese.>")


