Download presentation
Presentation is loading. Please wait.

1
Complex SDMX mapping issues for development indicators UNSD – DFID Project on Improving the collation, availability and dissemination of development indicators (including the MDGs) 22 April 2014, Phnom Penh, Cambodia
 22 April 2014, Phnom Penh, Cambodia")
2
Agenda for Today CountryData Data Structure Definition (DSD) Mapping best practices and guidelines Review of mapping process Complex SDMX cases Overview of new features in DevInfo 7 Mapping Tool
 Mapping best practices and guidelines Review of mapping process Complex SDMX cases Overview of new features in DevInfo 7 Mapping Tool")
3
Mapping best practices and guidelines

4
MDG / CountryData DSD Concepts

5
CountryData DSD Single DSD used for all MDG (and other development indicators) - superset of MDG DSD Using cross-domain concepts and codelists: Frequency (CL_FREQ) Sex (CL_SEX) Age (CL_AGE) (modified) Unit multiplier (CL_UNIT_MULT)
 - superset of MDG DSD Using cross-domain concepts and codelists: Frequency (CL_FREQ) Sex (CL_SEX) Age (CL_AGE) (modified) Unit multiplier (CL_UNIT_MULT)")
6
CountryData DSD Support for diverse indicators means not all dimensions are applicable in all cases e.g. Age Group is not applicable to indicator “Telephone lines” Value NA is used when a dimension or attribute is not applicable.

7
CountryData DSD: Mappings Not always obvious which values should be used in some dimensions What should be SEX in indicator “Births attended by skilled health personnel”: Female? Total? Not Applicable? What about the AGE dimension? NA

8
CountryData DSD: Mappings (2) Inconsistent mappings lead to duplications and other anomalies In CountryData, mappings for time series are agreed before data exchange For the MDG dataset, there has been a spreadsheet developed with the recommended mappings for each time series
 Inconsistent mappings lead to duplications and other anomalies In CountryData, mappings for time series are agreed before data exchange For the MDG dataset, there has been a spreadsheet developed with the recommended mappings for each time series")
9
CountryData DSD: Maintenance CountryData codelists are maintained by UNSD Periodically, the DSD needs to be updated A new version of the CountryData DSD (1.4), with modified codelists, was released in January 2014
, with modified codelists, was released in January 2014")
10
DevInfo 7 DevInfo 7 (Di7) launched in Nov 2012 SDMX 2.1 & 2.0 compliant Web-based software Most countries have migrated to version 7 from version 6 DevInfo Support Group has been adding enhancements and bugfixes; newest version is 7.1.0.1
 launched in Nov 2012 SDMX 2.1 & 2.0 compliant Web-based software Most countries have migrated to version 7 from version 6 DevInfo Support Group has been adding enhancements and bugfixes; newest version is")
11
Mapping to the DSD (in DevInfo) The DevInfo mapping tool is designed to facilitate the mapping of the database to the DSD based on mapping between the codelists of the DSD and origin database certain situations require further manual effort to map a time series sometimes a “fix” is required to the database where the data simply isn’t valid or where there are duplicates
 The DevInfo mapping tool is designed to facilitate the mapping of the database to the DSD based on mapping between the codelists of the DSD and origin database certain situations require further manual effort to map a time series sometimes a fix is required to the database where the data simply isn’t valid or where there are duplicates")
12
Area, hierarchical dimension IUS = Indicator, Unit and Subgroup Time series data are stored with the combination of the 3 dimensions Indicator Unit Subgroup: Combination of one or more sub-dimensions Source & Time Period Together with IUS “uniquely” defines each data value Footnote “Free text” field stored with data value DevInfo Data Architecture

13
DevInfo DatabaseCountryData DSD Area Indicator Unit Subgroup (i.e. Sex, Age, Location etc.) Source Time Period Footnotes Frequency (Default = “Annual”) Reference Area Series Units of measurement Unit multiplier (Default = 0) Location (Default = “Total”) Age group (Default = “All Ages”) Sex (Default = “Both Sexes”) Source Type (Default = “NA”) Source details Time Period Time period details Nature of data points (Default = “C”) Footnotes
 Source Time Period Footnotes Frequency (Default = Annual ) Reference Area Series Units of measurement Unit multiplier (Default = 0) Location (Default = Total ) Age group (Default = All Ages ) Sex (Default = Both Sexes ) Source Type (Default = NA ) Source details Time Period Time period details Nature of data points (Default = C ) Footnotes.")
14
DevInfo Mapping Process Review

15
Go to: unstats.un.org/demoginfo1 ( /demoginfo2 /demoginfo3 /demoginfo4 /demoginfo5 /demoginfo6 )
")
16
Log onto administrative profile

17
Username: webmaster@xyz.com Password: 1234

18
Scroll down to ‘Registry’ menu

19
Step 1: Codelist mapping

20
Step 1: (A) Map Indicator codes
 Map Indicator codes")
21
Step 1: (B) Map Unit codes
 Map Unit codes")
22
Step 1: (C) Map Subgroup codes
 Map Subgroup codes")
23
Step 1: (C) Choose Subgroup list
 Choose Subgroup list")
24
Step 1: (C) Map Age subgroup
 Map Age subgroup")
25
Step 1: (C) Map Sex & Location
 Map Sex & Location")
26
Step 1: (D) Map Area
 Map Area")
27
Step 1: Save codelist mappings

28
Step 1: Ignore warning

29
Step 1: Confirm mapping saved

30
Step 1: Complete

31
Exercise 1: Codelist mapping Use unstats.un.org/demoginfo[1-6] Map the codelists (where possible) for: Just one indicator, “Antenatal care coverage for at least one visit” Unit Age Sex Location Area
![Exercise 1: Codelist mapping Use unstats.un.org/demoginfo[1-6] Map the codelists (where possible) for: Just one indicator, Antenatal care coverage for at least one visit Unit Age Sex Location Area](http://images.slideplayer.com/15/4612148/slides/slide_31.jpg "Exercise 1: Codelist mapping Use unstats.un.org/demoginfo[1-6] Map the codelists (where possible) for: Just one indicator, Antenatal care coverage for at least one visit Unit Age Sex Location Area")
32
Step 2: Confirm IUS mapping

33
Step 2: Save IUS Mappings

34
Why is Step 2 necessary? The default values for SEX, LOCATION or AGE GROUP mapping may not be applicable to all mappings The codelist mapping may only provide a partial mapping of the time series (i.e. more information is required) Any necessary mapping changes are made in Step 2
 Any necessary mapping changes are made in Step 2.")
35
Where are the default values?

36
Admin panel: Application settings Insert screens shot/details of admin panel and default value storage… Scroll down

37
Application settings: mapping default values

38
Mapping of SUBGROUP (Defaults) IndicatorUnit Where a subgroup value is missing the default values will apply: Default Values Location = T
 IndicatorUnit Where a subgroup value is missing the default values will apply: Default Values Location = T")
39
Overriding defaults in mapping of SUBGROUP Indicator Unit Subgroups? Default Values Location = T Age Group = 000_099_Y Sex = Both sexes Common example of where default subgroup mappings do not apply

40
Overriding defaults in mapping of SUBGROUP Indicator Unit Subgroup for Age and Sex? Default Values Age Group = 000_099_Y Sex = T So subgroups coverage affects the number of manual changes which have to be made…

41
Using the Other subgroup to clump age, sex and location information results in more manual mapping Overriding defaults in mapping of SUBGROUP Indicator Unit Subgroup for Location, Age and Sex? Default Values Location = T Age Group = 000_099_Y Sex = T ?

42
Step 2: Amend Indicator When using the check box to tick the mapping, you are “fixing” the mapped DSD values. If the box is unchecked again and the mappings saved, then DSD values revert to those mapped at codelist / default values (i.e. any manual changes are undone.)
.")
43
Exercise 2: Mapping time series Use unstats.un.org/demoginfo[1-6] Username = webmaster@xyz.com Password = 1234 Map the time series for 1. “Literacy rate of 15-24 year-olds” 2. “Condom use at last high risk sex (Version 2)” 3. “Land under forest cover”
![Exercise 2: Mapping time series Use unstats.un.org/demoginfo[1-6] Username = Password = 1234 Map the time series for 1.](http://images.slideplayer.com/15/4612148/slides/slide_43.jpg "Literacy rate of year-olds 2. Condom use at last high risk sex (Version 2) 3. Land under forest cover .")
44
Step 2: Complete

45
Final Step: Register mappings

46
Final Step: Generate SDMX-ML

47
Final Step: Complete

48
Complex SDMX Cases

49
Complex mappings under the 1 st and 2 nd mapping steps Most commonly mappings need to be overridden for dimensions Sex, Age Group and Location But sometimes manual changes are required between DevInfo and DSD indicator and unit, such as when… More than one DevInfo code relates to a single DSD code OR More than one DSD code relates to a single DevInfo code

50
Many-to-one mapping for Indicator codelist (Example 1) Indicator
 Indicator")
51
Many-to-one mapping for Indicator codelist (Example 2) Indicator
 Indicator")
52
Many-to-one mapping for Indicator codelist (Example 3)
")
53
Unit Many-to-one mapping for Unit codelist (Example 1)
")
54
One-to-many mapping of Indicator Indicator Subgroup Manual change ?

55
One-to-many mapping of Indicator Indicator Unit Manual change ? Subgroup

56
“Manual” mapping of UNIT Indicator Unit Manual change Unit = “Ratio”

57
Attribute: Unit Multiplier (UNIT_MULT) “Exponent in base 10 that multiplied by the observation numeric value gives the result expressed in the unit of measure.” If the observation value is in millions, unit multiplier is 6; if in billions, 9, and so on. Where the number is simple units, use 0. Mandatory attribute

58
Attribute: Unit Multiplier (UNIT_MULT)
")
59
Back to mapping…

60
Example 1: Many-to-one mapping

61
Example 2: One-to-many mapping

62
Final Step: Register new mappings

63
Exercise 3: Complex mappings Use unstats.un.org/demoginfo[1-6] Map/ amend/ publish the time series for: 1. “Gender parity index in primary education” 2. “Seats held by men in national parliament” 3. “Seats held by women in national parliament” 4. “Telephone lines”
![Exercise 3: Complex mappings Use unstats.un.org/demoginfo[1-6] Map/ amend/ publish the time series for: 1.](http://images.slideplayer.com/15/4612148/slides/slide_63.jpg "Gender parity index in primary education 2. Seats held by men in national parliament 3. Seats held by women in national parliament 4. Telephone lines .")
64
Other issues encountered with generating SDMX from DevInfo The CountryData DSD requires any data point to be uniquely described by the following dimensions: However, DevInfo allows data to be stored in overlapping time intervals and with multiple sources. These issues need to be resolved to conform to the “uniqueness” required by the CountryData DSD.

65
Multiple sources Allowable in DevInfo but not in the DSD

66
Overlapping time This issue is only a problem where overlapping periods begin from the same year, as the mapping tool takes the first year in the period as the value for the “Time Period” dimension.

67
Targets in the database Targets are also an issue when found in the database since they should not be exchanged as observed values

68
Target in database (Example 1) Sometimes stored as subgroup which can be ignored at the 2 nd stage…
 Sometimes stored as subgroup which can be ignored at the 2 nd stage…")
69
Target in database (Example 2) But other times can be found as a time period among observed values…
 But other times can be found as a time period among observed values…")
70
Use of filters at registration To deal with the issues of multiple sources for a given time period overlapping time period beginning with the same year targets presented alongside observed values The registration page provides a feature to filter out data from a generated SDMX message associated with specific time periods and source references

71
Filter by time/ source

72
Final Step: Select source filter

73
Filter by time

74
Final Step: Select time filter

75
Final Step: Register new mappings

76
Final Step: Complete

77
Exercise 4: Filter time series Use unstats.un.org/demoginfo[1-6] Map/ amend/ publish the time series for; 1. “Under-five mortality rate” 2. “Maternal mortality ratio (MMR)” 3. “Tuberculosis prevalence rate” 4. “Proportion of the population using improved sanitation facilities”
![Exercise 4: Filter time series Use unstats.un.org/demoginfo[1-6] Map/ amend/ publish the time series for; 1.](http://images.slideplayer.com/15/4612148/slides/slide_77.jpg "Under-five mortality rate 2. Maternal mortality ratio (MMR) 3. Tuberculosis prevalence rate 4. Proportion of the population using improved sanitation facilities .")
78
New features in DevInfo 7.1

79
Improved Quick Data Search

80
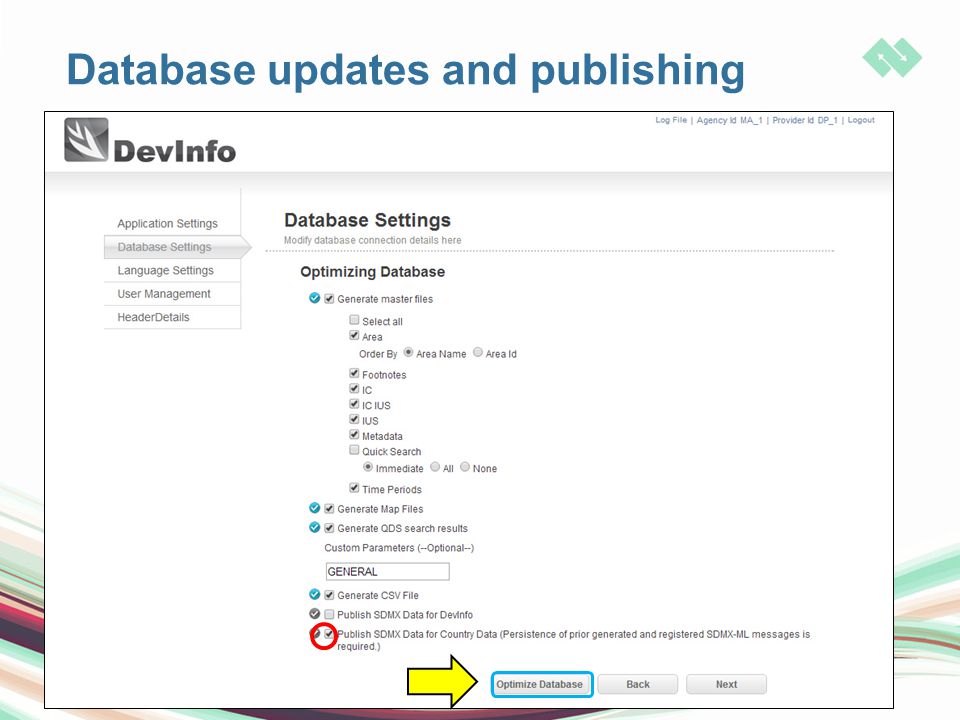
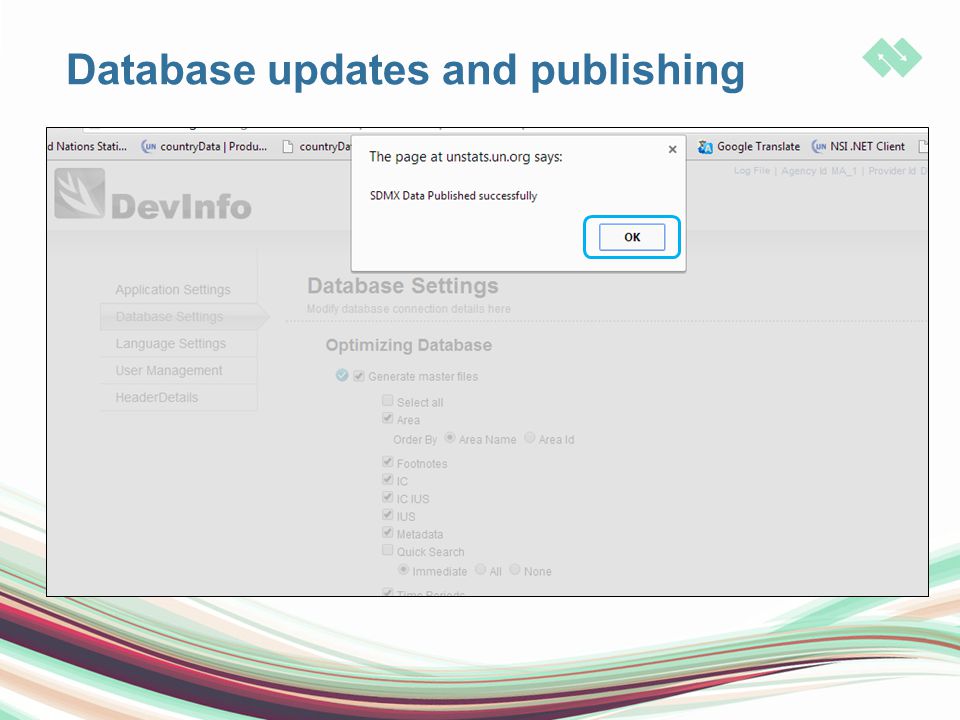
Database updates and publishing After updating your database with new data, you can optimize and publish the updates in SDMX at the same time in Admin Panel

81
Database updates and publishing

84
DevInfo installation and upgrading The latest version of DevInfo is 7.1.0.1 Starting with this version, you no longer need to uninstall and reinstall in order to upgrade Instead you will use patches available on the DevInfo Downloads page

85
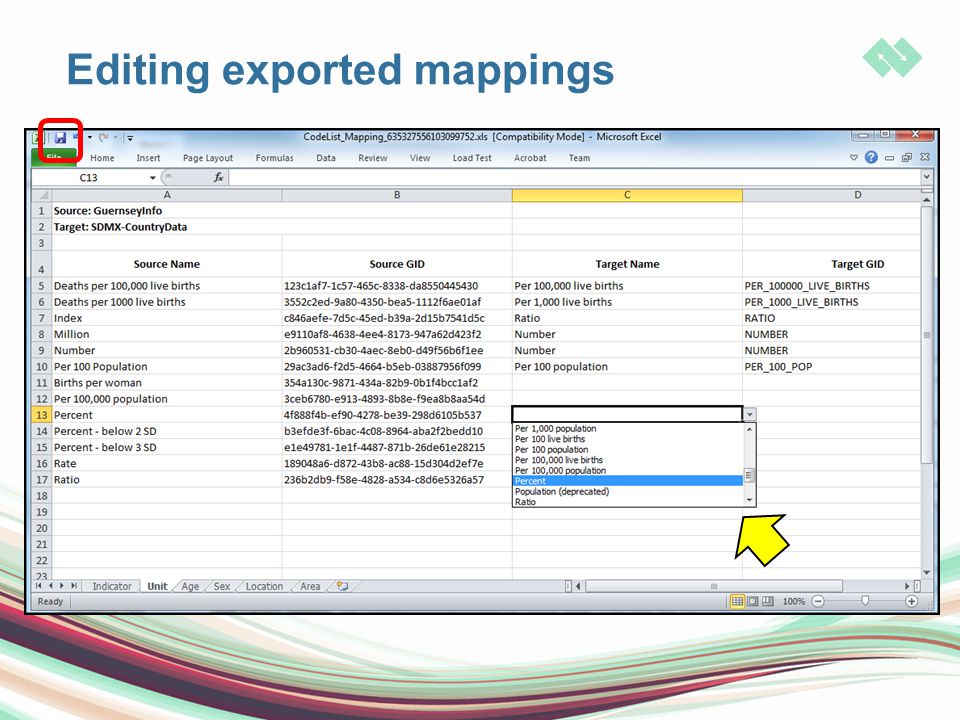
Exporting and importing mappings

86
Exporting mappings

87
Editing exported mappings

89
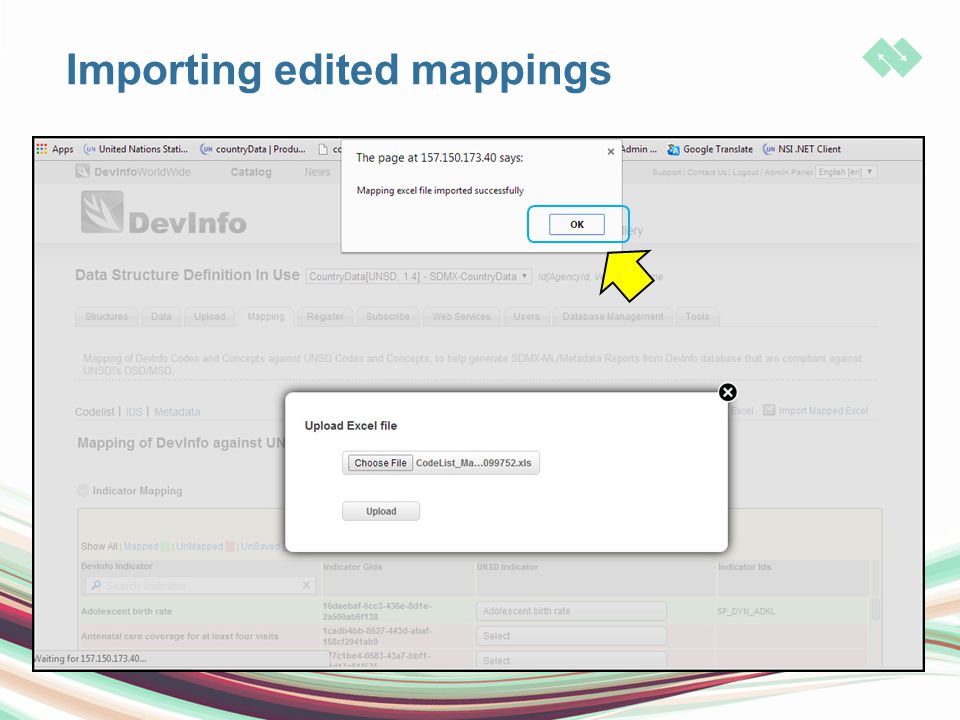
Exporting and importing mappings

90
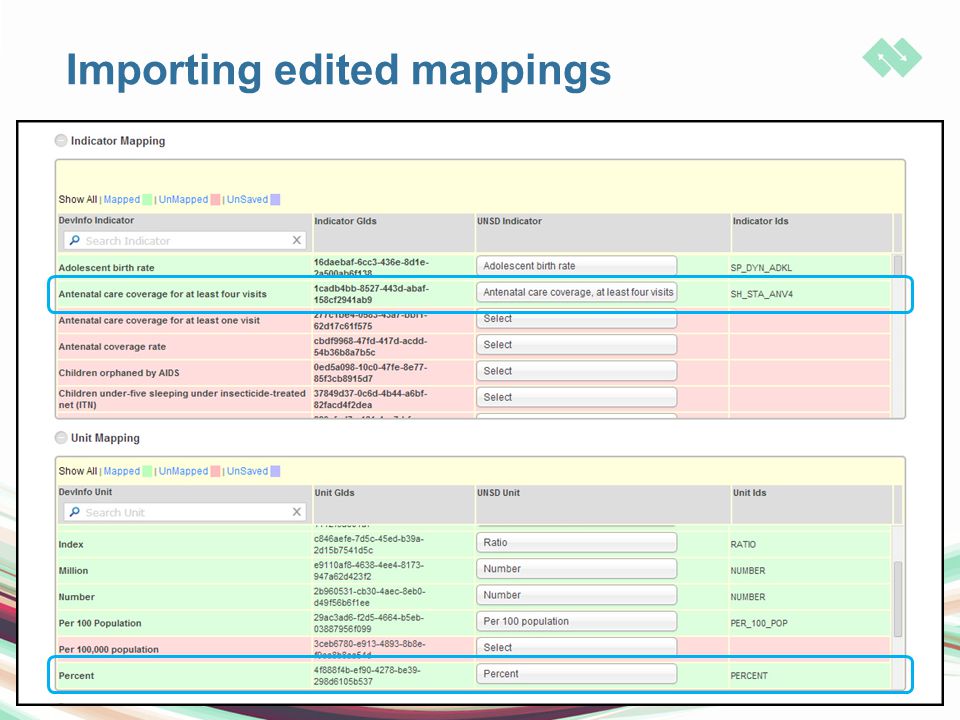
Importing edited mappings

93
Thank you for your attention

Similar presentations


 Nairobi, 27 November 2013.>")

 MSIS – Meeting on the Management of Statistical Information Systems 1.>")

 BY Mr. Houssam EL OUINKHIR : Computer developer and DBA oracle 1 UNSD-DFID Project:>")
