Download presentation
Presentation is loading. Please wait.

1
Chapter 10 Inference on Two Samples 10.4 Inference on Two Population Standard Deviations

2
Requirements for Testing Claims Regarding Two Population Standard Deviations 1. The samples are independent simple random samples.

3
Requirements for Testing Claims Regarding Two Population Standard Deviations 1. The samples are independent simple random samples. 2. The populations from which the samples are drawn are normally distributed.

6
Fisher's F-distribution

7
Characteristics of the F-distribution 1. It is not symmetric. The F-distribution is skewed right.

8
Characteristics of the F-distribution 1. It is not symmetric. The F-distribution is skewed right. 2. The shape of the F-distribution depends upon the degrees of freedom in the numerator and denominator. This is similar to the distribution and Student’s t-distribution, whose shape depends upon their degrees of freedom.

9
Characteristics of the F-distribution 1. It is not symmetric. The F-distribution is skewed right. 2. The shape of the F-distribution depends upon the degrees of freedom in the numerator and denominator. This is similar to the distribution and Student’s t-distribution, whose shape depends upon their degrees of freedom. 3. The total area under the curve is 1.

10
Characteristics of the F-distribution 1. It is not symmetric. The F-distribution is skewed right. 2. The shape of the F-distribution depends upon the degrees of freedom in the numerator and denominator. This is similar to the distribution and Student’s t-distribution, whose shape depends upon their degrees of freedom. 3. The total area under the curve is 1. 4. The values of F are always greater than or equal to zero.

12
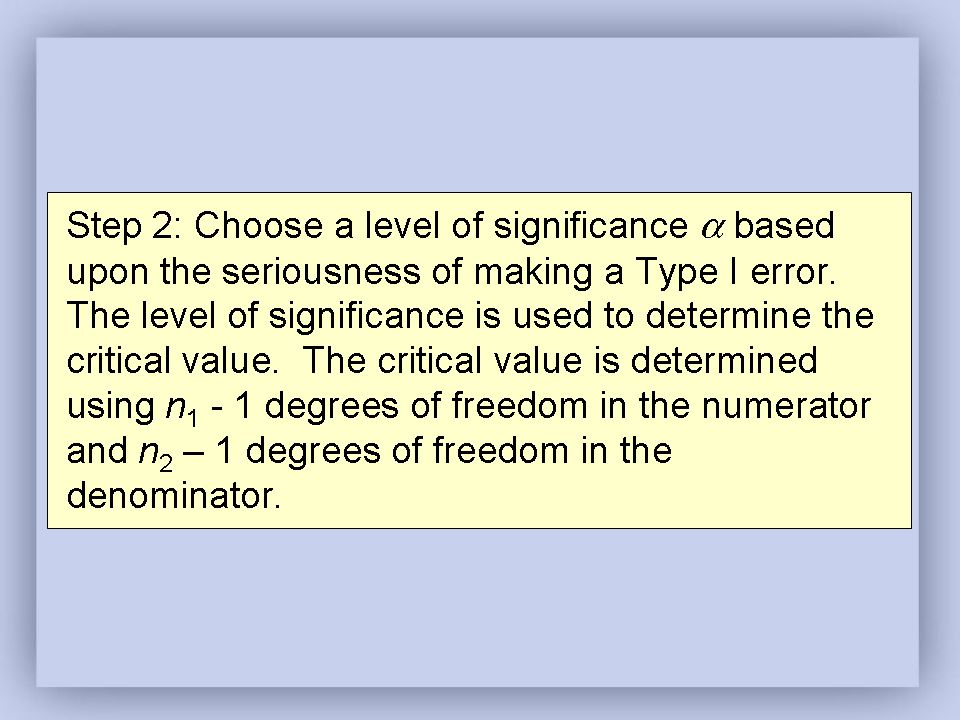
Is the critical F with n 1 – 1 degrees of freedom in the numerator and n 2 – 1 degrees of freedom in the denominator and an area of to the right of the critical F.

13
To find the critical F with an area of α to the left, use the following:

14
EXAMPLE Finding Critical F values Find the critical F-value (a) for a right-tailed test with = 0.1, degrees of freedom in the numerator = 8 and degrees of freedom in the denominator = 4. (b) for a two-tailed test with = 0.05, degrees of freedom in the numerator = 20 and degrees of freedom in the denominator = 15.
 for a two-tailed test with = 0.05, degrees of freedom in the numerator = 20 and degrees of freedom in the denominator = 15..")
15
Hypothesis Test Regarding the Two Means Population Standard Deviations

Similar presentations


>")


 (Small Samples)>")


