Download presentation
Presentation is loading. Please wait.

1
Spencer Anderson Brent Fogleman Daryl Vonhagel

2
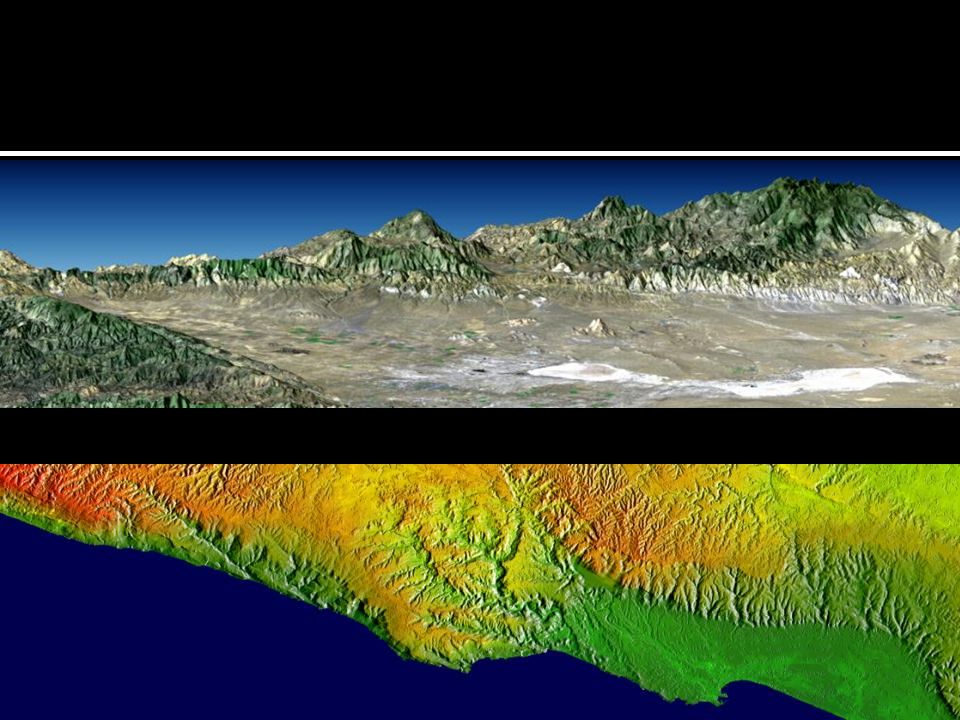
Objectives: C-band (w = 3.8 – 7.5 cm) & X-band (w = 2.4 – 3.8 cm) IFSAR to acquire topographic data over 80% of Earth’s land mass Produced digital topographic maps with: ▪ 30m x 30m spatial sampling ▪ <= 16 m absolute vertical accuracy ▪ <= 10 m relative vertical accuracy ▪ <= 20 m absolute horizontal circular accuracy
 & X-band (w = 2.4 – 3.8 cm) IFSAR to acquire topographic data over 80% of Earth’s land mass Produced digital topographic maps with: ▪ 30m x 30m spatial sampling ▪ <= 16 m absolute vertical accuracy ▪ <= 10 m relative vertical accuracy ▪ <= 20 m absolute horizontal circular accuracy")
3
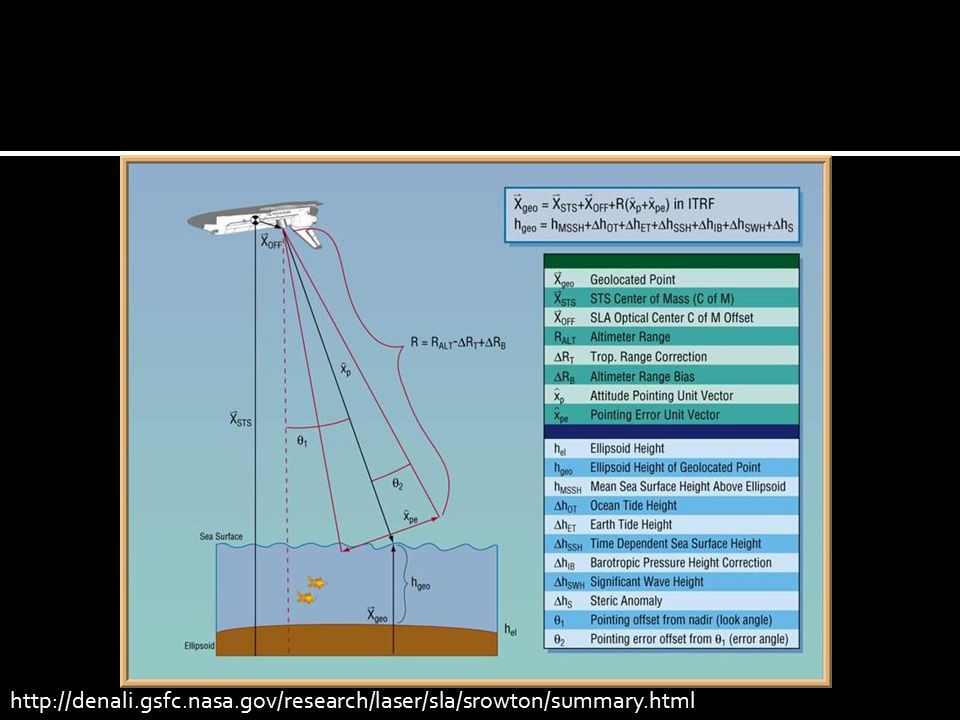
http://denali.gsfc.nasa.gov/research/laser/sla/srowton/summary.html
4
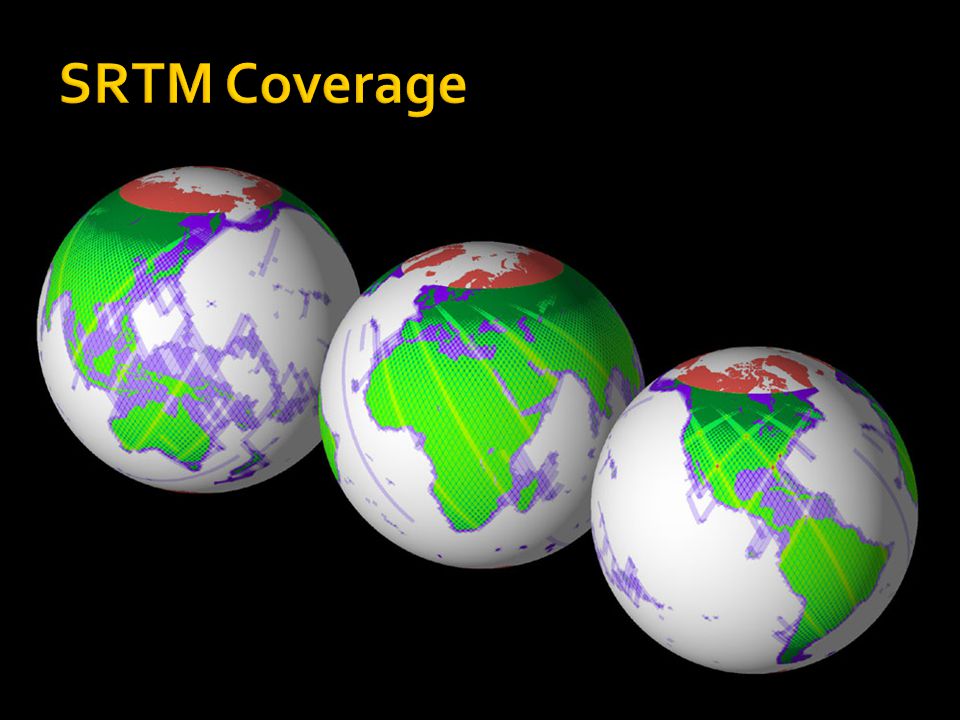
DATA COVERAGE: Shuttle Radar Topography Mission collected data over most of the land surfaces that lay between 60 degrees north latitude and 54 degrees south latitude. That's about 80% of all the land on the Earth. Data Statistics Land coverage: Targeted land was 80% of Earth landmass (119.56 M km 2, 46.16 M mi 2 ) 99.968% targeted land mapped at least once (119.51 M km 2, 46.14 M mi 2 ) 94.59% targeted land mapped at least twice (113.10 M km 2, 43.66 M mi 2 ) 49.25% targeted land mapped at least 3 times (58.59 M km 2, 22.73 M mi 2 ) 24.10% targeted land mapped at least 4 times (28.81 M km 2, 11.12 M mi 2 ) Land area missed:50,000 km2 (all in US) Radar system acquired topographic data for >47.6 million miles 2 of Earth Total imaging time: ~10 days 99.96% of planned coverage area mapped during STS-99 Space Shuttle mission Sophisticated radar collected surface imaging data at a rate of 40,000 miles 2 / min
 % targeted land mapped at least once ( M km 2, M mi 2 ) 94.59% targeted land mapped at least twice ( M km 2, M mi 2 ) 49.25% targeted land mapped at least 3 times (58.59 M km 2, M mi 2 ) 24.10% targeted land mapped at least 4 times (28.81 M km 2, M mi 2 ) Land area missed:50,000 km2 (all in US) Radar system acquired topographic data for >47.6 million miles 2 of Earth Total imaging time: ~10 days 99.96% of planned coverage area mapped during STS-99 Space Shuttle mission Sophisticated radar collected surface imaging data at a rate of 40,000 miles 2 / min.")
7
http://photojournal.jpl.nasa.gov/jpegMod/PIA03377_modest.jpg

8
SRTM SAR ASTER

10
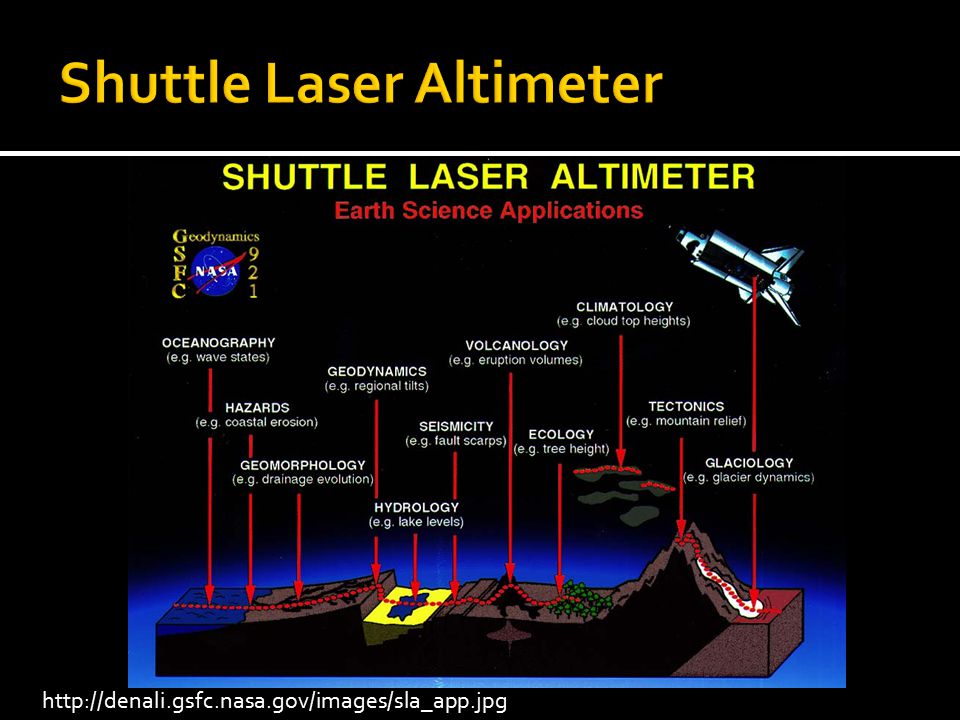
http://denali.gsfc.nasa.gov/images/sla_app.jpg
11
http://denali.gsfc.nasa.gov/research/laser/sla/sla1.html

12
http://denali.gsfc.nasa.gov/lapf_web/claudia/plots/global_loc01_02.jpg

13
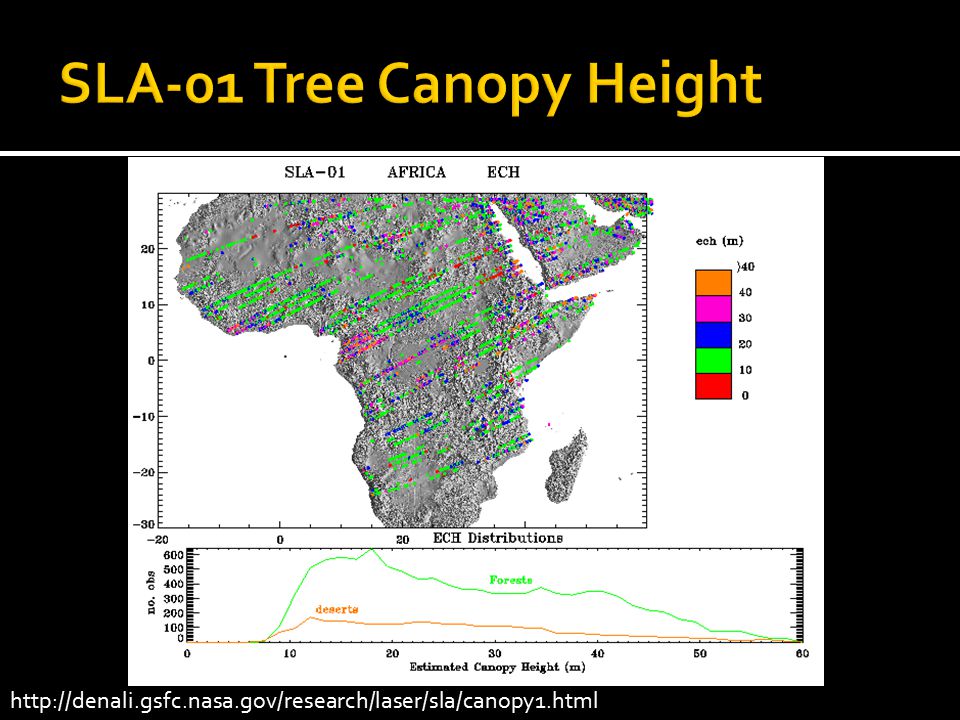
http://denali.gsfc.nasa.gov/research/laser/sla/canopy1.html
14
http://events.eoportal.org/get_announce.php?an_id=10001248

15
Circular, sun-synchronous, and near polar Nominal altitude: 705 km at Equator Crosses Equator from N to S on descending orbital node between 10:00 and 10:15 AM each pass Speed: 7.5 km/sec; period ~ 99 min; 14 orbits/day Covers entire Earth between 81 deg N & S every 16 days Multispectral data set with both high (30m) & medium to coarse (250 to 1000 m) spatial resolution acquired on a global basis repetitively
 & medium to coarse (250 to 1000 m) spatial resolution acquired on a global basis repetitively")
16
Scene Size: 183 km cross-track, 170 km along track 3.6 Gbits in 24 seconds Instantaneous FOV: 30m pixel Radiometric Accuracy: 5% absolute, 2% relative Data Rate: 150 Mbps on two 75 Mbps channels (I & Q) Scan Frequency: 7 Hz
 Scan Frequency: 7 Hz")
17
Enhanced Thematic Mapper Plus (ETM+) Eight spectral bands, including panchromatic and thermal band: Band 1 Visible (0.45 – 0.52 m) 30 m Band 2 Visible (0.52 – 0.60 m) 30 m Band 3 Visible (0.63 – 0.69 m) 30 m Band 4 Near-Infrared (0.77 – 0.90 m) 30 m Band 5 Near-Infrared (1.55 – 1.75 m) 30 m Band 6 Thermal (10.44 – 12.50 m) 60 m Band 7 Mid-Infrared (2.08 – 2.35 m) 30 m Band 8 Panchromatic(0.52 – 0.90 m) 15 m Ground sampling Interval (pixel size): 30 m reflective, 60 m thermal Added the Band 6 Low and High gain 60 m thermal bands On-board calibration was added to Landsat 7: a Full Aperture Solar Calibrator (FASC) and a Partial Aperture Solar Calibrator (PASC); in addition to the 2 calibration lamps
 Eight spectral bands, including panchromatic and thermal band: Band 1 Visible (0.45 – 0.52 m) 30 m Band 2 Visible (0.52 – 0.60 m) 30 m Band 3 Visible (0.63 – 0.69 m) 30 m Band 4 Near-Infrared (0.77 – 0.90 m) 30 m Band 5 Near-Infrared (1.55 – 1.75 m) 30 m Band 6 Thermal (10.44 – m) 60 m Band 7 Mid-Infrared (2.08 – 2.35 m) 30 m Band 8 Panchromatic(0.52 – 0.90 m) 15 m Ground sampling Interval (pixel size): 30 m reflective, 60 m thermal Added the Band 6 Low and High gain 60 m thermal bands On-board calibration was added to Landsat 7: a Full Aperture Solar Calibrator (FASC) and a Partial Aperture Solar Calibrator (PASC); in addition to the 2 calibration lamps")
18
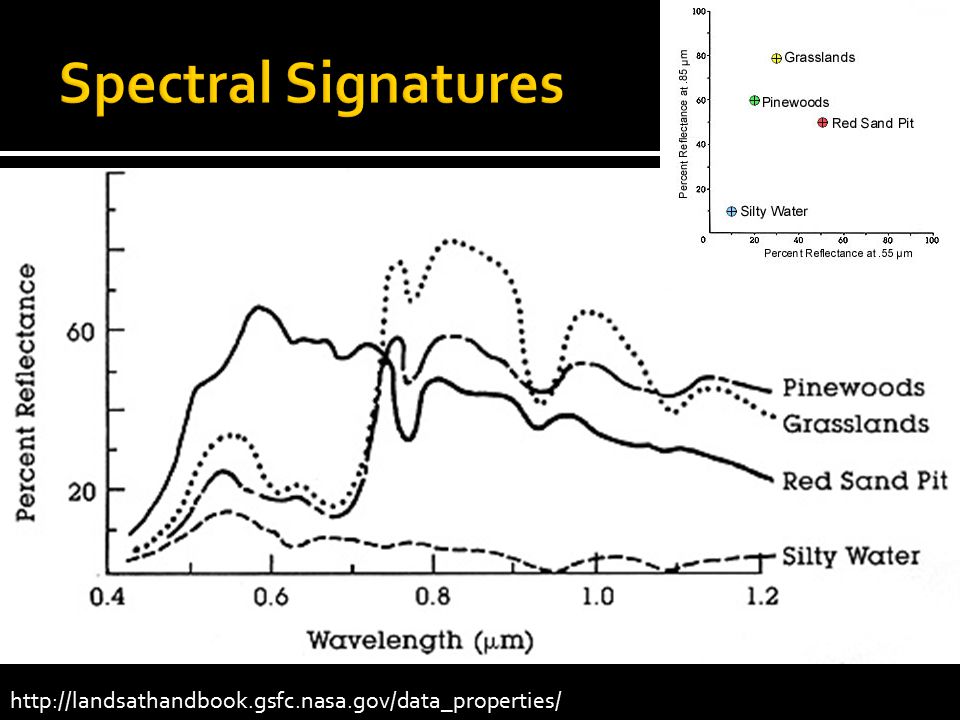
http://landsathandbook.gsfc.nasa.gov/data_properties/
Similar presentations

 THEOS / Land Surface.>")


, infrared (BW, Color) –RADAR (SLAR, SAR) –LIDAR (light detection and ranging)>")


-Polar Orbiting Environmental Satellite (POES) Orbital characteristics.>")


