Download presentation
Presentation is loading. Please wait.

1
No Data Left Behind Modeling Colorful Compounds in Chemical Equilibria Mike DeVries D. Kwabena Bediako Prof. Douglas A. Vander Griend

2
Outline What is chemical equilibrium? What makes color data good or not-so-good? How does matrix algebra work again? What is Sivvu and how does it work?

3
What is Chemical Equilibrium? When chemicals react, they ultimately form a balance between products and reactants such that the ratio is a constant: [products]/[reactants] = K equilibrium Log(products) – Log(reactants) = LogK eq = - G/RT G is called free energy.
 – Log(reactants) = LogK eq = - G/RT G is called free energy..")
4
Example Seal.04 mole of NO 2 in a 1 liter container. 2NO 2 N 2 O 4 G = -5.40 kJ/mol (@ 25°C) [N 2 O 4 ]/[NO 2 ] 2 = K eq = exp(- G/RT) = 8.97 Let x amount of NO 2 that reacts. (0.5x)/(.04-x) 2 = 8.97 x =.01304, or 32.6% reacts
 [N 2 O 4 ]/[NO 2 ] 2 = K eq = exp(- G/RT) = 8.97 Let x amount of NO 2 that reacts. (0.5x)/(.04-x) 2 = 8.97 x =.01304, or 32.6% reacts.")
5
Demonstration A B 1. Secretly choose A or B and submit choice. 2. As directed, choose A or B again: If last time you submitted A, now submit B. If last time you submitted B, Submit B again if coin flip shows tails Submit A if coin flip shows heads 3. Repeat #2 as directed.

6
Multiple Equilibria Solving one equilibrium equation can be tricky. Solving simultaneous equilibria requires a computer.

7
Exhaust Example Calculate the equilibrium amounts of CO 2, N 2, H 2 O, CO, O 2, NO, and H 2 after burning 1 mole of C 3 H 8 in air. 4 mass balance equations, 1 for each element: Carbon = 3, Hydrogen = 8, Nitrogen = 40 and Oxygen = 10 3 equilibrium equations: 2CO + O 2 2CO 2 G = -187.52 kJ/mol N 2 + O 2 2NO G = 125.02 kJ/mol 2H 2 + O 2 2H 2 O G = -247.86 kJ/mol

8
Exhaust Example 4 mass balance equations: Carbon = 3 Hydrogen = 8 Nitrogen = 40 Oxygen = 10 3 equilibrium equations: [CO 2 ] 2 /[CO] 2 /[O 2 ] = 41874 [NO] 2 /[N 2 ]/[O 2 ] = 0.001075 [H 2 O] 2 /[H 2 ] 2 /[O 2 ] = 1134096 SpeciesAmount CO 2 2.923 N2N2 19.99 H2OH2O3.980 CO0.07667 O2O2 0.03471 NO0.02732 H2H2 0.02006
![Exhaust Example 4 mass balance equations: Carbon = 3 Hydrogen = 8 Nitrogen = 40 Oxygen = 10 3 equilibrium equations: [CO 2 ] 2 /[CO] 2 /[O 2 ] = [NO] 2 /[N 2 ]/[O 2 ] = [H 2 O] 2 /[H 2 ] 2 /[O 2 ] = SpeciesAmount CO N2N H2OH2O3.980 CO O2O NO H2H](http://images.slideplayer.com/15/4577302/slides/slide_8.jpg "Exhaust Example 4 mass balance equations: Carbon = 3 Hydrogen = 8 Nitrogen = 40 Oxygen = 10 3 equilibrium equations: [CO 2 ] 2 /[CO] 2 /[O 2 ] = [NO] 2 /[N 2 ]/[O 2 ] = [H 2 O] 2 /[H 2 ] 2 /[O 2 ] = SpeciesAmount CO N2N H2OH2O3.980 CO O2O NO H2H")
9
Metal Complexation Reactions [Ni] 2+ + py [Nipy] 2+ G 1 [Nipy] 2+ + py [Nipy 2 ] 2+ G 2 [Nipy 2 ] 2+ + py [Nipy 3 ] 2+ G 3 [Nipy 3 ] 2+ + py [Nipy 4 ] 2+ G 4 [Nipy 4 ] 2+ + py [Nipy 5 ] 2+ G 5 [Nipy 5 ] 2+ + py [Nipy 6 ] 2+ … Ni
![Metal Complexation Reactions [Ni] 2+ + py [Nipy] 2+ G 1 [Nipy] 2+ + py [Nipy 2 ] 2+ G 2 [Nipy 2 ] 2+ + py [Nipy 3 ] 2+ G 3 [Nipy 3 ] 2+ + py [Nipy 4 ] 2+ G 4 [Nipy 4 ] 2+ + py [Nipy 5 ] 2+ G 5 [Nipy 5 ] 2+ + py [Nipy 6 ] 2+ … Ni](http://images.slideplayer.com/15/4577302/slides/slide_9.jpg "Metal Complexation Reactions [Ni] 2+ + py [Nipy] 2+ G 1 [Nipy] 2+ + py [Nipy 2 ] 2+ G 2 [Nipy 2 ] 2+ + py [Nipy 3 ] 2+ G 3 [Nipy 3 ] 2+ + py [Nipy 4 ] 2+ G 4 [Nipy 4 ] 2+ + py [Nipy 5 ] 2+ G 5 [Nipy 5 ] 2+ + py [Nipy 6 ] 2+ … Ni")
10
Pyridine and Nickel Ni 2+ and BF 4 - in methanol equivalents of pyridine added: 12345

11
UV-visible Spectroscopy Absorbance = · Concentration (Beer-Lambert Law) 0.1046 M Ni(BF 4 ) 2 in methanol Ni 2+
 M Ni(BF 4 ) 2 in methanol Ni 2+")
12
Color is Additive Ni 2+ BF 4 - py Abs = 0 [Ni] 2+ + 1 [Nipy] 2+ + 2 [Nipy 2 ] 2+ + 3 [Nipy 3 ] 2+ + … 0.0997 M Ni(BF 4 ) 2 w/ 0.585 pyridine
![Color is Additive Ni 2+ BF 4 - py Abs = 0 [Ni] 2+ + 1 [Nipy] 2+ + 2 [Nipy 2 ] 2+ + 3 [Nipy 3 ] 2+ + … M Ni(BF 4 ) 2 w/ pyridine](http://images.slideplayer.com/15/4577302/slides/slide_12.jpg "Color is Additive Ni 2+ BF 4 - py Abs = 0 [Ni] 2+ + 1 [Nipy] 2+ + 2 [Nipy 2 ] 2+ + 3 [Nipy 3 ] 2+ + … M Ni(BF 4 ) 2 w/ pyridine")
13
What we know is not very much [Ni] 2+ + py [Nipy] 2+ G 1 [Nipy] 2+ + py [Nipy 2 ] 2+ G 2 [Nipy 2 ] 2+ + py [Nipy 3 ] 2+ G 3 [Nipy 3 ] 2+ + py [Nipy 4 ] 2+ G 4 [Nipy 4 ] 2+ + py [Nipy 5 ] 2+ G 5 [Nipy 5 ] 2+ + py [Nipy 6 ] 2+ … Ni
![What we know is not very much [Ni] 2+ + py [Nipy] 2+ G 1 [Nipy] 2+ + py [Nipy 2 ] 2+ G 2 [Nipy 2 ] 2+ + py [Nipy 3 ] 2+ G 3 [Nipy 3 ] 2+ + py [Nipy 4 ] 2+ G 4 [Nipy 4 ] 2+ + py [Nipy 5 ] 2+ G 5 [Nipy 5 ] 2+ + py [Nipy 6 ] 2+ … Ni](http://images.slideplayer.com/15/4577302/slides/slide_13.jpg "What we know is not very much [Ni] 2+ + py [Nipy] 2+ G 1 [Nipy] 2+ + py [Nipy 2 ] 2+ G 2 [Nipy 2 ] 2+ + py [Nipy 3 ] 2+ G 3 [Nipy 3 ] 2+ + py [Nipy 4 ] 2+ G 4 [Nipy 4 ] 2+ + py [Nipy 5 ] 2+ G 5 [Nipy 5 ] 2+ + py [Nipy 6 ] 2+ … Ni")
14
The Problem We don’t know the wavelength-dependent colors or the equilibrium constants! We can’t measure the independent color (absorptivities) because all the compounds are present together. We don’t know the amounts of the compounds because they have equilibrated. Almost all the data is composite.
 because all the compounds are present together. We don’t know the amounts of the compounds because they have equilibrated. Almost all the data is composite..")
15
The Solution It is possible, using advanced mathematical computations, to isolate information about pure species without chemically isolating them. How? Generate more composite data by making more mixtures with differing amounts of reactants. Model all the data according to chemical equilibria and the Beer-Lambert law for combining absorbances.

16
Why it Works Each data point corresponds to a single equation. For each point on the same curve, the [concentrations] are the same. For each point at the same wavelength, the molar absorptivities, n, are the same. With enough solution mixtures then, there will be more equations than unknowns. This is known as an overexpressed mathematical system which can theoretically be solved with error analysis. Abs = 0 [Ni] 2+ + 1 [Nipy] 2+ + 2 [Nipy 2 ] 2+ + 3 [Nipy 3 ] 2+ + …

17
Matrix Algebra Refresher 2x + 3y = 8 3x – y = 5

18
Matrix Multiplication C = AB (n x p)(n x m)(m x p)
(n x m)(m x p)")
19
Matrix Algebra Abs = 0 [Ni] 2+ + 1 [Nipy] 2+ + 2 [Nipy 2 ] 2+ + 3 [Nipy 3 ] 2+ + …
![Matrix Algebra Abs = 0 [Ni] 2+ + 1 [Nipy] 2+ + 2 [Nipy 2 ] 2+ + 3 [Nipy 3 ] 2+ + …](http://images.slideplayer.com/15/4577302/slides/slide_19.jpg "Matrix Algebra Abs = 0 [Ni] 2+ + 1 [Nipy] 2+ + 2 [Nipy 2 ] 2+ + 3 [Nipy 3 ] 2+ + …")
20
Matrix Form of Beer-Lambert Law Absorbances (n x p) (n x m) Concentration (m x p) Molar Absorbtivity n # of wavelengths m # of chemical species p # of mixture solutions
 (n x m) Concentration (m x p) Molar Absorbtivity n # of wavelengths m # of chemical species p # of mixture solutions")
21
Measured Absorbances Absorbances (n x p) n = number of wavelengths p = number of solution mixtures Every column is a UV-vis curve. Every row is a wavelength So there are a total of np absorbance data points, each associated with a distinct equation. The total absorbance at any particular point is the sum of the absorbances of all the chemical species in solution according to Beer-Lambert Law.

22
Molar Absorptivities (n x m) Every column represents one of the m chemical species. Every row is a wavelength This smaller matrix contains all of the molar absorbtivity values for each pure chemical species in the mixtures at every wavelength.

23
Component Concentrations Concentration (m x p) Every column corresponds to one of the p solution mixtures (UVvis curve). Each row represents one of the m chemical species. This smaller concentration matrix contains the absolute concentration of each chemical species in each of the solution mixtures.

24
Matrix Absorbance Equation Absorbances (n x p) (n x m) Concentration (m x p) So the problem is essentially factoring a matrix. …Or solving np equations for mn + mp unknowns. Abs = C

25
With Residual Error! Absorbances (n x p) (n x m) Concentration (m x p) Residual (n x p) Given data matrix of absorbances, find the absorptivity and concentration matrices that result in the smallest possible values in the residual matrix. Abs = C + R
 (n x m) Concentration (m x p) Residual (n x p) Given data matrix of absorbances, find the absorptivity and concentration matrices that result in the smallest possible values in the residual matrix. Abs = C + R.")
26
Factor Analysis What is m? How many pure chemical species? How many mathematically distinct (orthogonal) components are needed to additively build the entire data matrix? The eigenvalues of a matrix depict the additive structure of the matrix. Requires computers. Matlab is very nice for this.
 components are needed to additively build the entire data matrix. The eigenvalues of a matrix depict the additive structure of the matrix. Requires computers. Matlab is very nice for this..")
27
Random Matrix Structure (16 x 461) matrix of random numbers All 16 eigenvalues contribute about the same to the structure of the matrix
 matrix of random numbers All 16 eigenvalues contribute about the same to the structure of the matrix")
28
Non-random Data 50 data curves of Ni 2+ solution with zero to 142 equivalents of pyridine. How many additive factors exist in this data?

29
Data Matrix Structure 6 th eigenvalue is relatively small, but still possibly significant. m = 6

30
Equilibrium-Restricted Factor Analysis Factoring a big matrix into 2 smaller ones does not necessarily give a positive or unique answer. We also the force the concentration values to adhere to equilibrium relationships.

31
Sivvu Inputs raw absorbance data

32
Absorbance Data n = 305 wavelengths p = 50 solution mixtures

33
Sivvu Inputs raw absorbance data composition of solutions for mass balance equations

34
Composition of Solutions From 0 to 142 equivalents of pyridine. Pure pyridine (12.4 Molar) is dripped into 0.10 M Ni(BF 4 ) 2 Solution
 is dripped into 0.10 M Ni(BF 4 ) 2 Solution.")
35
Sivvu Inputs raw absorbance data composition of solutions for mass balance equations chemical reactions for equilibrium equations

36
Inputs

37
Sivvu Inputs raw absorbance data composition of solutions for mass balance equations chemical reactions for equilibrium equations guesses for G’s

38
Inputs

39
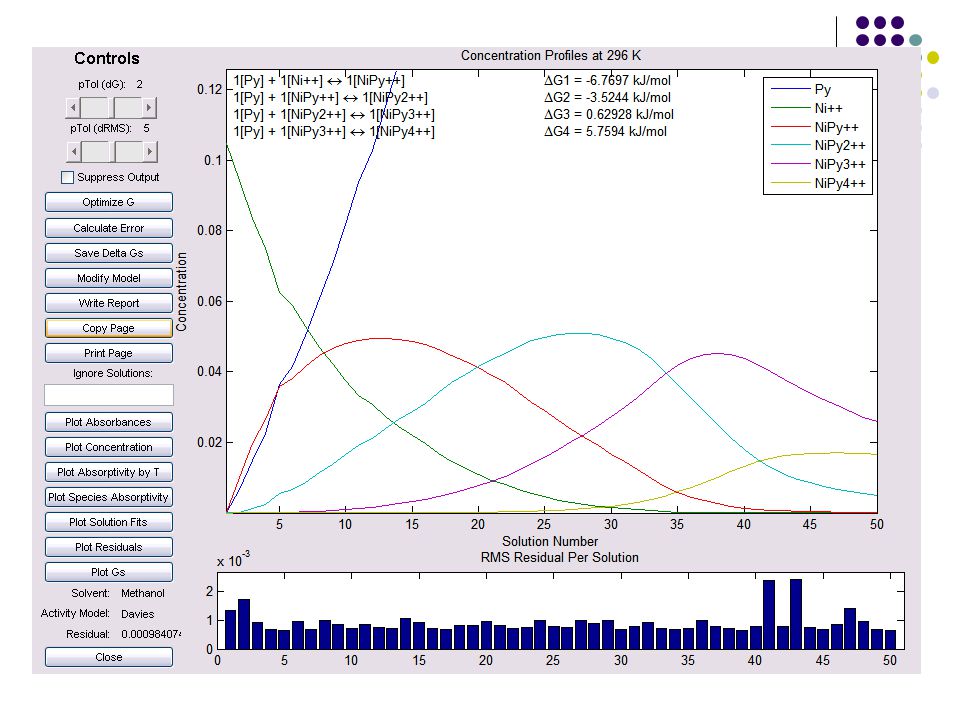
Sivvu Inputs raw absorbance data composition of solutions for mass balance equations chemical reactions for equilibrium equations guesses for G’s Process Calculates concentrations from G’s

41
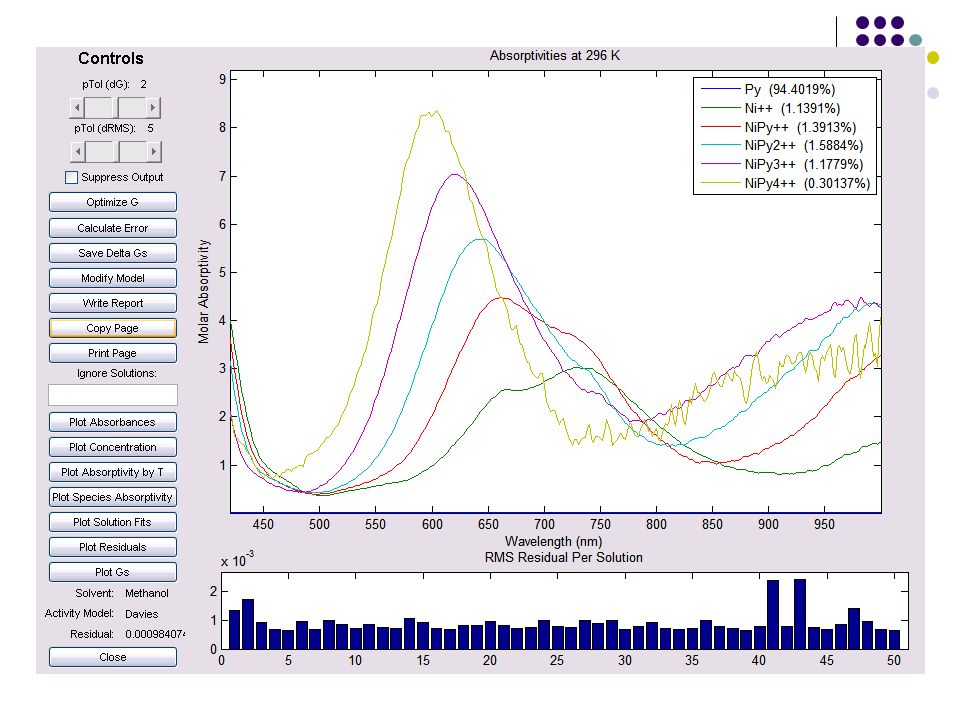
Sivvu Inputs raw absorbance data composition of solutions for mass balance equations chemical reactions for equilibrium equations guesses for G’s Process calculates concentrations from G’s solves for wavelength dependent colors

43
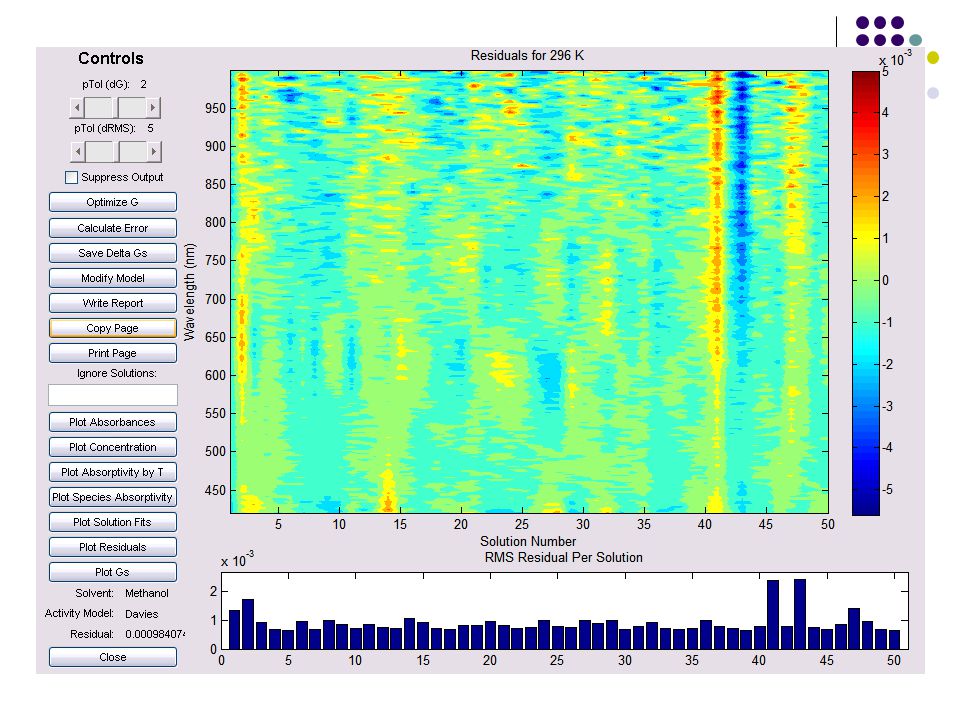
Sivvu Inputs raw absorbance data composition of solutions for mass balance equations chemical reactions for equilibrium equations guesses for G’s Process calculates concentrations from G’s solves for wavelength dependent colors calculates root mean square of residuals

45
Sivvu Inputs raw absorbance data composition of solutions for mass balance equations chemical reactions for equilibrium equations guesses for G’s Process calculates concentrations from G’s solves for wavelength dependent colors Calculates root mean square of residuals Searches for G’s that minimize rms residual

46
Structure of Residual

47
Now we know a lot! [Ni] 2+ + py [Nipy] 2+ G 1 = -6.76(2) kJ/mol [Nipy] 2+ + py [Nipy 2 ] 2+ G 2 = -3.52(2) kJ/mol [Nipy 2 ] 2+ + py [Nipy 3 ] 2+ G 3 = 0.64(3) kJ/mol [Nipy 3 ] 2+ + py [Nipy 4 ] 2+ G 4 = 5.8(5) kJ/mol [Nipy 4 ] 2+ + py [Nipy 5 ] 2+ G 5 = ? [Nipy 5 ] 2+ + py [Nipy 6 ] 2+ G 6 = ? Ni
 kJ/mol [Nipy] 2+ + py [Nipy 2 ] 2+ G 2 = -3.52(2) kJ/mol [Nipy 2 ] 2+ + py [Nipy 3 ] 2+ G 3 = 0.64(3) kJ/mol [Nipy 3 ] 2+ + py [Nipy 4 ] 2+ G 4 = 5.8(5) kJ/mol [Nipy 4 ] 2+ + py [Nipy 5 ] 2+ G 5 = . [Nipy 5 ] 2+ + py [Nipy 6 ] 2+ G 6 = . Ni.")
48
So what color is [Nipy] +2 ?
![So what color is [Nipy] +2](http://images.slideplayer.com/15/4577302/slides/slide_48.jpg "So what color is [Nipy] +2")
49
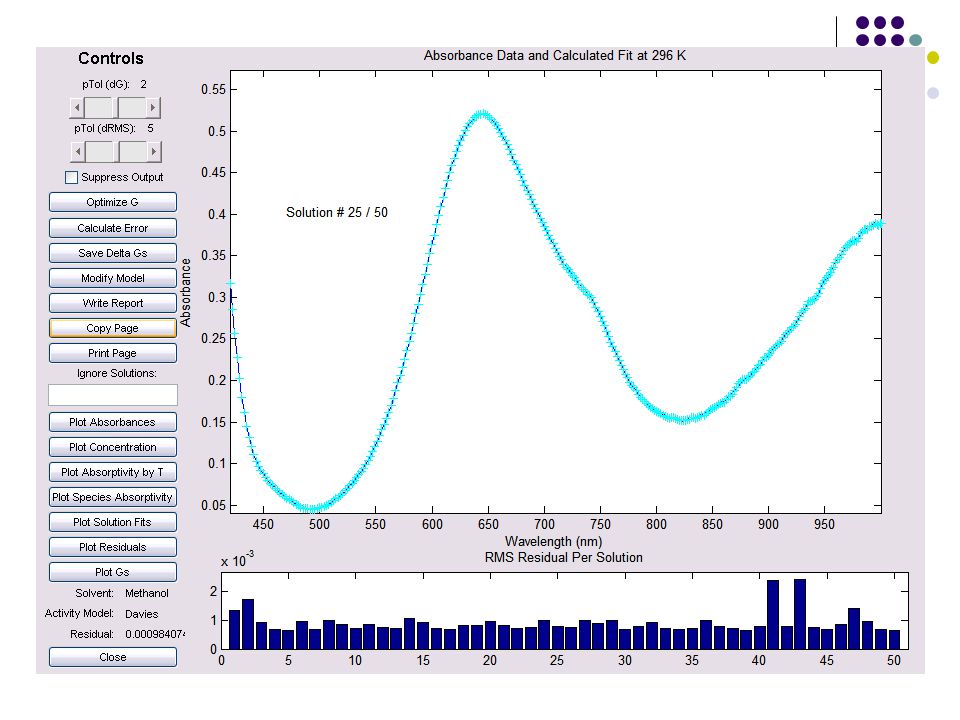
What’s going on in 25 th solution? 0.0997 M Ni(BF 4 ) 2 w/ 0.585 pyridine
 2 w/ pyridine")
52
Summary

53
Conclusions Factor Analysis extracts much useful information about complex systems from easy experiments. Forcing the concentrations to satisfy chemical equilibria greatly enhances stability and sensibleness. is Uv-vis in reverse.

54
Acknowledgements American Chemical Society Petroleum Research Fund Research Corporation Cottrell College Science Award Pleotint L.L.C. Calvin College Research Fellowship Jack and Lois Kuiper Mathematics Fellowship

Similar presentations


, but decrease as they are heated.>")
Write all the pertinent reactions 2)Write the charge balance 3)Write the mass balance 4)Write the equilibrium.>")


>")


 WE DON’T HAVE ENOUGH OF EACH OF THE BLOCKS TO BUILD FULL PRODUCTS SOME REACTANTS ARE LEFT.>")

