Download presentation
Presentation is loading. Please wait.

1
Renewable Energy Workshop 2012 “Wind and Solar Photovoltaic Technologies” A Presentation to the Bucknell University Renewable Energy Workshop – 12 May 2012 PS10 CSP Plant – Andalucia, Spain

3
The first known wind turbine for producing electricity was by Charles F. Brush turbine, in Cleveland, Ohio in 1888 http://www.windpower.org/en/pictures/brush.htm 12 kW Used electricity to charge batteries in the cellar of the owner’s mansion Note the person

4
First wind turbine outside of the US to generate electricity was built by Poul la Cour in 1891 in Denmark Used electricity from his wind turbines to electrolyze water to make hydrogen for the gas lights at the schoolhouse http://www.windpower.org/en/pictures/lacour.htm

5
© Copyright 1997-2003 Danish Wind Industry Association Updated 23 July 2003 Juul’s Gedser 200kW design 1957-1975 Class of 1904 Schmidt 1942 LaCour Test Turbines 1897 Schmidt 1942

6
In the US - first wind-electric systems built in the late 1890’s By 1930s and 1940s, hundreds of thousands were in use in rural areas not yet served by the grid Interest in wind power declined as the utility grid expanded and as reliable, inexpensive electricity could be purchased Oil crisis in 1970s created a renewed interest in wind until US government stopped giving tax credits Renewed interest again since the 1990s

7
Large (megawatt) machines Vestas 1.5MW 68m Nordex 2.5MW 100m Nordtank 1.5MW 64m © Copyright 1997-2003 Danish Wind Industry Association Updated 23 July 2003
 machines Vestas 1.5MW 68m Nordex 2.5MW 100m Nordtank 1.5MW 64m © Copyright Danish Wind Industry Association Updated 23 July 2003")
8
© Copyright 2010 – Vattenfall Thanet 300MW Vattenfall owns many of the world’s largest offshore wind farms 300 MW Thanet Farm (100 -3MW turbines) 160 MW Horns Rev Farm (80-2MW units) 110 MW Lillegrund Farm (48-2.3 MW units) 90 MW Kentish Flats Farm (30-3MW units) In total Vattenfall provides the EU with ~2TWh of wind energy annually from over 500 large scale wind turbines Current plans are for 6,000 MW in a partnership with Scottish Power Renewables
 160 MW Horns Rev Farm (80-2MW units) 110 MW Lillegrund Farm ( MW units) 90 MW Kentish Flats Farm (30-3MW units) In total Vattenfall provides the EU with ~2TWh of wind energy annually from over 500 large scale wind turbines Current plans are for 6,000 MW in a partnership with Scottish Power Renewables")
9
“Thanet” located off British coast in English Channel 100 Vestas V90 turbines, 300 MW capacity http://edition.cnn.com/2010/WORLD/europe/09/23/uk.largest.wind.farm/?hpt=Sbin http://www.vattenfall.co.uk/en/thanet-offshore-wind-farm.htm Turbines are located in water depth of 20-25m. Rows are 800m apart; 500m between turbines

10
Offshore wind turbines currently need to be in relatively shallow water, so maximum distance from shore depends on the seabed Capacity factors tend to increase as turbines move further off-shore Image Source: National Renewable Energy Laboratory

11
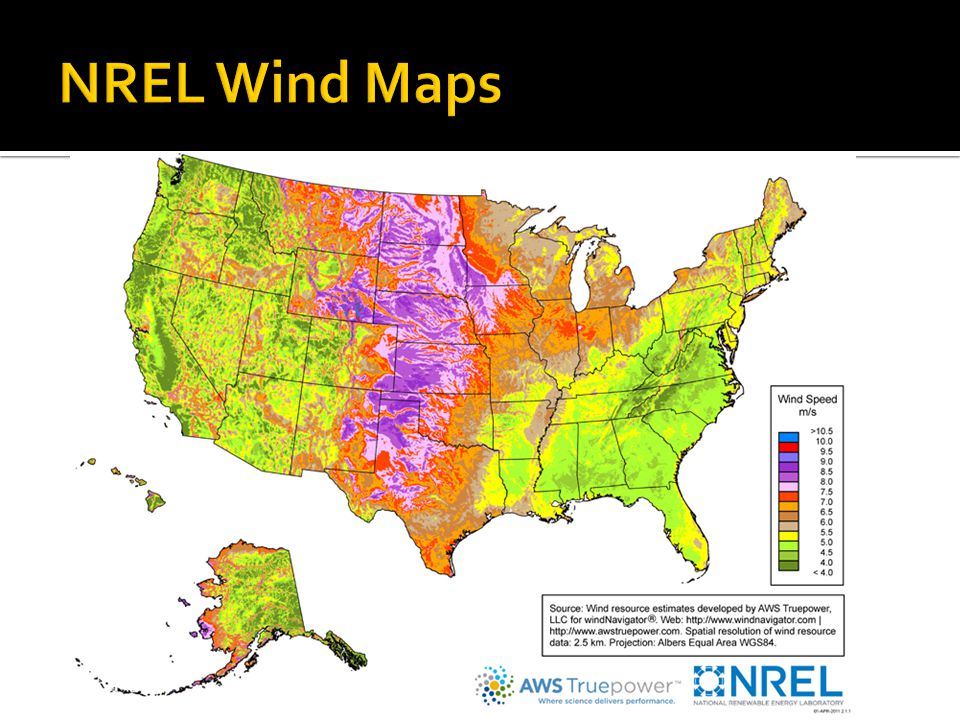
http://www.windpower.org/en/pictures/lacour.ht m http://www.windpoweringamerica.gov/pdfs/wind_maps/us_windmap.pdf

14
Source: www.ceoe.udel.edu/WindPower/ResourceMap/index-world.html

15
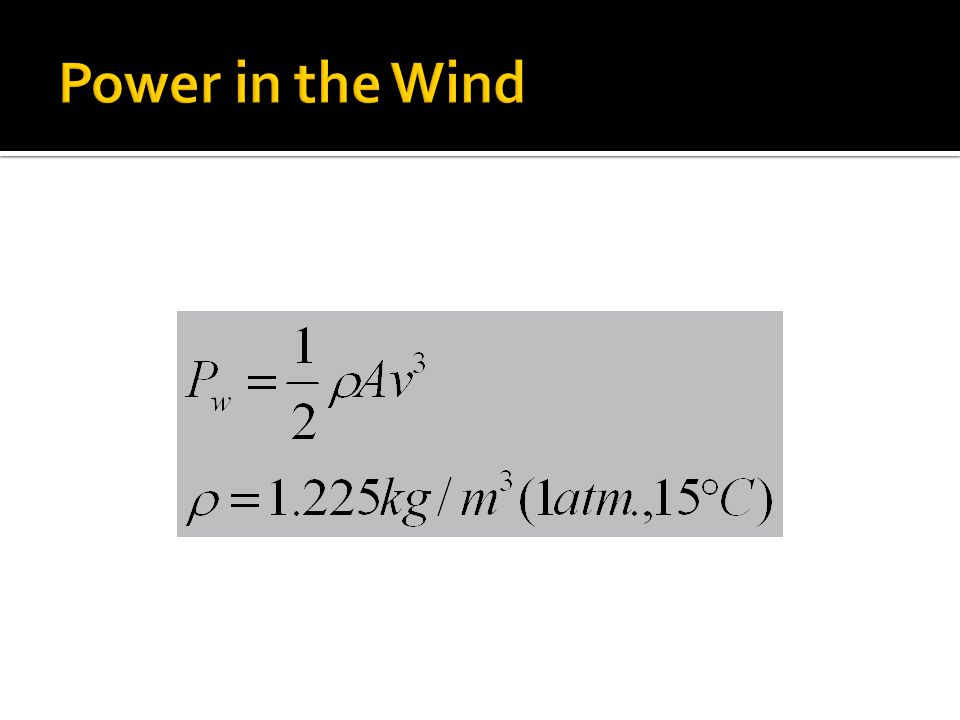
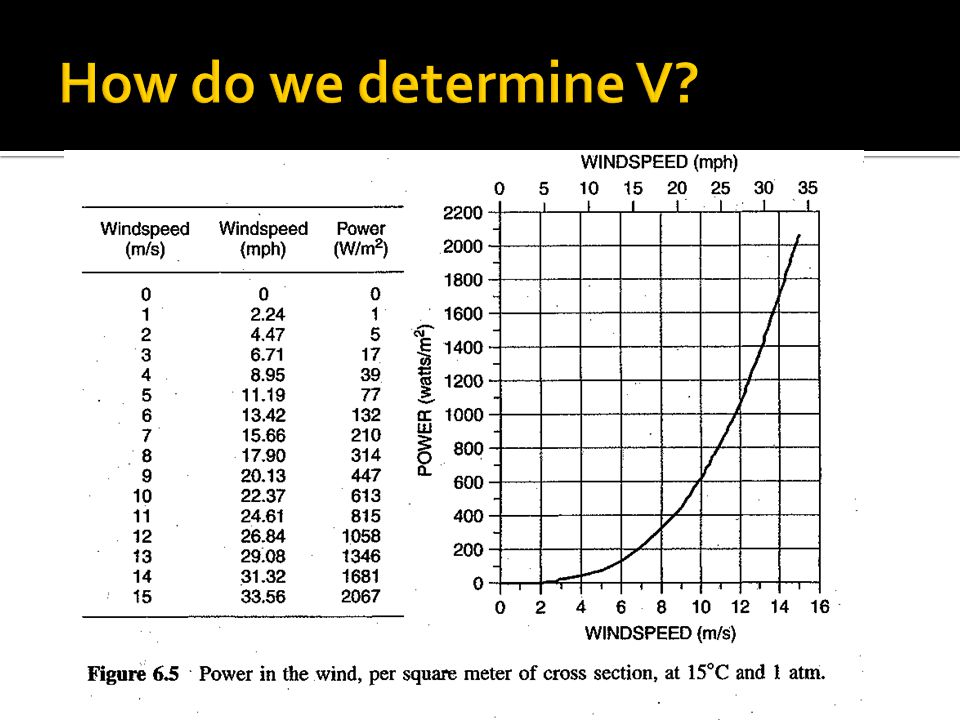
Why V 3 ?

18
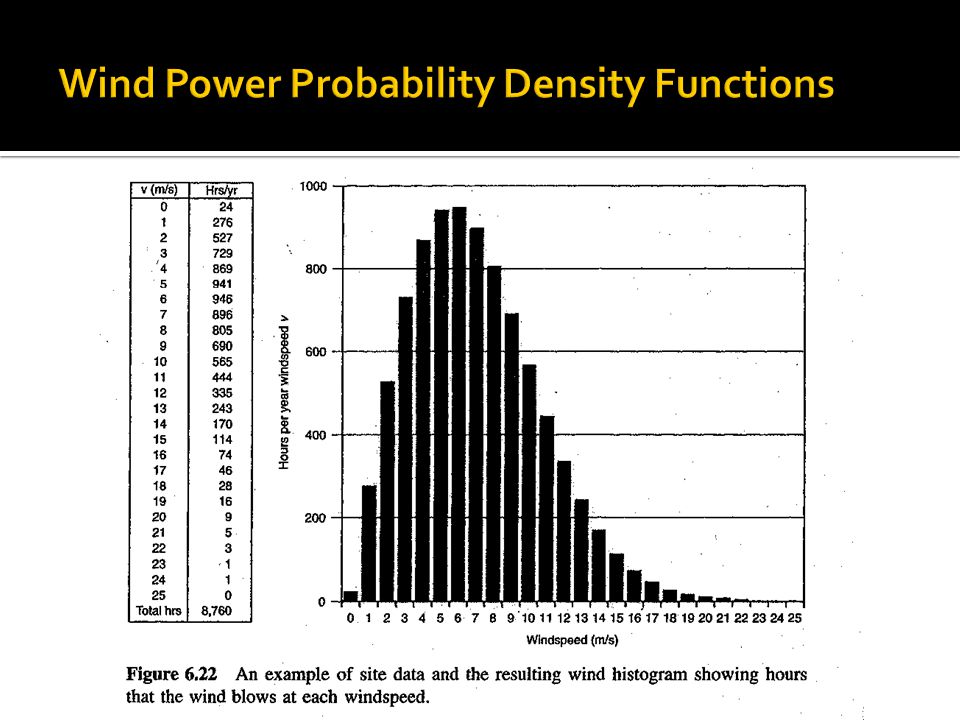
What does plot look like?

19
China62,733 United States46,919 Germany29,060 Spain21,674 India16,084 France6,800 Italy6,747 United Kingdom6,540 Canada5,265 Portugal4,083 Rest of world32,444

20
Top 5 States with Wind Power Capacity Installed, 2010: 1. Texas 2. Iowa 3. California 4. Minnesota 5. Washington 10,135 MW 3,675 MW 3,179 MW 2,432 MW 2,356 MW SOURCE: AWEA Last updated: 8.4.2011

21
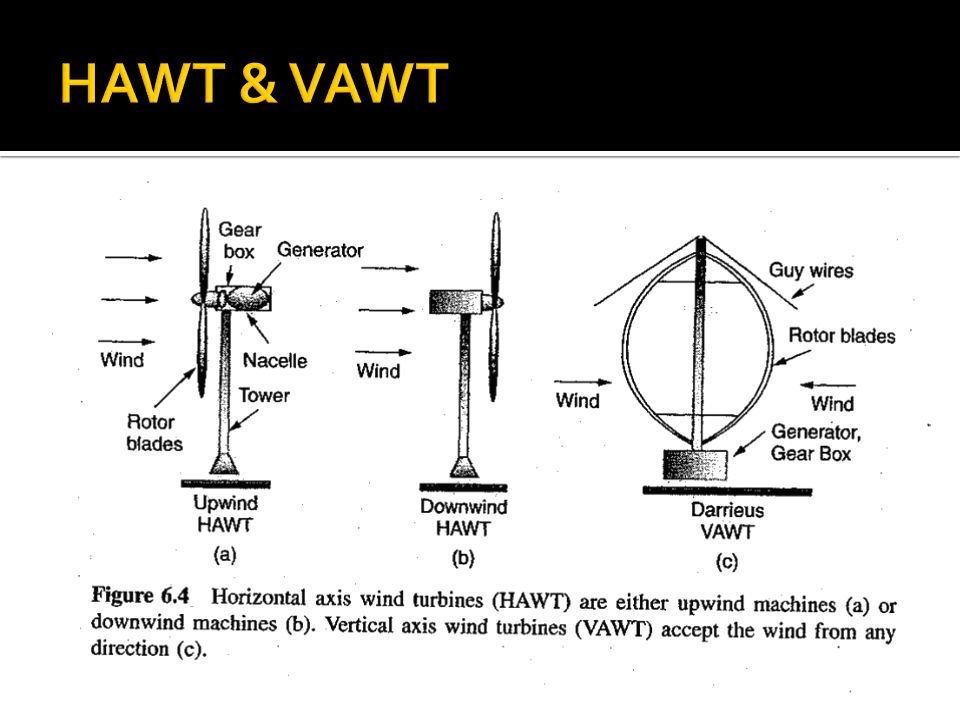
VAWT HAWT downwind HAWT upwind

23
SOURCE: http://www1.eere.energy.gov/wind/wind_how.html#inside

26
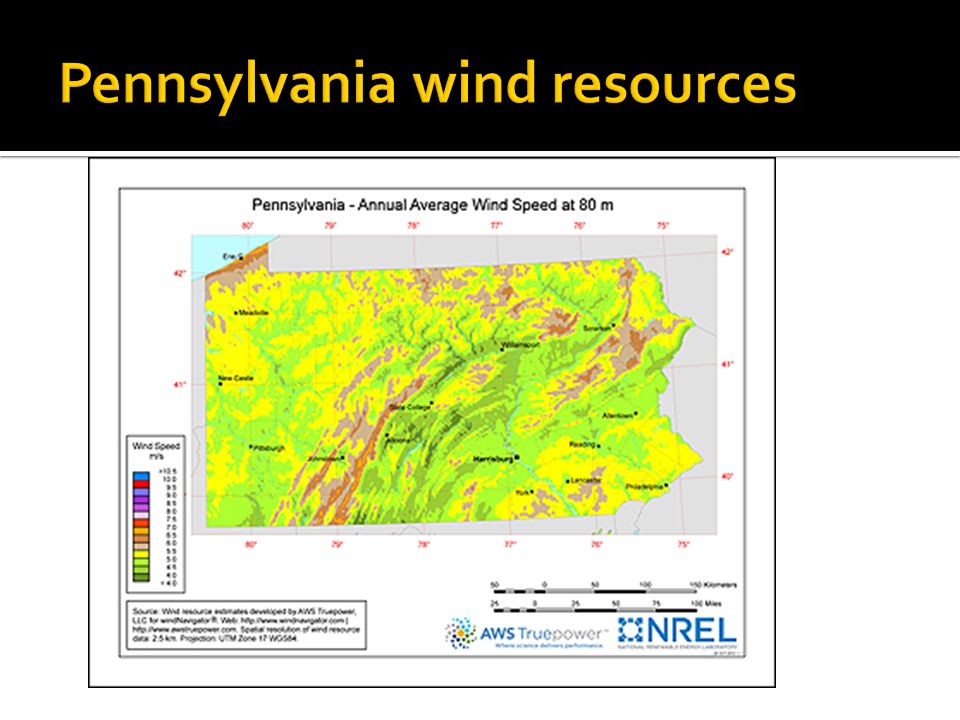
Wind Maps NREL Wind Models Based Upon Maps/Data New Jersey has Interactive Map Site Data Anemometer Loan Programs Adjacent NWS sites

28
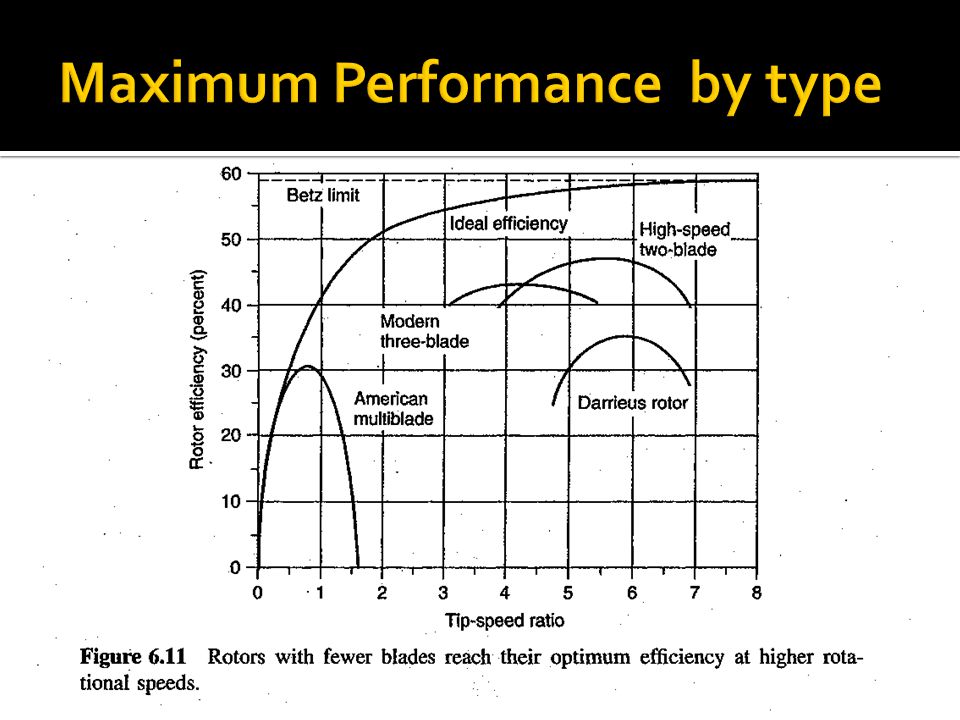
Tables 6.3 & 6.4, Page 320

29
Max theoretical is called Betz efficiency For typical turbines this is 59% Under ideal conditions today’s turbines can achieve 80% of the max theoretical: So many turbines range between 45-50%

30
Start by Analyzing your Wind Map Determine potential generation Determine local costs of electricity Base your estimates on a real wind generator power curve (Bergey, etc.) Complete Cost Benefit Analysis
 Complete Cost Benefit Analysis")
32
Solar Intensity: Atmospheric Effects Sun photosphere “AM” means “air mass” Intensity Extraterestrial sunlight (AM0) Sunlight at sea level at 40° N Lattitude at noon (AM1.5)
 Sunlight at sea level at 40° N Lattitude at noon (AM1.5)")
33
Figure 7.5 For solar energy applications, we’ll consider the characteristics of the earth’s orbit to be unchanging

34
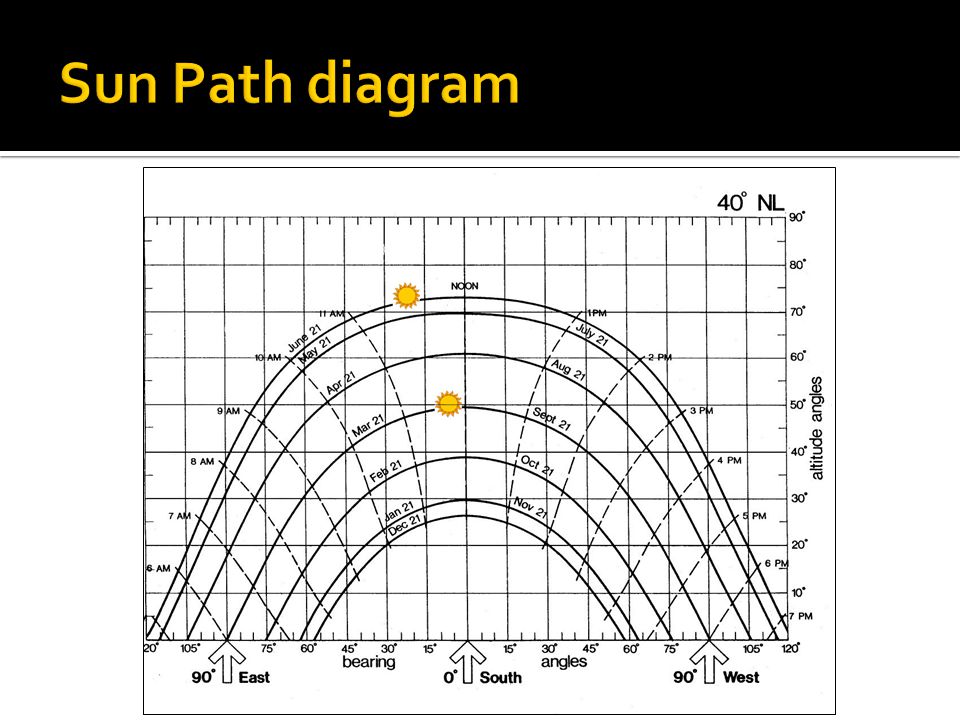
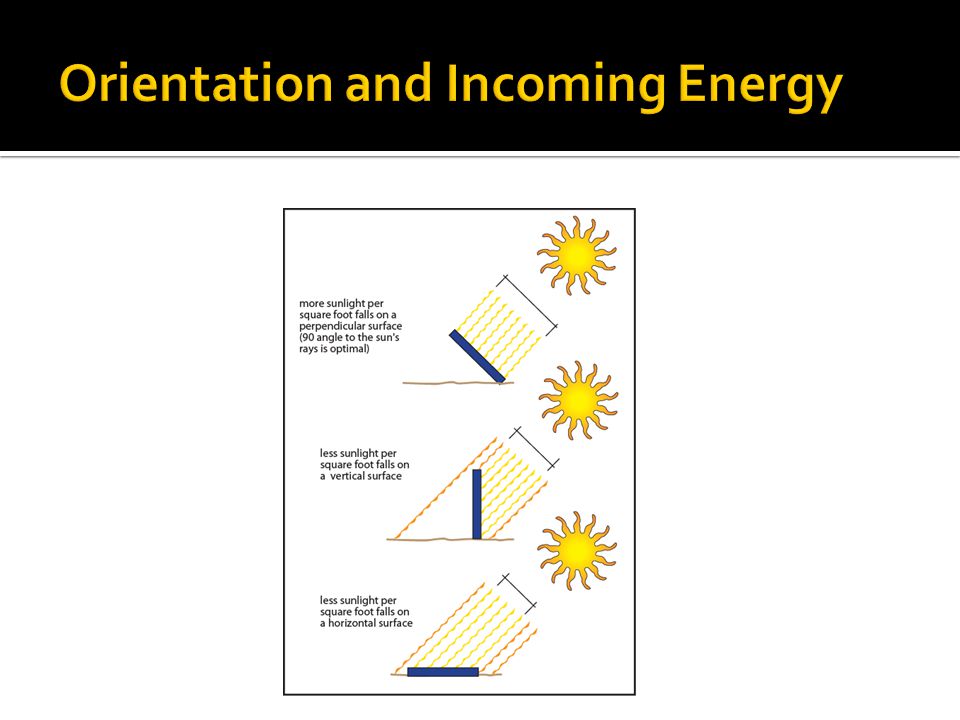
Solar noon – sun is directly over the local line of longitude Rule of thumb for the Northern Hemisphere - a south facing collector tilted at an angle equal to the local latitude During solar noon, the sun’s rays are perpendicular to the collector face Figure 7.8

35
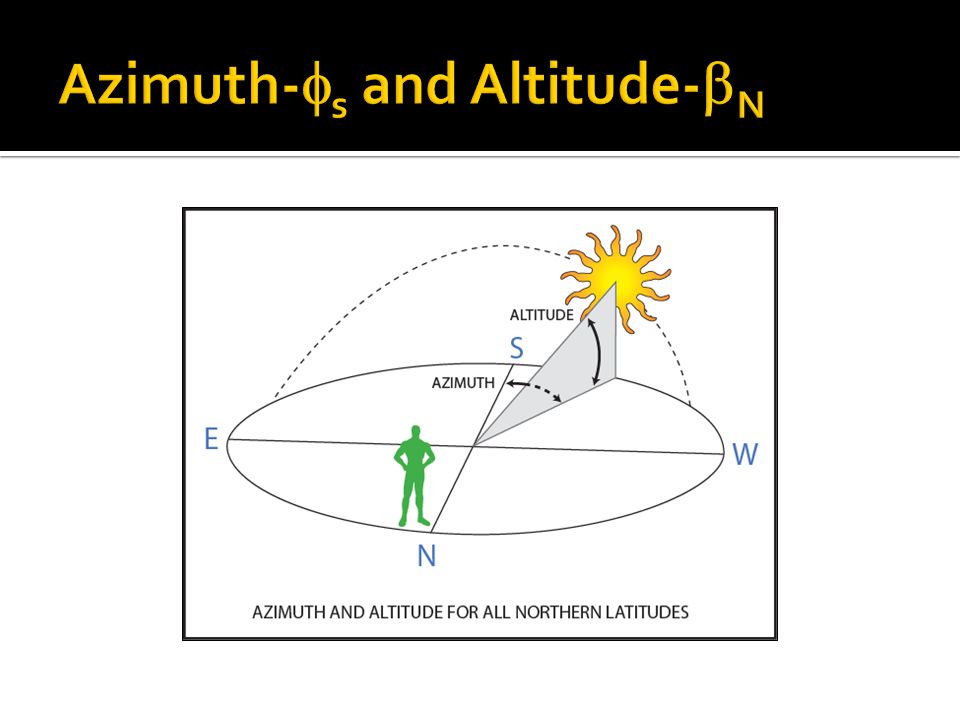
Figure 7.10 Azimuth Angle Altitude Angle

38
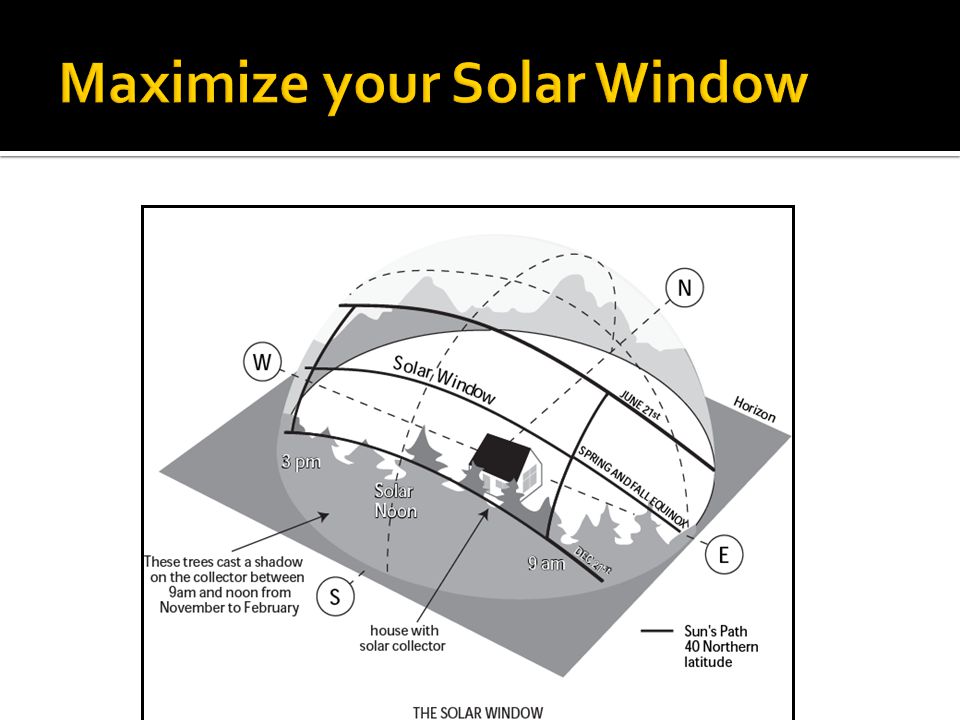
Trees to the southeast, small building to the southwest Can estimate the amount of energy lost to shading Figure 7.15

39
http://mapserve3.nrel.gov/PVWatts_Viewer/index.html http://mapserve3.nrel.gov/PVWatts_Viewer/index.html

42
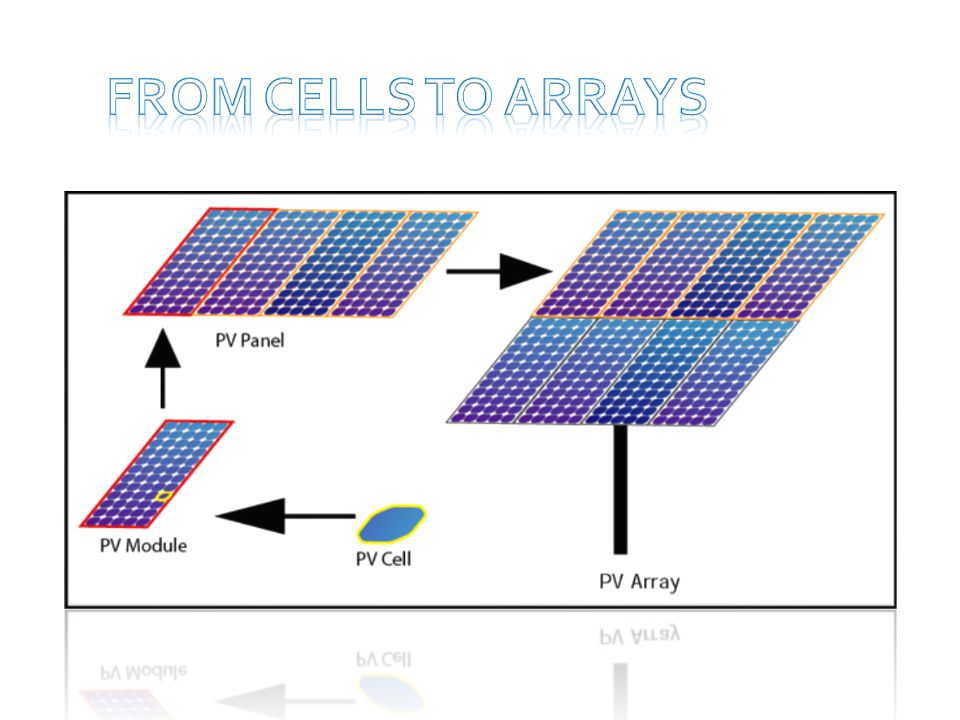
© Copyright Ned Mohan 2006

45
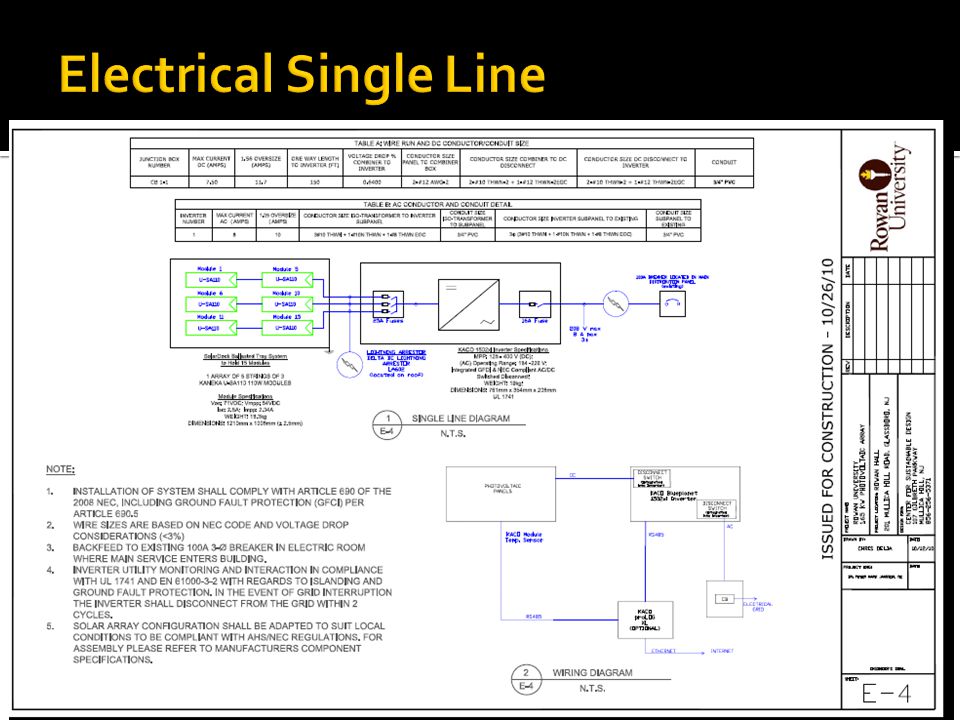
SOURCE: California Energy Commission - Guide to PV System Design and Installation – June 2001 [Available Online] : http://www.energy.ca.gov/reports/2001-09-04_500-01-020.PDF
![SOURCE: California Energy Commission - Guide to PV System Design and Installation – June 2001 [Available Online] :](http://images.slideplayer.com/15/4574786/slides/slide_45.jpg "SOURCE: California Energy Commission - Guide to PV System Design and Installation – June 2001 [Available Online] :")
47
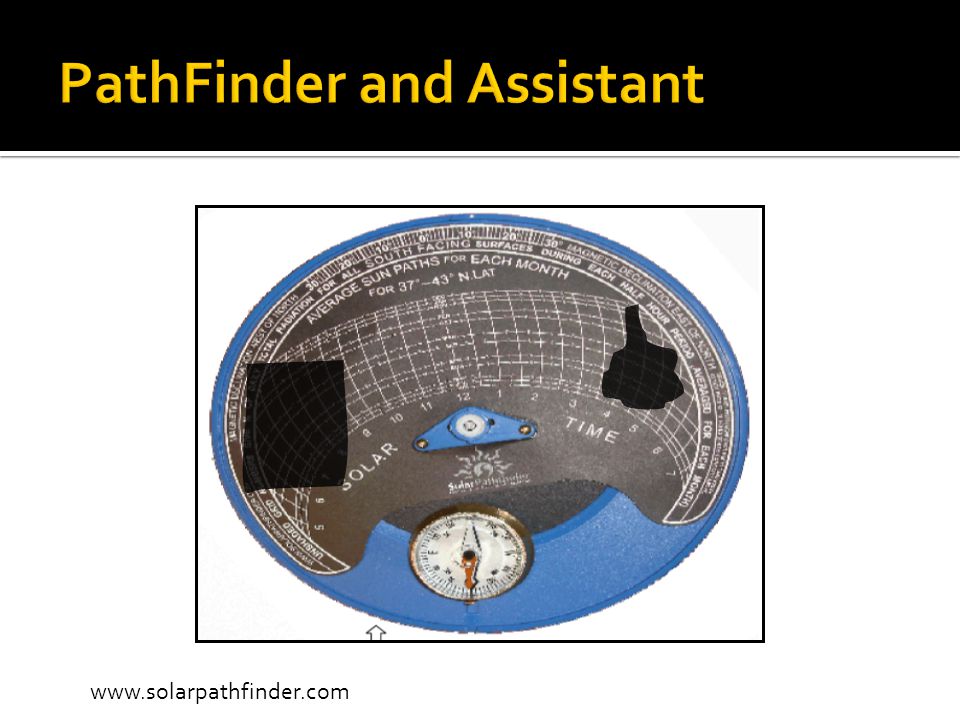
www.solarpathfinder.com
48
PathFinder, Tripod and Software http://www.solarpathfinder.com/ord/configure?id=rWISgKdJ&mv_arg=PF

49
http://www.civicsolar.com/product/solmetric- sun-eye-210 http://www.civicsolar.com/product/solmetric- sun-eye-210

52
Fixed Panel facing south at 40 o N latitude 40 o tilt angle: 2410 kWh/m 2 20 o tilt angle: 2352 kWh/m 2 (2.4% loss) 60 o tilt angle: 2208 kWh/m 2 (8.4% loss) Fixed panel facing SE or SW (azimuth) 40 o tilt angle: 2216 kWh/m 2 (8.0% loss) 20 o tilt angle: 2231 kWh/m 2 (7.4% loss) 60 o tilt angle: 1997 kWh/m 2 (17.1% loss)
 60 o tilt angle: 2208 kWh/m 2 (8.4% loss) Fixed panel facing SE or SW (azimuth) 40 o tilt angle: 2216 kWh/m 2 (8.0% loss) 20 o tilt angle: 2231 kWh/m 2 (7.4% loss) 60 o tilt angle: 1997 kWh/m 2 (17.1% loss)")
53
Williamsport, PA 1-kW 30 o tilt example 1,115 kWh/year Single axis – 1,361 kWh/year 22% improvement at 41 o N latitude Two axis tracking – 1,415 kWh/m 2 27% improvement at 41 o N latitude

Similar presentations
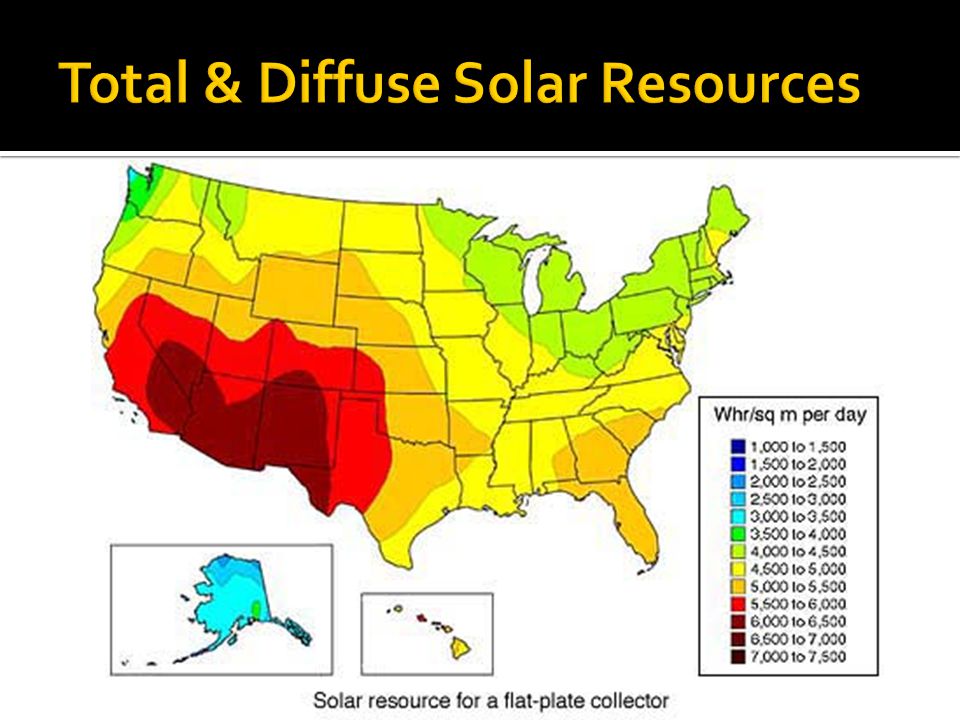


. Map shows annual average solar resource for a solar PV system.>")


 - Rated Power 160 MW – Water Depth 10-15m.>")


 According to the US Department of Energy, Wind & Hydropower Technologies Program, wind turbines.>")
