Download presentation
Presentation is loading. Please wait.

1
UW-Whitewater Campus Climate Assessment Results of Report May 4, 2010

2
Campuses as Social Systems Hurtado, Milem, Clayton-Pederson, & Allen, 1998

3
Climate In Higher Education Barcelo, 2004; Bauer, 1998, Kuh & Whitt, 1998; Hurtado, 1998, 2005; Ingle, 2005; Milhem, 2005; Peterson, 1990; Rankin, 1994, 1998, 2003, 2005; Smith, 1999; Tierney, 1990; Worthington, 2008

4
Assessing Campus Climate Rankin & Reason, 2008

5
Campus Climate & Students 1 Pascarella & Terenzini, 1991, 2005 2 Cabrera, Nora, Terenzini, Pascarella, & Hagedron, 1999; Feagin, Vera & Imani, 1996; Pascarella & Terenzini, 1991. 3 Hale, 2004; Harper & Quaye, 2004; Harper, & Hurtado, 2007; Hurtado, 2003.

6
Why conduct a climate assessment? To foster a caring university community that provides leadership for constructive participation in a diverse, multicultural world. To open the doors wider for underrepresented groups is to create a welcoming environment. To improve the environment for working and learning on campus.

7
Project Objectives Provide UW-Whitewater with information, analysis, and recommendations as they relate to campus climate. This information will be used in conjunction with other data to provide UW-Whitewater with an inclusive view of campus and a system-wide review.

8
Projected Outcomes UW-Whitewater will add to their knowledge base with regard to how constituent groups currently feel about their particular campus climate and how the community responds to them (e.g., pedagogy, curricular issues, professional development, inter- group/intra-group relations, respect issues). UW-Whitewater will use the results of the assessment to inform current/on-going work regarding diversity (e.g., Inclusive Excellence, Equity Scorecard).
..")
9
Inclusive Excellence Inclusive Excellence broadens and expands our notion of "diversity" and what it means to truly be an inclusive campus community. Honoring the multi-faceted, intersectional differences among us, enables us to address the needs of individuals and groups thereby creating an "equitable" and welcoming campus environment. Inclusive Excellence is not limited to compositional diversity, but extends to include curricular transformation, improved policies for all campus members, better retention of students and faculty, and a welcoming campus climate for all.

10
The Climate Project & Inclusive Excellence The Climate Study is foundational to Inclusive Excellence in that it is the first time in the UW System that we are collecting data on multiple and intersectional identities based on experiences and perceptions of campus life by all members of the community. It is a population study that encouraged every campus community member to provide input on the campus climate. The input, data, and final results will be used in tandem with other data as a starting point to build an action plan that speaks to Inclusive Excellence.

11
Setting the Context Examine the Research Review work already completed Preparation Readiness of the campus Assessment Examine the climate Follow-up Building on the successes and addressing the challenges

12
Current Campus Climate Access Retention Research Scholarship Curriculum Pedagogy University Policies/Service Intergroup & Intragroup Relations Transformational Tapestry Model © Baseline Organizational Challenges Systems Analysis Local / Sate / Regional Environments Contextualized Campus Wide Assessment Advanced Organizational Challenges Consultant Recommendations Assessment Transformation via Intervention Fiscal Actions Symbolic Actions Administrative Actions Educational Actions Transformed Campus Climate Access Retention Research Scholarship Curriculum Pedagogy University Policies/Service Intergroup & Intragroup Relations © 2001 External Relations External Relations

13
University of Wisconsin System Mission The mission of the system is to develop human resources, to discover and disseminate knowledge, to extend knowledge and its application beyond the boundaries of its campuses and to serve and stimulate society by developing in students heightened intellectual, cultural and humane sensitivities, scientific, professional and technological expertise and a sense of purpose. Inherent in this broad mission are methods of instruction, research, extended training and public service designed to educate people and improve the human condition. Basic to every purpose of the system is the search for truth.

14
Core Mission of the University Cluster …“Serve the needs of women, minority, disadvantaged, disabled, and nontraditional students and seek racial and ethnic diversification of the student body and the professional faculty and staff.”

15
Process to Date 2004-2005 Academic Planner (C. Saulnier) made aware of bias incidents at several campuses & began conversation regarding system-wide campus climate project Taskforce committee formed to investigate consulting firms who conduct climate assessments in higher education. Rankin & Associates identified as leading expert in multiple identity studies in higher education
 made aware of bias incidents at several campuses & began conversation regarding system-wide campus climate project Taskforce committee formed to investigate consulting firms who conduct climate assessments in higher education. Rankin & Associates identified as leading expert in multiple identity studies in higher education.")
16
Process to Date 2005-2006 Conversations at system level continued Proposal presentation made to UW System Provosts and various constituent groups in Madison in September 2006

17
Process to Date 2006-2007 UWS Administrators form Climate Study Working Group (CSWG) Conducted in-depth interviews with other higher education institutions who had contracted with R&A resulting in very positive reviews In collaboration with R&A identified potential fact- finding groups and developed protocol Identified “next steps” in process
 Conducted in-depth interviews with other higher education institutions who had contracted with R&A resulting in very positive reviews In collaboration with R&A identified potential fact- finding groups and developed protocol Identified next steps in process")
18
Process to Date 2006-2007 President Reilly pledges support for the project and agrees to finance 75% of the costs Five campuses volunteer to participate in climate assessment in the first year Participating institutions Provosts’ Teleconference with R&A to discuss process, Scope of the Work, Projected Time-line, Proposed Budget At the request of R&A, the Provosts were invited to add additional members to the CSWG to ensure institutional representation

19
Process to Date 2006-2007 Project Co-Chairs and Project Coordinator named Vicki Washington (Chair, CSWG) Interim Assistant Vice President of the Office of Academic Development and Diversity, UW System Administration Lisa Beckstrand (Project Coordinator) Academic Planner, Director of Inclusivity Initiative, Office of Academic & Student Services, UW System Administration
 Interim Assistant Vice President of the Office of Academic Development and Diversity, UW System Administration Lisa Beckstrand (Project Coordinator) Academic Planner, Director of Inclusivity Initiative, Office of Academic & Student Services, UW System Administration")
20
Process to Date Participating Institutions

21
Overview of the Project

22
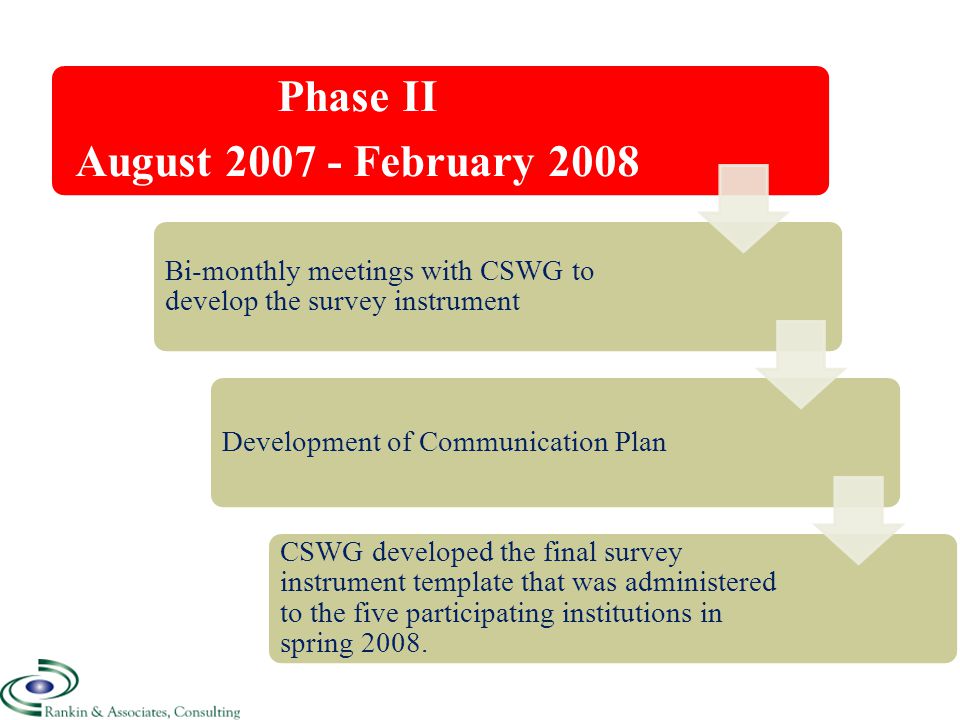
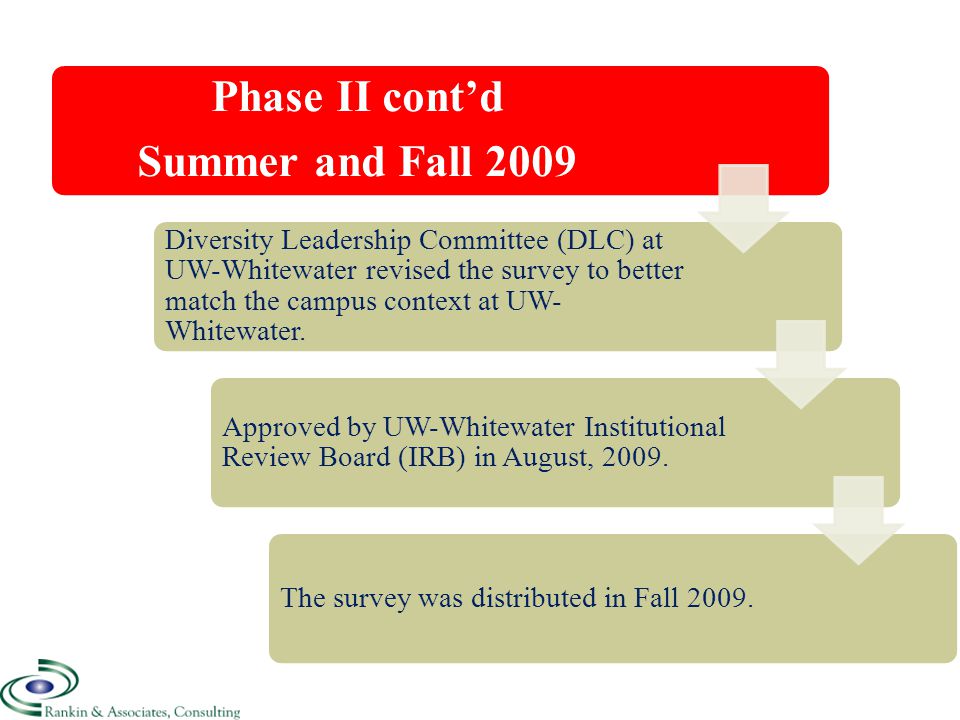
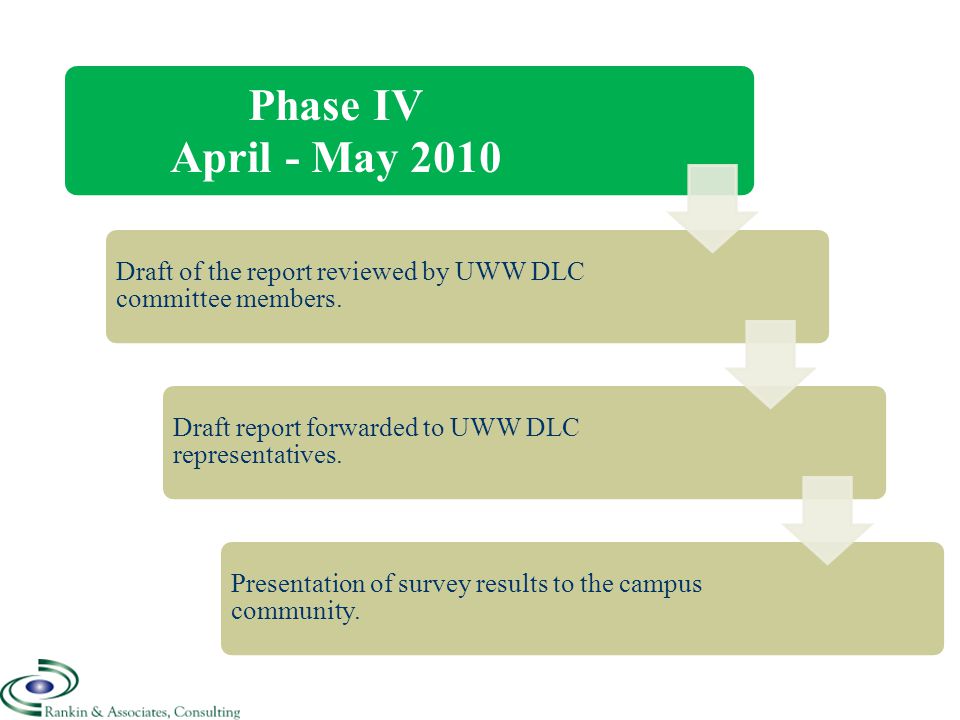
Process to Date

25
Survey Instrument Final instrument 89 questions and additional space for respondents to provide commentary On-line or paper & pencil options Sample = Population All members of the UW-Whitewater community were invited to participate Results include information regarding: Respondents’ personal experiences at UW-Whitewater Respondents’ perceptions of climate at UW-Whitewater Respondents’ perceptions of institutional actions Respondents’ input into recommendations for change

26
Survey Assessment Limitations Self-selection bias Response rates Caution in generalizing results for constituent groups with significantly lower response rates

27
Method Limitation Data were not reported for groups of fewer than 10 individuals where identity could be compromised. Instead, small groups were combined to eliminate possibility of identifying individuals.

28
Process to Date

30
Results Response Rates

31
Who are the respondents? 3,239 people responded to the call to participate (26% response rate overall). Several respondents contributed remarks to the open-ended questions.
. Several respondents contributed remarks to the open-ended questions..")
32
Who are the respondents?

33
Faculty Response Rates Instructional Academic Staff (42%, n = 90) Assistant Professor (60%, n = 79) Adjunct Faculty (16%, n = 7) Associate Professor (62%, n = 71) Professor (63%, n = 57)
 Assistant Professor (60%, n = 79) Adjunct Faculty (16%, n = 7) Associate Professor (62%, n = 71) Professor (63%, n = 57)")
34
Faculty Response Rates by Selected Demographics

35
Staff Response Rates Administrators (n = 29) Limited Term Employee (25%, n = 15) Classified Staff Non-Exempt (45%, n = 133) Classified Staff Exempt (99%, n = 71) Non-Instructional Academic Staff (61%, n = 130) Limited Academic Staff (14%, n = 5)
 Limited Term Employee (25%, n = 15) Classified Staff Non-Exempt (45%, n = 133) Classified Staff Exempt (99%, n = 71) Non-Instructional Academic Staff (61%, n = 130) Limited Academic Staff (14%, n = 5)")
36
Staff Response Rates by Selected Demographics

37
Student Response Rates Associate Degree (n = 142 ) Non-Degree Seeking (n = 37) Transfer (n = 143 ) Dual Enrollment (n = 5) Bachelor Degree Student (20%, n = 1,869 ) Professional Degree (n = 23) Master Degree Student (16%, n = 226)
 Non-Degree Seeking (n = 37) Transfer (n = 143 ) Dual Enrollment (n = 5) Bachelor Degree Student (20%, n = 1,869 ) Professional Degree (n = 23) Master Degree Student (16%, n = 226)")
38
Student Response Rates by Selected Demographics

39
Results Demographic Characteristics

40
Student Respondents by Class Standing (n)
")
41
Student Residence

42
Income by Student Status (n)
")
43
Employee Respondents by Position Status (n)
")
44
Collapsed Employee Status (n)
")
45
Respondents by Gender and Position Status (n) There were 5 respondents who identified as transgender
 There were 5 respondents who identified as transgender")
46
Respondents by Sexual Orientation and Position Status (n)
")
47
Respondents by Faculty/Staff Appointments by Gender WomenMen Appointmentn%n% Adjunct professor457.1342.9 Instructional Academic Staff5561.83438.2 Assistant professor3650.73447.9 Associate professor4050.63949.4 Professor2239.33460.7 Limited Term employee1178.6321.4 Classified staff non-exempt10679.72720.3 Classified staff exempt staff3042.34157.7 Non-instructional academic staff8061.54937.7 Limited academic staff360.0240.0 Administrator1137.91862.1

48
Respondents by Racial Identity (Duplicated Total)
")
49
Respondents by Racial Identity (Unduplicated Total)
")
50
Respondents by Spiritual Affiliation (n)
")
51
Respondents with Conditions that Substantially Affect Major Life Activities (n)
")
52
Citizenship Status by Position StudentsEmployees n%n% US citizen 237797.143690.6 US citizen – naturalized 291.2183.7 Dual citizenship 80.3** Permanent resident (immigrant) 90.4132.7 Permanent resident (refugee) *0.0*0.2 International (F-1, J-1, or H1-B, or other visa) 251.091.9 * Data is missing due to n < 5
 Permanent resident (refugee) *0.0*0.2 International (F-1, J-1, or H1-B, or other visa) * Data is missing due to n < 5")
53
Findings

54
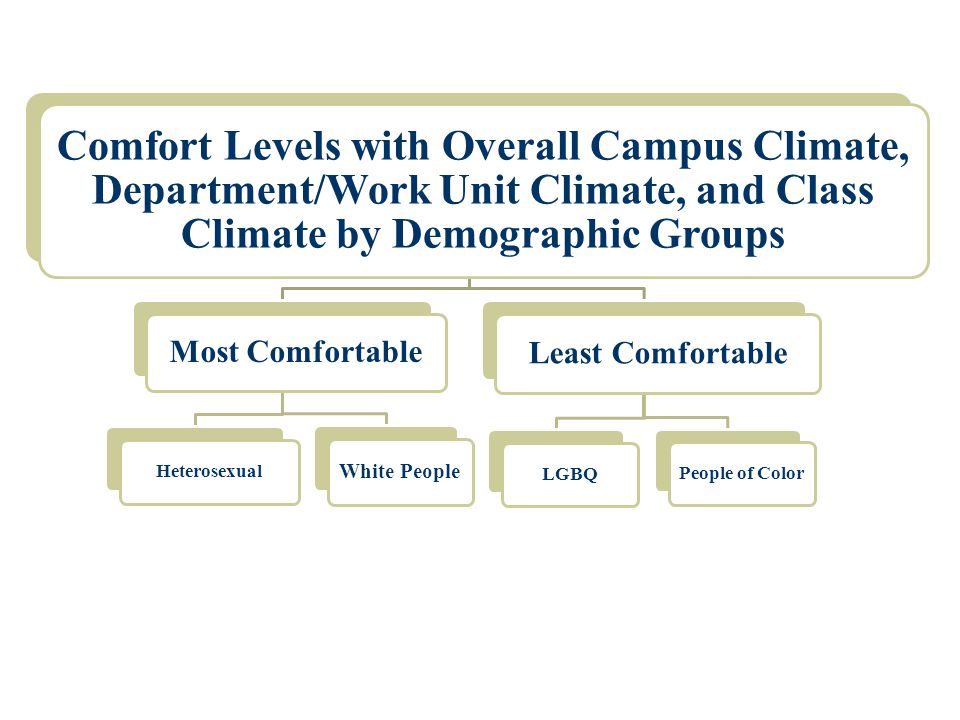
Overall Comfort Levels

56
Overall Satisfaction

57
Levels of Satisfaction by Demographic Groups

58
Employee Satisfaction with Their Jobs by Selected Demographic Categories (%) * Highly Satisfied and Satisfied collapsed into one category. ** Highly Dissatisfied and Dissatisfied collapsed into one category.

59
Employee Satisfaction with Their Jobs by Faculty and Staff Status (%) * Highly Satisfied and Satisfied collapsed into one category. ** Highly Dissatisfied and Dissatisfied collapsed into one category.

60
Employee Satisfaction with the Way Their Careers Have Progressed by Selected Demographic Categories (%) * Highly Satisfied and Satisfied collapsed into one category. ** Highly Dissatisfied and Dissatisfied collapsed into one category.

61
Employee Satisfaction with the Way Their Careers Have Progressed By Position Status (%) * Highly Satisfied and Satisfied collapsed into one category. ** Highly Dissatisfied and Dissatisfied collapsed into one category.

62
Employee Comments with Regard to Job and Career Progression Satisfaction Employees who were satisfied with their careers enjoyed working with students, their colleagues, and within their departments. They felt challenged and appreciated. Those respondents who were dissatisfied were disappointed in their low salaries; lack of opportunities for professional advancement; and “dysfunctional” departments, coworkers, or supervisors. A number of the dissatisfied individuals indicated they felt overworked, unchallenged, and underappreciated.

63
Student Satisfaction with Education at UW-Whitewater (%) * Highly Satisfied and Satisfied collapsed into one category. ** Highly Dissatisfied and Dissatisfied collapsed into one category.

64
Student Satisfaction with Academic Career at UW-Whitewater (%) * Highly Satisfied and Satisfied collapsed into one category. ** Highly Dissatisfied and Dissatisfied collapsed into one category.

65
Student Comments with Regard to Satisfaction with Academic Experiences Students who were satisfied with the way their experiences at UW-Whitewater said they enjoyed their courses; faculty were caring, helpful, and intelligent; they were “on track” to graduate in four years; felt UW-Whitewater had adequate resources available to students; and enjoyed relationships with their student peers. Dissatisfied students said they were disappointed in their courses; faculty were uncaring and/or uninterested; general education courses wasted their time; and academic advisors failed to provide sufficient advice.

66
Challenges and Opportunities

67
Experiences with Harassment

68
Personally Experienced Based on…(%)
")
69
Overall Personal Experiences of Perceived Offensive, Hostile, or Intimidating Conduct Due to Gender (by Gender) (%) ¹ Percentages are based on total n split by group. ² Percentages are based on n split by group for those who believed they had personally experienced this conduct. (n=283)¹ (n=105)² (n=155)¹ (n=22)²
¹ (n=105)² (n=155)¹ (n=22)².")
70
Overall Personal Experiences of Perceived Offensive, Hostile, or Intimidating Conduct Due to Position Status by Position Status (%) ¹ Percentages are based on total n split by group. ² Percentages are based on n split by group for those who believed they had personally experienced this conduct. (n=258)¹ (n=42)² (n=77)¹ (n=32)² (n=57)¹ (n=18)² (n=38)¹ (n=14)²
¹ (n=42)² (n=77)¹ (n=32)² (n=57)¹ (n=18)² (n=38)¹ (n=14)².")
71
Overall Personal Experiences of Perceived Offensive, Hostile, or Intimidating Conduct Due to Race by Race (%) ¹ Percentages are based on total n split by group. ² Percentages are based on n split by group for those who believed they had personally experienced this conduct. (n=75)¹ (n=36)² (n=359)¹ (n=12)²
¹ (n=36)² (n=359)¹ (n=12)².")
72
Overall Personal Experiences of Perceived Offensive, Hostile, or Intimidating Conduct Due to Sexual Orientation by Sexual Orientation (%) ¹ Percentages are based on total n split by group. ² Percentages are based on n split by group for those who believed they had personally experienced this conduct. (n=45)¹ (n=24)² (n=387)¹ (n=7)²
¹ (n=24)² (n=387)¹ (n=7)².")
73
Overall Personal Experiences of Perceived Offensive, Hostile, or Intimidating Conduct Due to Disability Status by Disability Status (%) ¹ Percentages are based on total n split by group. ² Percentages are based on n split by group for those who believed they had personally experienced this conduct.. (n=382)¹ (n=15)² (n=19)¹ (n=7)² (n=22)¹ (n=9)² (n=21)¹ (n=11)²
¹ (n=15)² (n=19)¹ (n=7)² (n=22)¹ (n=9)² (n=21)¹ (n=11)².")
74
Form of Perceived Offensive, Hostile, or Intimidating Conduct n% Deliberately ignored or excluded 21849.0 Felt intimidated/bullied 14332.1 Stares 9320.9 Derogatory remarks 8920.0 Isolated or left out when working in groups 7516.9 Isolated or left out because of my identity 5412.1 Received a low performance evaluation 4911.0 Derogatory written comments 419.2 Feared getting a poor grade because of hostile classroom environment 409.0 Note: Only answered by respondents who experienced harassment (n = 445). Percentages do not sum to 100 due to multiple responses.

75
Form of Perceived Offensive, Hostile, or Intimidating Conduct n% Feared for my physical safety 357.9 Target of racial/ethnic profiling 347.6 Singled out as the “resident authority” regarding my identity 286.3 Derogatory/unsolicited e-mails 235.2 Threats of physical violence 224.9 Someone assumed I was admitted or hired because of my identity 224.9 Derogatory phone calls 184.0 Graffiti 122.7 Victim of a crime 122.7 Note: Only answered by respondents who experienced harassment (n = 445). Percentages do not sum to 100 due to multiple responses.

76
Respondents Who Believed They Were Deliberately Ignored or Excluded Where Did The Perceived Conduct Occur? 34 percent (n = 75) - in a class 33 percent (n = 71) - in a meeting with a group of people Note: Only answered by respondents who experienced harassment (n = 445). Percentages do not sum to 100 due to multiple responses.
 - in a class 33 percent (n = 71) - in a meeting with a group of people Note: Only answered by respondents who experienced harassment (n = 445). Percentages do not sum to 100 due to multiple responses..")
77
Respondents Who Believed They Were Intimidated or Bullied Where Did The Perceived Conduct Occur? 34 percent (n = 48) - at a campus job 25 percent (n = 36) - in a class Note: Only answered by respondents who experienced harassment (n = 445). Percentages do not sum to 100 due to multiple responses.
 - at a campus job 25 percent (n = 36) - in a class Note: Only answered by respondents who experienced harassment (n = 445). Percentages do not sum to 100 due to multiple responses..")
78
Respondents Who Believed They Received Stares Where Did The Perceived Conduct Occur? 53 percent (n = 49) - in a class 47 percent (n = 44) - while walking on campus Note: Only answered by respondents who experienced harassment (n = 445). Percentages do not sum to 100 due to multiple responses.
 - in a class 47 percent (n = 44) - while walking on campus Note: Only answered by respondents who experienced harassment (n = 445). Percentages do not sum to 100 due to multiple responses..")
79
Source of Perceived Conduct by Position Status (n)
")
80
What did you do? 1 Personal responses: Was angry (56%) Felt embarrassed (41%) Told a friend (39%) Avoided the harasser (34%) Ignored it (28%) Reporting responses: Didn’t know who to go to (17% ) Made a complaint to a campus employee/official (16%) Did not report the incident for fear of retaliation (18%) Didn’t report it for fear my complaint would not be taken seriously (12%) Did report it but my complaint was not taken seriously (9%) 1 Respondents could mark more than one response
 Felt embarrassed (41%) Told a friend (39%) Avoided the harasser (34%) Ignored it (28%) Reporting responses: Didn’t know who to go to (17% ) Made a complaint to a campus employee/official (16%) Did not report the incident for fear of retaliation (18%) Didn’t report it for fear my complaint would not be taken seriously (12%) Did report it but my complaint was not taken seriously (9%) 1 Respondents could mark more than one response.")
81
Sexual Harassment/Sexual Assault The survey defined sexual harassment as “A repeated course of conduct whereby one person engages in verbal or physical behavior of a sexual nature, that is unwelcome, serves no legitimate purpose, intimidates another person, and has the effect of creating an intimidating, hostile, or offensive work or classroom environment.” The survey defined sexual assault as “Intentional physical contact, such as sexual intercourse or touching, of a person’s intimate body parts by someone who did not have permission to make such contact.”

82
Sexual Misconduct at UW-Whitewater

83
Respondents Who Experienced Sexual Assault

84
Respondents Who Believed They Were Sexually Assaulted

85
Where did it occur? On-campus (n = 38) Off-campus (n = 30) Who were the offenders against students?* Students (n = 26) What did you do 1 ? Told a friend (n = 45) Did nothing (n = 17) Told a family member (n = 12) Sought support from a campus resource (n = 11) 1 Respondents could mark more than one response
 Off-campus (n = 30) Who were the offenders against students * Students (n = 26) What did you do 1 . Told a friend (n = 45) Did nothing (n = 17) Told a family member (n = 12) Sought support from a campus resource (n = 11) 1 Respondents could mark more than one response.")
86
Respondents Who Seriously Considered Leaving UW-Whitewater

87
Employee Respondents Who Seriously Considered Leaving UW-Whitewater

88
Student Respondents Who Seriously Considered Leaving UW-Whitewater

89
Perceptions

90
Respondents Who Observed or Were Personally Made Aware of Conduct That Created an Exclusionary, Intimidating, Offensive and/or Hostile Working or Learning Environment %n Yes23.0727

91
Observed Exclusionary, Intimidating, Offensive, or Hostile Conduct by Race (%)
")
92
Observed Exclusionary, Intimidating, Offensive, or Hostile Conduct by Gender (%)
")
93
Observed Exclusionary, Intimidating, Offensive, or Hostile Conduct by Sexual Orientation (%)
")
94
Observed Exclusionary, Intimidating, Offensive, or Hostile Conduct by Position Status (%)
")
95
Form of Observed Exclusionary, Intimidating, Offensive, or Hostile Conduct n% Derogatory remarks 26536.5 Deliberately ignored or excluded 21930.1 Racial/ethnic profiling 21529.6 Stares 21429.4 Intimidation/bullying 14920.5 Someone isolated or left out because of their identity 12517.2 Derogatory written comments 12016.5 Assumption that someone was admitted or hired because of their identity 9012.4 Someone isolated or left out when working in groups 8211.3 Note: Only answered by respondents who observed harassment (n = 727). Percentages do not sum to 100 due to multiple responses.

96
Form of Observed Exclusionary, Intimidating, Offensive, or Hostile Conduct n% Graffiti 8111.1 Threats of physical violence 618.4 Someone receiving a low performance evaluation 547.4 Someone receiving a poor grade because of hostile classroom environment 537.3 Someone singled out as the “resident authority” regarding their identity 496.7 Someone fearing for their physical safety 476.5 Someone isolated or left out because of their socioeconomic status 425.8 Derogatory/unsolicited e-mails 344.7 Derogatory phone calls 263.6 Physical violence 233.2 Note: Only answered by respondents who observed harassment (n = 714). Percentages do not sum to 100 due to multiple responses.

97
Source of Observed Exclusionary, Intimidating, Offensive, or Hostile Conduct (%) Students (43%) Colleagues (15%) Faculty Members (13%) Staff Members (8%) Note: Only answered by respondents who observed harassment (n = 727). Percentages do not sum to 100 due to multiple responses.

98
Respondents Who Observed People Being Targets of Derogatory Remarks Where Did The Perceived Conduct Occur? 37 percent (n = 99) - while walking on campus 37 percent (n = 97) - in a public space on campus Note: Only answered by respondents who experienced harassment (n = 727). Percentages do not sum to 100 due to multiple responses.
 - while walking on campus 37 percent (n = 97) - in a public space on campus Note: Only answered by respondents who experienced harassment (n = 727). Percentages do not sum to 100 due to multiple responses..")
99
Respondents Who Observed People Being Deliberately Ignored or Excluded Where Did The Perceived Conduct Occur? 46 percent (n = 101) - in a class 26 percent (n = 57) - in a residence hall Note: Only answered by respondents who experienced harassment (n = 727. Percentages do not sum to 100 due to multiple responses.
 - in a class 26 percent (n = 57) - in a residence hall Note: Only answered by respondents who experienced harassment (n = 727. Percentages do not sum to 100 due to multiple responses..")
100
Respondents Who Observed Racial Profiling Where Did The Perceived Conduct Occur? 35 percent (n = 75) - while walking on campus 34 percent (n = 73) - in a residence hall Note: Only answered by respondents who experienced harassment (n = 727). Percentages do not sum to 100 due to multiple responses.
 - while walking on campus 34 percent (n = 73) - in a residence hall Note: Only answered by respondents who experienced harassment (n = 727). Percentages do not sum to 100 due to multiple responses..")
101
Respondents Who Observed Others Being Stared At Where Did The Perceived Conduct Occur? 47 percent (n = 101) - in a class 40 percent (n = 85) - in a public space on campus Note: Only answered by respondents who experienced harassment (n = 727). Percentages do not sum to 100 due to multiple responses.
 - in a class 40 percent (n = 85) - in a public space on campus Note: Only answered by respondents who experienced harassment (n = 727). Percentages do not sum to 100 due to multiple responses..")
102
Perceived Discrimination

103
Work-Life Issues The majority of respondents expressed positive attitudes about work-life issues.

104
Work-Life Issues 75% (n = 518) of employee respondents were comfortable asking questions about performance expectations. 37% (n = 258) believe there are many unwritten rules concerning how one is expected to interact with colleagues in their work units. 25% (n = 170) were reluctant to bring up issues that concern them for fear than it will affect their performance evaluation or tenure decision. 76% (n = 487) believed that they had colleagues or peers who gave them career advice or guidance when they need it.
 believe there are many unwritten rules concerning how one is expected to interact with colleagues in their work units. 25% (n = 170) were reluctant to bring up issues that concern them for fear than it will affect their performance evaluation or tenure decision. 76% (n = 487) believed that they had colleagues or peers who gave them career advice or guidance when they need it..")
105
Work-Life Issues 63% (n = 431) believed that they had support from decision makers/colleagues who supported their career advancement 44% (n = 133) of faculty thought their research interests were valued by their colleagues 23% (n = 157) constantly felt under the scrutiny by their colleagues 26% (n = 180) felt they had to work harder than their colleagues do in order to be perceived as legitimate 37% (n = 250) thought their compensation was equitable to their peers with similar levels of experience
 believed that they had support from decision makers/colleagues who supported their career advancement 44% (n = 133) of faculty thought their research interests were valued by their colleagues 23% (n = 157) constantly felt under the scrutiny by their colleagues 26% (n = 180) felt they had to work harder than their colleagues do in order to be perceived as legitimate 37% (n = 250) thought their compensation was equitable to their peers with similar levels of experience")
106
Work-Life Issues 67% (n = 459) of employees are usually satisfied with the way in which they were able to balance their professional and personal lives 42% (n = 287) found UW-Whitewater supportive of family leave 37% (n = 256) have had to miss out on important things in their personal lives because of professional responsibilities 18% (n = 121) felt that employees who have children were considered less committed to their careers 18% (n = 125) felt that employees who do not have children were often burdened with work responsibilities
 of employees are usually satisfied with the way in which they were able to balance their professional and personal lives 42% (n = 287) found UW-Whitewater supportive of family leave 37% (n = 256) have had to miss out on important things in their personal lives because of professional responsibilities 18% (n = 121) felt that employees who have children were considered less committed to their careers 18% (n = 125) felt that employees who do not have children were often burdened with work responsibilities")
107
Work-Life Issues 12% (n = 82) believed the institution was unfair in providing health benefits to unmarried, co-parenting partners 23% (n = 149) thought they had equitable access to domestic partner benefits 24% (n = 159) believed they had equitable access to tuition reimbursement
 believed the institution was unfair in providing health benefits to unmarried, co-parenting partners 23% (n = 149) thought they had equitable access to domestic partner benefits 24% (n = 159) believed they had equitable access to tuition reimbursement")
108
Welcoming Workplace Climate More than half of all employees thought the workplace climate was welcoming of “difference.” Respondents of Color and sexual minority respondents were least likely to believe the workplace climate was welcoming for employees based on gender, race and sexual orientation.

109
Welcoming Classroom Climate More than half of all student respondents felt that the classroom climate was welcoming for students based on “difference” across all dimensions. 64% of Students of Color and 81% of White students thought the classroom climate was welcoming based on race 58% of LGB students and 70% of heterosexual students thought the climate was welcoming based on sexual orientation

110
Institutional Actions

111
Visible Leadership Many respondents “strongly agreed” or “agreed” that most of the offices/individuals on campus provided visible leadership that fosters inclusion of diverse members of the campus community. Substantial percentages of respondents were also unaware of such visible leadership.

112
Inclusive Curriculum More than half of all students and faculty felt the courses they took or taught included materials, perspectives, and/or experiences of people based on all dimensions of “difference” listed in the survey.

113
Factors that Influence Attendance at Diversity Initiatives More than half of all respondents: believed that diversity initiatives are relevant to their work believed that diversity events are well advertised felt welcome at these events felt school/work load prevents them from attending felt they learned from these events Less than half of all respondents: thought diversity events fit into their schedules thought diversity initiatives were not relevant to their roles on campus believed they were expected to attend diversity events received a personal invitation to attend from a member of the institutional leadership

114
Employees Campus Initiatives That Would Positively Affect the Climate More than half of all employee respondents recommended: training mentors and leaders within departments to model positive climate behavior offering diversity training/programs as community outreach would positively affect the climate that faculty/staff/students learn a second language, participate in service-learning projects with lower socioeconomic status populations, and work with underrepresented/underserved populations providing on-campus child care services providing gender neutral/family friendly facilities

115
Employees Campus Initiatives That Would Positively Affect the Climate More than half of all employee respondents recommended: providing, improving, and promoting access to quality services for those individuals who experience sexual abuse providing mentors for minority faculty/students/staff new to campus providing a clear protocol for responding to hate/hostile incidents at the campus level and departmental level

116
Employees Campus Initiatives That Would Positively Affect the Climate Less than half of all employee respondents recommended: providing tenure clock options with more flexibility for promotion and tenure for faculty/staff with families would positively affect the climate providing recognition and rewards for including diversity in course objectives throughout the curriculum rewarding research efforts that evaluate outcomes of diversity training requiring diversity related activities as one of the criteria for hiring and/or evaluation of staff, faculty, and administrators reallocating resources to support inclusive climate changes on campus requiring the Affirmative Action Office to provide diversity and equity training to every search and screen committee

117
Summary Strengths and Successes Challenges and Opportunities

118
Summary of Findings Strengths and Successes 90% percent of students were satisfied with their education at UW-Whitewater. 81% of employees were satisfied with their jobs at UW- Whitewater Over 85% of respondents reported that they were very comfortable or comfortable with the overall climate, climate in their departments or work unit, and climate in their classes.

119
Summary of Findings Opportunities and Challenges

120
Differential Treatment by University Status For those who reported they experienced harassment, university status was the third most common basis. Of those respondents who believed that they had observed discriminatory hiring, discriminatory employment-related disciplinary actions, and discriminatory practices related to promotion, UW-Whitewater status was indicated as the fourth most common basis for discrimination.

121
Differential Treatment by University Status – Classified Staff A greater percentage of classified staff respondents (28%, n = 57) believed they had been harassed than did academic staff respondents (22%, n = 38) and faculty (25%, n = 77). Classified staff members were less satisfied with their jobs and much less satisfied than with the way their careers have progressed when compared with academic staff and faculty. Classified staff were slightly more likely academic staff and faculty to observe harassment, discriminatory hiring, discriminatory disciplinary actions, and discriminatory practices related to promotion.

122
Gender Inequity Gender was cited as the most common basis for perceived harassment, with women more than two times (37%, n = 105) as likely as men (14%, n = 22) to indicate such a basis. Women were slightly more likely than men to believe they had observed discriminatory hiring practices and promotion/tenure practices. Gender the most cited basis for observed discriminatory hiring and discriminatory practices related to promotion and tenure.

123
Racial Tension at UW-Whitewater More Respondents of Color (18%, n = 75) reported personally experiencing harassment when compared to their White counterparts (13%, n = 359). Forty-eight percent (n = 36) of Respondents of Color said the harassment was based on their race. People of Color were 16 times more likely to indicate racial profiling as a form of experienced harassment and nine times more likely to indicate someone assumed they were admitted or hired because of their identity when compared with their White counterparts.
 of Respondents of Color said the harassment was based on their race. People of Color were 16 times more likely to indicate racial profiling as a form of experienced harassment and nine times more likely to indicate someone assumed they were admitted or hired because of their identity when compared with their White counterparts..")
124
Racial Tension at UW-Whitewater People of Color were more likely than White people to observe offensive, hostile, exclusionary, or intimidating conduct. Of those who observed harassment, 28% (n = 203) believed it was based on race. People of Color were less comfortable than White respondents with the overall climate for diversity, the climate in their departments/work units, and the climate in their classes.
 believed it was based on race. People of Color were less comfortable than White respondents with the overall climate for diversity, the climate in their departments/work units, and the climate in their classes..")
125
Racial Tension at UW-Whitewater Employees of Color were more likely than White employees to report: colleagues expect them to represent “the point of view” of their identity they have to work harder than their colleagues do in order to be perceived as legitimate they are more reluctant to take family leave that they are entitled to for fear that it may affect their career there are many unwritten rules concerning how one is expected to interact with colleagues in their work unit that others seem to find it easier than they do to “fit in.” Employees of Color were also more likely to believe they had observed discriminatory hiring practices and practices related to promotion and tenure.

126
Homophobia and Heterosexism LGBQ respondents were more than twice as likely than heterosexual respondents to believe that they had experienced harassment. Of those who believed they had experienced this type of conduct, 53% (n = 24) of LGBQ respondents versus two percent (n = 7) of heterosexual respondents indicated that this conduct was based on sexual orientation. A much higher percentage of LGBQ respondents believed they had observed offensive, hostile, exclusionary, or intimidating conduct than did heterosexual respondents (39% compared with 22%).
 of LGBQ respondents versus two percent (n = 7) of heterosexual respondents indicated that this conduct was based on sexual orientation. A much higher percentage of LGBQ respondents believed they had observed offensive, hostile, exclusionary, or intimidating conduct than did heterosexual respondents (39% compared with 22%)..")
127
Homophobia and Heterosexism 39% (n = 282) of respondents who observed harassment indicated the base for that conduct was sexual orientation, making it the most common basis for observed harassment. LGBQ respondents were less comfortable with the overall climate for diversity, the climate in their departments/work units, and the climate in their classes. LGBQ employee respondents were less likely to believe the workplace climate was welcoming based on sexual orientation. LGBQ students were more likely than heterosexual students to have seriously considered leaving the institution.

128
Next Steps

129
Process Forward Fall/Winter 2010 Share report results with community Community dialogue regarding the assessment results Community feedback on recommended actions Executive Summary available on the UW-Whitewater website Full Report will be available in June 2010 Recommended planning “advance” to begin a “call to action” regarding the challenges uncovered in the report

130
Tell Us What You Think… Additional questions/comments on results? Thoughts on process? Suggested actions?

131
Questions..? Other Ideas..?

Similar presentations


 Strategy Map October 2009 01/04/11 University Strategic Goals Ensuring Student Success (Access, Recruitment.>")

