Download presentation
Presentation is loading. Please wait.

1
Chronic Disease Prevention November 20, 2008

2
Objectives Background: Setting the Stage Status of Chronic Diseases in San Diego Evidenced-based Best Practices HHSA Chronic Disease Prevention Model

3
Setting the Stage Why Chronic Disease?

4
California Conference for Local Public Health Officers (CCHLO) –Chronic Disease Conference –Spurred Idea to develop CC Agency for Agency Two meeting held to date to develop an inventory of Agency Chronic Disease activities –SPOS came to PHS to conduct a “Focused Dialogue” –Chronic Disease was chosen
 –Chronic Disease Conference –Spurred Idea to develop CC Agency for Agency Two meeting held to date to develop an inventory of Agency Chronic Disease activities –SPOS came to PHS to conduct a Focused Dialogue –Chronic Disease was chosen")
5
What Is Chronic Disease? According the U.S. National Center for Health Statistics, is a disease that lasts 3 months or more. Cannot be prevented by vaccines or cured by medications. Caused by health damaging behaviors - particularly tobacco use, lack of physical activity, and poor eating habits. Is the leading cause of death and disability in the United States. Accounts for 7 of the 10 U.S. leading cause of death.

6
Why Should We Care? Chronic diseases are prevalent, preventable and costly! Cause extended pain and suffering, associated with decreased quality of life for millions. Treatment for seven chronic diseases including cancers, mental illnesses, heart disease, lung conditions, hypertension, stroke, and diabetes ran to nearly $280 billion in 2003; now estimated to be to $1.3 trillion per year. Prevention programs are highly cost-effective

7
Top 10 Causes of Mortality in San Diego County Rate Rank 2004 Rank 2005 Cause of Death20042005 11Heart Disease183.7172.6 22Cancer (any)166.3163.1 33Stroke49.841.3 45 COPD/Chronic lower respiratory diseases 38.339.1 54Alzheimer's Disease38.136 66Unintentional injuries28.628.5 77Diabetes mellitus19.121.1 88Influenza & pneumonia16.614.3 99Suicide10.49.9 10 Essential (primary) hypertension and hypertensive renal disease 9.19.4 Rates are per 100,000 population. Source: State of California, Department of Public Health, Center for Health Statistics, Vital Statistics Section, Death Statistical Master Files = Chronic Diseases

8
Death by Risk Factors

9
Physical Activity by Gender Percent Women Nutrition by Gender Men PA and Nutrition Trends

10
Healthcare Cost in California and San Diego $130 Billion spent (treatment and lost productivity) by California in 2003 $4.3 Billion in SD County (not including lung cancer treatment)
 by California in 2003 $4.3 Billion in SD County (not including lung cancer treatment)")
11
3 – FOUR – 50 3 RISK FACTORS (Tobacco Use, Poor Diet, Lack of Physical Activity) 4 CHRONIC DISEASES (Heart Disease/Stroke, Type 2 Diabetes, Respiratory Disease, Cancer) 50% of DEATH
 4 CHRONIC DISEASES (Heart Disease/Stroke, Type 2 Diabetes, Respiratory Disease, Cancer) 50% of DEATH")
12
Status of Chronic Diseases in San Diego What Are the Statistics?

13
*2006 U.S. data are preliminary LIFE EXPECTANCY TRENDS San Diego County vs United States, 2000-2006

14
San Diego County Population by Race/Ethnicity, 2007 Source: SANDAG, San Diego County 2007 Population Estimates 3 million people Racial/Ethnic groups from around the world. Over 100 languages Asian 9.4% N=292,251 White 51.6% N=1,597,847 Black 5.4% N=166,486 Hispanic 29.3% N=906,898 Hawaiian/Pacific Islander 0.4% N=13,144 American Indian 0.5 % N=15,946

15
San Diego County Population by Race/Ethnicity, Census 1990 vs. 2000 vs. 2007 Source: SANDAG, San Diego County 1990, 2000 Census, and 2007 Population estimates Between 1990 & 2000: The population of Hispanics and Asian increased The population of Whites and Blacks decreased Percent

16
All Cancer Deaths by Race/Ethnicity, 2005 Note: All rates are adjusted to 2000 Standard U.S. Population. Source: California Death Statistical Master File; SANDAG January 1, Population Estimates. Cancer is the second leading cause of death for San Diego County San Diego County Overall Rate, 2005: 163.1 / 100,000 HP 2010 Goal: 159.9

17
Selected Cancer Deaths by Race/Ethnicity, 2005 Note: All rates are adjusted to 2000 Standard U.S. Population. Source: California Death Statistical Master File; SANDAG January 1, Population Estimates. HP 2010 Goal

18
Coronary Heart Disease and Stroke Deaths by Race/Ethnicity, 2005 Note: All rates are adjusted to 2000 Standard U.S. Population. Source: California Death Statistical Master File; SANDAG January 1, Population Estimates. Blacks have the highest rate of coronary heart disease deaths and stroke deaths compared to other racial and ethnic groups. HP 2010 Goal CHD: 166.0 HP 2010 Goal Stroke: 48.0 San Diego County Overall: CHD Rate - 128.4 / 100,000 Stroke Rate – 41.3 / 100,000

19
Diabetes by Race/Ethnicity Source: Youth Risk Behavior Survey (YRBS), San Diego City Schools; California Office of Statewide Planning and Development;SANDAG January 1, Population Estimates; California Health Interview Survey (CHIS), California Department of Health Services, Death Statistical Master File. R/E Hospital Admissions 2005 Deaths (underlying) 2005 Black White Hispanic Asian/Other 69.0 16.6 33.5 21.2 303.5 87.1 236.0 87.6 10.7 7.7 18.4 7.4 % High School Students Overweight 2005 Prevalence of Diabetes Among Adults 2005* 6.6 5.1 6.5 7.2 * - Percentage of adults who were ever diagnosed with diabetes
 2005 Black White Hispanic Asian/Other % High School Students Overweight 2005 Prevalence of Diabetes Among Adults 2005* * - Percentage of adults who were ever diagnosed with diabetes.")
20
Diabetes Mortality Among the top 53 U.S. City/County jurisdictions San Diego County: Ranked 52 in 1990 Ranked 46 in 2004 Ranked 8th in the highest rate of change between 1990 and 2004 Source: NACCHO 53 Big Cities Health Inventory, 2007 Note: Ranking scheme - 1 being worst and 53 being best

21
Diabetes Mortality Among San Diego County Residents, 2000-2005 Deaths and Age-adjusted Rates HP2010 = 45

22
Diabetes Hospitalizations Among San Diego County Residents, 2001-2005 Number and Age-adjusted Rates

23
Diabetes Hospitalizations Among San Diego County Residents, 2001-2005 By Race/Ethnicity Number and Age-adjusted Rates

24
Overweight & Obese Adults* by Race/Ethnicity, 2005 * as Defined by Body Mass Index (BMI) Source: 2005 California Health Interview Survey (CHIS) HP 2010 Goal Obesity (BMI >30): 15% Unhealthy weight (BMI>25): 40%
 Source: 2005 California Health Interview Survey (CHIS) HP 2010 Goal Obesity (BMI >30): 15% Unhealthy weight (BMI>25): 40%")
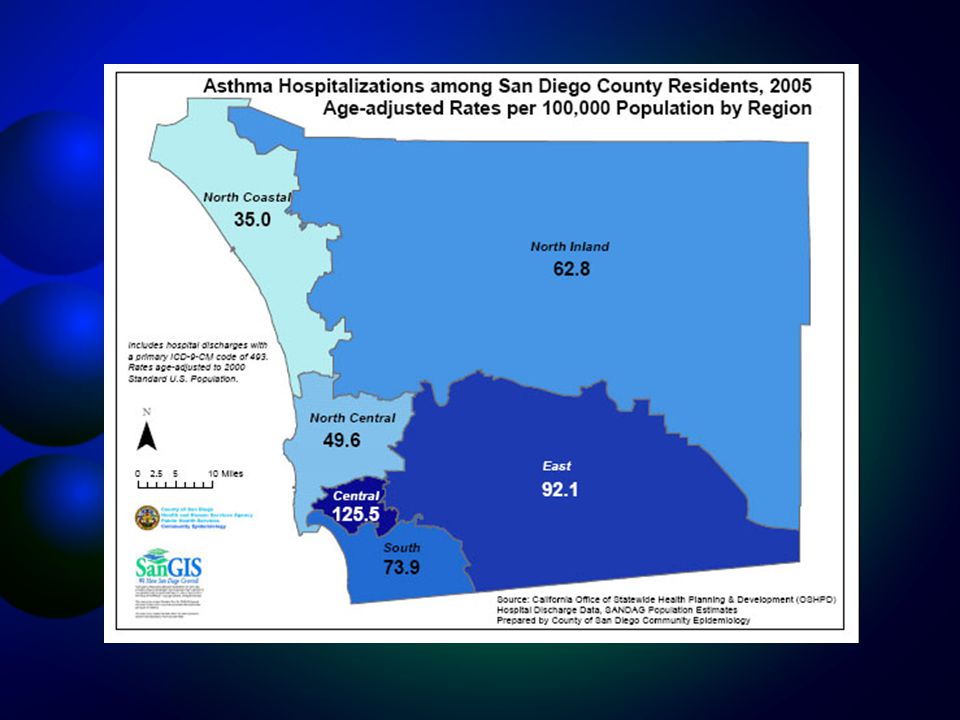
25
Asthma in San Diego County by Race/Ethnicity Source: 2005 California Health Interview Survey (CHIS), California Office of Statewide Planning and Development;SANDAG January 1, Population Estimates. California Department of Health Services, Death Statistical Master File * - These results for Blacks reflect 2003 data results since sample size for Blacks in 2005 was statistically unreliable. Race/Ethnicity Hospitalization Rate, 2005 Average Annual Number of Deaths 2002- 2004 Black White Hispanic Asian/Other 3 18 3 4 204.7 59.3 74.9 62.6 Estimated Prevalence Among Children 2005 13.8* 9.6 12.4 11.7

27
Selected Health Indicators* San Diego County, CA, & US, HP2010 Indicator Infant Mortality Adults reporting poor/fair health Incidence of AIDS CHD Deaths Suicides F. Breast Cancer Deaths Unintentional Injury Deaths San Diego County CAU.S. Healthy People 2010 Goal 4.6 14.4% 14.0 144.4 10.5 22.9 28.8 5.3 16.0% 11.8 162.8 8.5 24.1 30.5 7.0 14.0% 15.0 159.6 10.7 26.0 37.7 4.5 None 1.0 166.0 5.0 22.3 * - These data reflect the most current comparable data The numbers above reflect either rates or percentages

28
Evidence-based Best Practices Do They Work?

29
Direction from the National Level Federal Government Agencies –United States Department of Agriculture –United States Surgeon General –Centers for Disease Control

30
“Healthy places are those designed and built to improve the quality of life for all people who live, work, worship, learn, and play within their borders -- where every person is free to make choices amid a variety of healthy, available, accessible, and affordable options.” CDC’s “Designing & Building Healthy Places”

31
Leading Public Health Organizations –National Association of County and City Health Officials –National Task Force on Community Preventive Services –Robert Wood Johnson Foundation –Kaiser Permanente –American Planning Association (funded by CDC) Direction from the National Level
 Direction from the National Level")
32
Public –California Conference of Local Health Officers –California Department of Public Health –Governor's Obesity Prevention Plan Private –The California Endowment –Strategic Alliance Direction from the State Level

33
Best Practices and Promising Interventions 1.Healthy Community Improvements 2.Healthy Community Development 3.Healthy Community Plans & Policies

34
1. Healthy Community Improvements Partnering with communities and cities to improve existing physical and social conditions that prevent physical activity and healthy eating Best Practices and Promising Interventions

35
Healthy Community Improvements Safe and healthy routes to schools, parks, healthy foods, seniors –Traffic calming, improve street crossings Installing/improving sidewalks & bike paths Community gardens School/community joint use agreements

36
Safe and Healthy Routes to Schools and Parks, Healthy Foods, Seniors AARP - assessments - advocates

37
From abandoned lots to community gardens… Create gardens for culturally appropriate foods reflective of the community.

38
CX3 Projects (Chula Vista & La Mesa) Communities of Excellence in Nutrition, Physical Activity and Obesity Prevention Strong Partnerships Leadership Training Youth & Mentors Community Assessment Advocacy Outcomes La MesaChula Vista $550,000 Safe Routes to School grant to improve sidewalk connectivity Community “reclaimed” Lauderbach Park
 Communities of Excellence in Nutrition, Physical Activity and Obesity Prevention Strong Partnerships Leadership Training Youth & Mentors Community Assessment Advocacy Outcomes La MesaChula Vista $550,000 Safe Routes to School grant to improve sidewalk connectivity Community reclaimed Lauderbach Park")
39
2. Healthy Community Development Promoting healthy development and redevelopment projects in neighborhoods Best Practices and Promising Interventions

40
Healthy Community Development Integrating “Healthy Places” design into the Development Review process Redevelopment areas Grocery stores in underserved areas Facility design

41
Helping Communities get Developments Designed for “Health”

42
Trails and Trail Access Points

43
Eliminating Food Deserts… Attracting a Grocery Store into East Oakland, CA

44
Partners: East Oakland Diabetes Work Group, Alameda County Department of Public Health, Network for a Healthy California

45
3. Healthy Community Plans & Policies Promoting healthy government, school and worksite policies and plans that support physical activity, healthy eating and tobacco-free environments Best Practices and Promising Interventions

46
Healthy Community Plans & Policies Land use & transportation planning Affordable housing policies Regional Food Systems & Urban Agriculture Worksite Wellness policies Government Wellness policies School Wellness policies

55
City of Richmond General Plan Update

56
City of Richmond Health and Wellness Element Policy Framework www.healthycommunitiesbydesign.org

57
School Wellness Gardens Classroom Garden Beds Quad Area with Gardening

58
Healthier Vending Machines → →

59
Chronic Diease Model Will it Work?

60
Individuals Families Neighborhoods Policies and Laws Socio-Ecological Model Businesses

61
Environmental Approaches to Tobacco : The California Model Prop. 99 Tobacco Tax Funds Local Ordinances and State Legislation for Smoke-Free Environments Massive Anti-Tobacco Campaign

62
California vs. The US Smoking Rates Lung Cancer Death Rates Percent American Lung Association of California Centers for Disease Control, National Cancer Institute, statecancerprofiles.cancer.gov

63
Tobacco and Heart Attacks Pueblo, Colorado –Decrease in heart attack rates by 28% after smoke-free ordinance 399 HA pts in 1.5 yrs prior to ordinance, only 291 HA pts in 1.5 yrs after Helena, Montana –Decrease in heart attack rates by 40% during first 6 months of smoke-free ordinance

64
Why Act Now? Chronic Disease Prevention is strategic: –Fundamental to reducing death and disability and improving community health –Critical to cutting health care costs –Experience to-date shows that strategies can be very cost-effective –Funding opportunities for strategies that focus on environmental change

65
At its Foundation… Place Matters Adopting the concept that neighborhood environmental factors all affect individual behaviors and health From Policy Link and The California Endowment

66
Why Place Matters: Environmental Strategies Physical Environment –Safe parks; full-service grocery stores and farmers’ markets; safe, walkable streets; less truck and bus traffic; well- maintained housing; open spaces. Social Environment –Strong social networks that bring neighbors together—whether to advocate for change, cultivate a community garden, or provide services.

67
Why Place Matters: Environmental Strategies Economic Environment –Commercial investment, jobs that take people out of poverty, businesses that provide healthy food options. Service Environment –Access to quality healthcare services, public safety, and community support services.

68
Understanding the problem Heart Disease/Stroke Type 2 Diabetes Cancer Respiratory Disease Poor environments Unhealthy behaviors Chronic Diseases

69
Adopting a new solution Healthy environments Healthy Behaviors Disease Reduction Reduction in: Heart Disease/Stroke Type 2 Diabetes Cancer Respiratory Disease

70
QA & Comments

Similar presentations


 –Hubert H. Humphrey Comprehensive Health Center (South Los Angeles)>")


