Download presentation
Presentation is loading. Please wait.

1
Foreign Investment and Firm Productivity Dr. Hiau Looi Kee Development Research Group World Bank August 2005 I thank the World Bank, CIDA and DFID for providing research funding. The views expressed here are those of the author and do not necessarily reflect those of the affiliated institutions.

2
Introduction Less than15% of Bangladesh garment firms have foreign equity – unusual among developing countries Partly due to the industrial policies of Bangladesh which has been removed only recently Foreign firms are allowed to invest in Bangladesh garment sector only if they locate the plants in the export processing zones and with backward linkages

3
Million Dollar Questions What has Bangladesh been missing out by restricting FDI in RMG sector? Can a more liberal FDI policy be helpful in a cut throat competitive post MFA world?

4
Fundamental Questions Are FDI firms more productive than domestic firms in the garment sector of Bangladesh? If yes, then Bangladesh has missed out quite a bit by restricting FDI If yes, then Bangladesh has missed out quite a bit by restricting FDI Can domestic firms benefit from FDI firms in terms of productivity spillover? If yes, then a liberal FDI policy may be helpful in a post MFA world If yes, then a liberal FDI policy may be helpful in a post MFA world

5
Answers Yes, FDI firms indeed is 20% more productive than domestic firms on average Yes, domestic firms may indeed benefit from FDI firms – for every 10% productivity progress of FDI firms, productivity of domestic firms is raised by 1.4%

6
Data Unique custom data set of all exporting garment firms by destination in 2004 (Bangladesh Export Promotion Board) Newly collected firm survey of 350 firms with detailed information for productivity estimations, for 1999 – 2003 (World Bank)
 Newly collected firm survey of 350 firms with detailed information for productivity estimations, for 1999 – 2003 (World Bank)")
7
Possible Channels of Spillover Demonstration effects – FDI firms present the best practices and domestic firms learn from observing Mobility of workers – FDI firms train workers, who later left and join or form domestic firms Agglomeration effects – FDI firms attract international buyers and cut down search costs of domestic firms

8
Game Plan Overview of garment sector Export performance Estimating firm productivity Analysis of firm productivity Productivity differential of FDI firms Productivity spillover of FDI firms Conclusions

9
Overview of Garment Sector From Bangladesh Garment Manufacturers and Exporters Association (BGMEA) Members’ Directory 2004-2005 in 2004, there are over 4,000 garment firms, of which 2,800 are in Dhaka area 65% in the woven industry, 20% in the knitting industry, 15% in the sweater industry
 Members’ Directory in 2004, there are over 4,000 garment firms, of which 2,800 are in Dhaka area 65% in the woven industry, 20% in the knitting industry, 15% in the sweater industry")
10
about 1% of firms in the Dhaka and Chittagong EPZs, but 63% are FDI firms total employment is 2.1 million workers, with 53,000 workers in the firms with foreign ownership firms in Dhaka are larger and more productive, relative to firms in Chittagong EPZ firms are better

11
Using information from Directory FDI firms are most productive FDI firms are larger, they hire more workers given the same number of machine EPZ firms are also more capital intensive relative to non-EPZ firms 76% of the FDI firms are in the woven industry

12
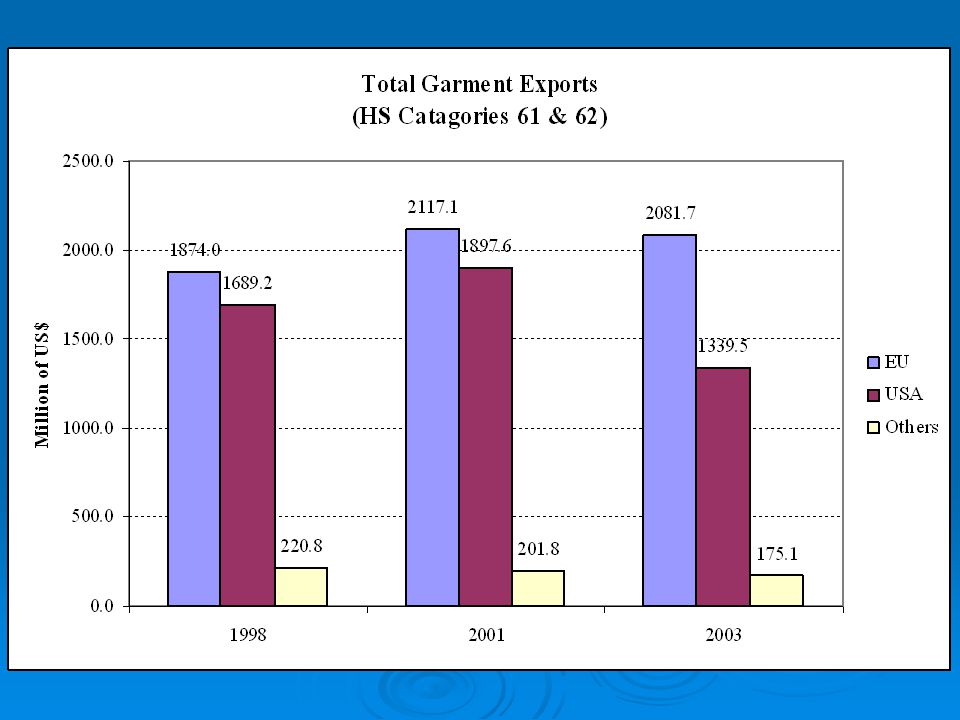
Export Performance Information obtained from the United Nations Comtrade Database according to reporting of the government of Bangladesh Moderate expansion of Bangladesh garment export in the past few years US$3.8 billion in 1998, US$4.2 billion in 2001 and US$3.6 billion in 2003

14
in1998 & 2001, 50% of garment went to EU EU share increases to 58% in 2003 in 1998 & 2001, 45% of garment went to US, but drop to 37% in 2003 other countries, noticeably Canada, made up the remaining 5% of aggregate garment export

15
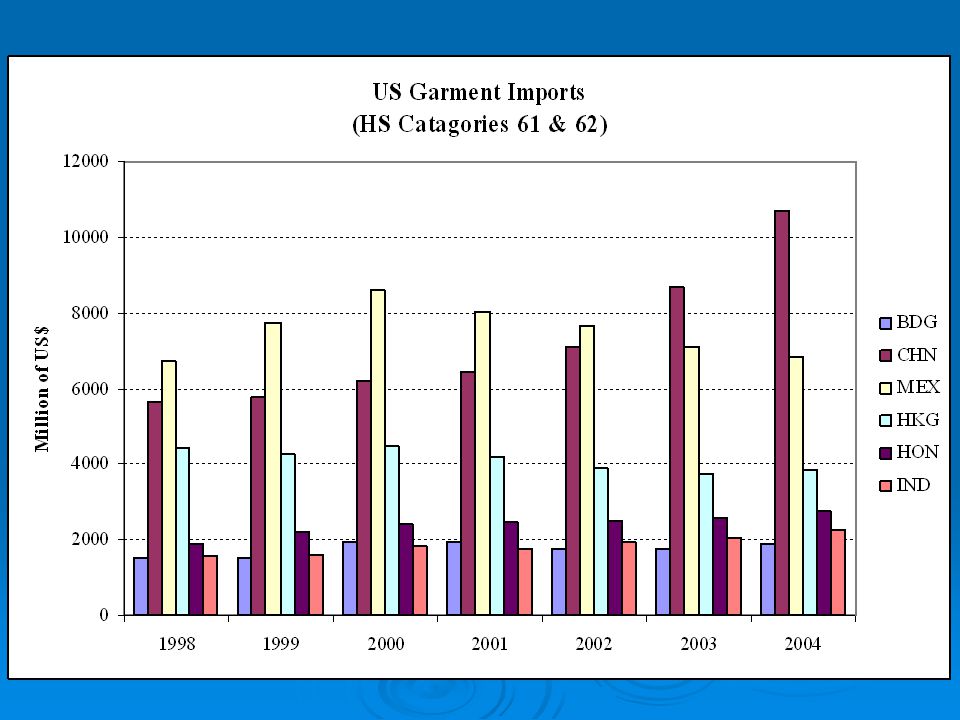
Data from US Custom The surprising fall in export to the US in 2003 could be due to transshipment or misclassification of goods US garment import from Bangladesh increased steadily from US$1.5 billion in 1998 to US$1.8 billion in 2003, and US$1.9 billion in 2004 Bangladesh the 10th largest garment supplier for the US market

17
Top 10 Garment Suppliers in US 1.China (16%) 2. Mexico (10%) 3. Hong Kong (5.8%) 4. Honduras (4.1%) 5. Vietnam (3.7%) 6. Indonesia (3.6%) 7. India (3.4%) 8. Dominican Republic (3.1%) 9. Guatemala (2.9%) 10. Bangladesh (2.8%).
 3. Hong Kong (5.8%) 4. Honduras (4.1%) 5. Vietnam (3.7%) 6. Indonesia (3.6%) 7. India (3.4%) 8. Dominican Republic (3.1%) 9. Guatemala (2.9%) 10. Bangladesh (2.8%)..")
18
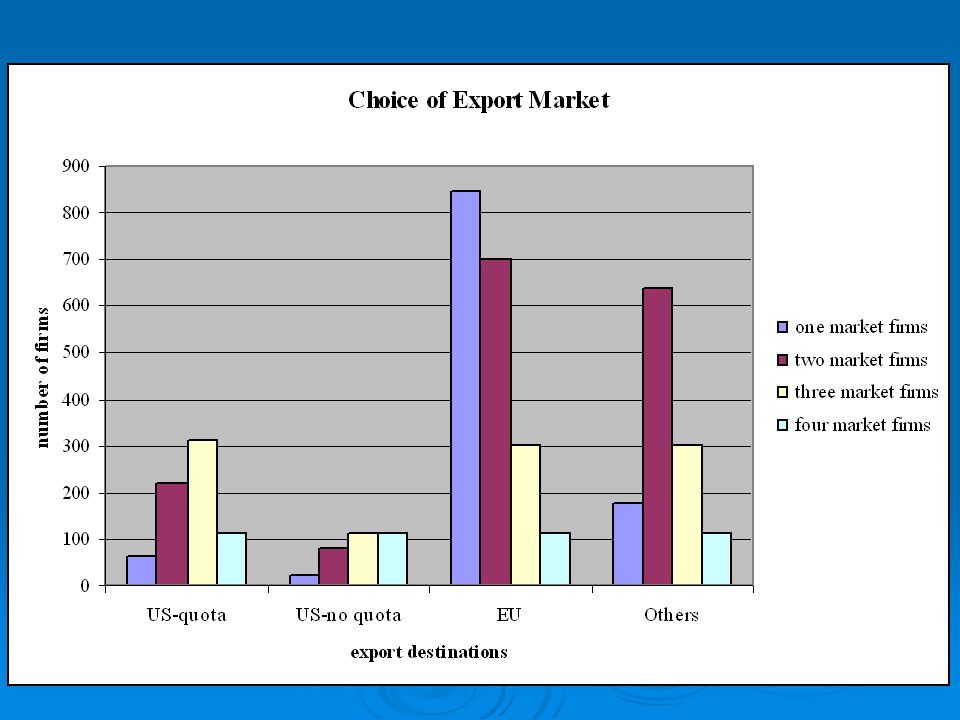
Custom Data Set Complete firm level export data set compiled from all firms that applied for Country of Origin Certificates in 2004 Total 2387 garment firms exporting in 2004, value US$5.7 billions, of which 57% to EU, 20% to US 1967 (82.4%) firms export to EU, 1039 (43.5%) firms export to the US, of which 709 (29.7%) export under quota allocations
 firms export to EU, 1039 (43.5%) firms export to the US, of which 709 (29.7%) export under quota allocations")
23
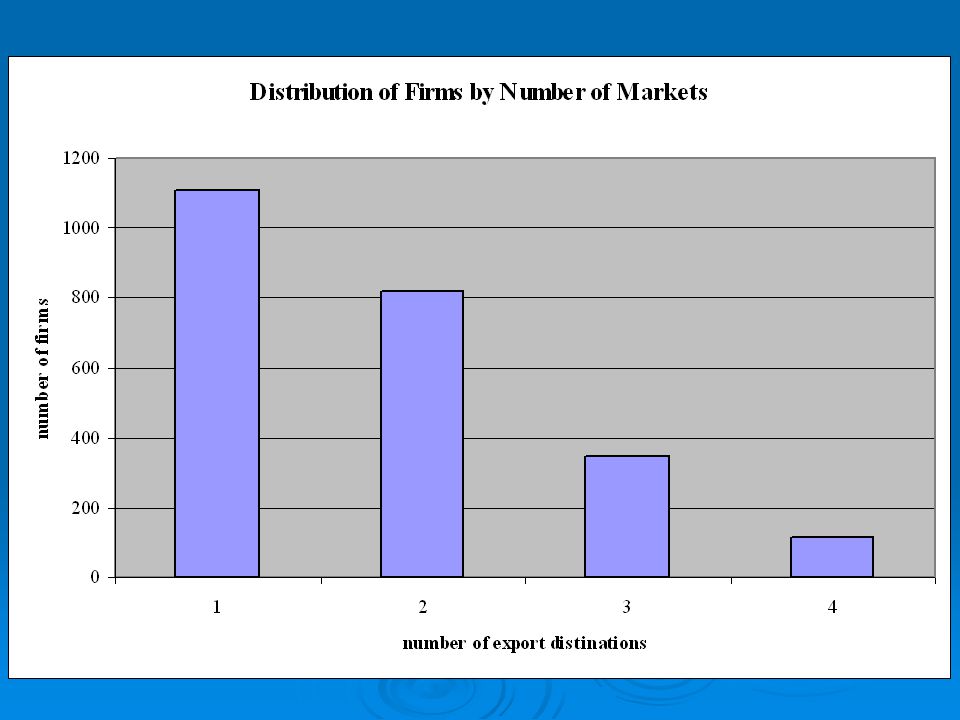
Summary Many one market firms and the preferred first market is the EU, but >50% of firms supply to more markets Significant heterogeneity among Bangladeshi exporters Firms that export to more destinations tend to have higher average unit values and be larger in size

24
Firm Panel Data Set Survey was conducted from November 2004 to April 2005, covers a stratified random sample of 350 firms (~10% of all garment firms) Total of 232 firms survive data cleaning in the unbalanced final panel data set of 1027 observations, from 1999 to 2003
 Total of 232 firms survive data cleaning in the unbalanced final panel data set of 1027 observations, from 1999 to 2003")
28
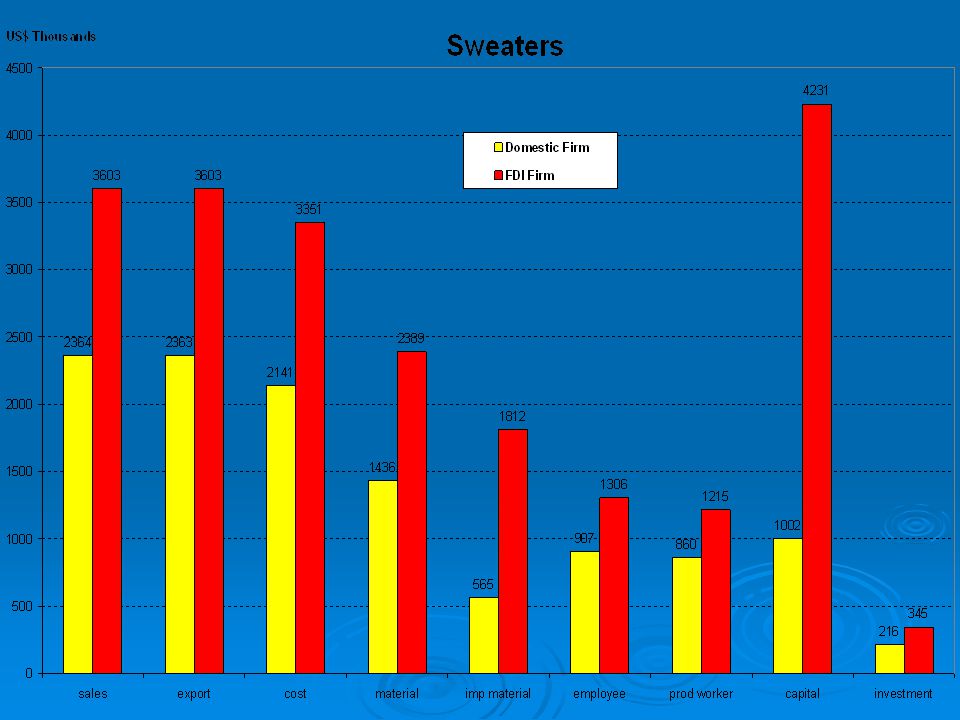
Summary FDI firms are larger in sales and exports, they purchase more material inputs, including imported materials, they hire more employees and production workers, they also have more capital and investment All these suggest that FDI firms are larger in scale and presumably more profitable and productive

29
Productivity Estimates Productivity -- produce more output given the same amount of inputs (labor, capital and materials) Based on Olley and Pakes (1996), correct for input endogeneity, selection bias, firm and year fixed effects Use the unique firm level price indexes to deflate sales and materials Construct capital stock using perpetual inventory method from firm investment
 Based on Olley and Pakes (1996), correct for input endogeneity, selection bias, firm and year fixed effects Use the unique firm level price indexes to deflate sales and materials Construct capital stock using perpetual inventory method from firm investment")
30
Table 2: Dependent variable – log of output

35
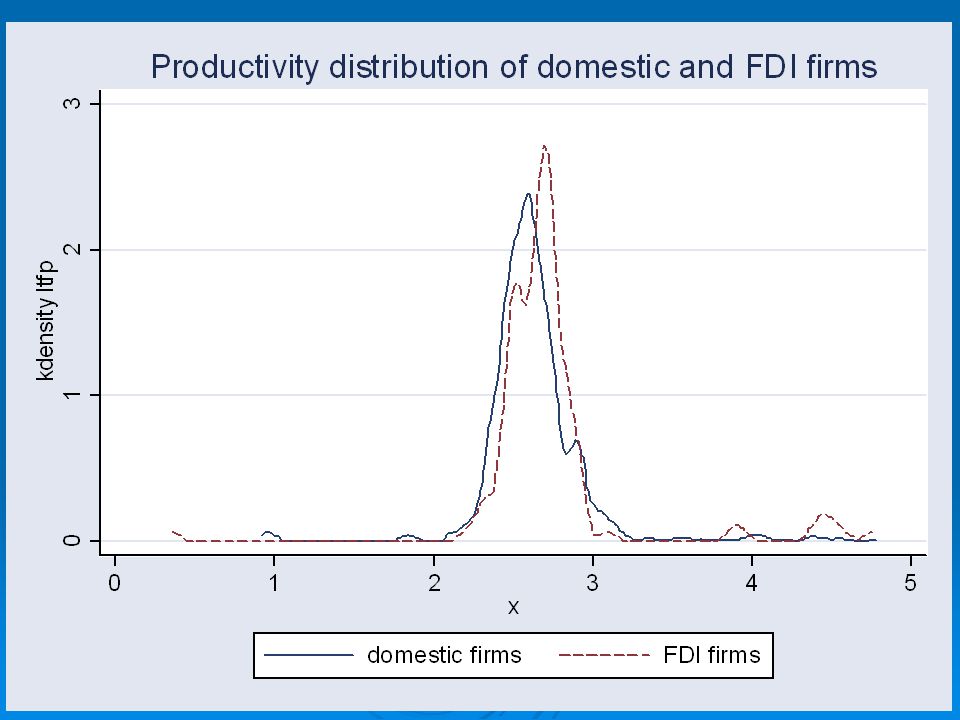
Are FDI firms more productive? yes!! on average, productivity of firms with foreign equity are about 20 percent higher than purely domestically owned firms

38
Why ? could be due to location, industry and year effects could be due to age, export destinations could be because they have access to the management and technical know-how and R&D output of their parent firms, which make them intrinsically more productive

40
Summary Productivity advantage of FDI is not driven by age, location, export destinations or industry/year effects FDI firms seem to be fundamentally different from domestic firms could be explained by their access to the management and technical know-how of their parent firms

41
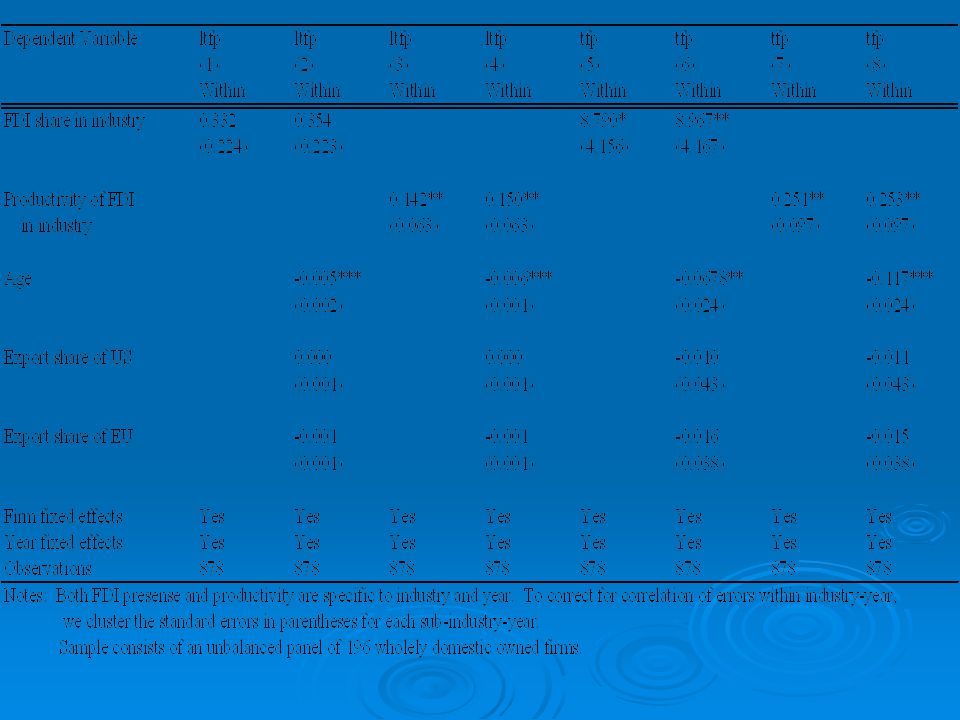
Can Domestic Firms Benefit from FDI Firms? through learning by observing – demonstration effects through worker mobility – human capital effects through cutting search or information costs – agglomeration effects

43
Results Yes, domestic firms can benefit significantly from the productivity progress of FDI firms For every 10% increase in the productivity of FDI firms, the productivity level of domestic firms in the same sub-industry improves by 1.4%

44
Conclusions FDI firms are more productive Productivity progress of FDI firms has positive spillover effects on the productivity of domestic firms Results are support from multiple data sources (garment firm directory, firm survey and regression analyses)
")
Similar presentations


 Bangladesh: A Strategy for Growth and Employment.>")


 in collaboration with J. Cajal-Grossi,>")


 Paul Deng March 22, 2011 1.>")


