Download presentation
Presentation is loading. Please wait.

1
Unit 16: Statistics Sections 16CDE Frequency Tables/Grouped Data/Histograms

2
It is very common to organize large amounts of data into a frequency table.

3
Marks ( x i )Frequency (f i ) 753 805 859 906 952 Example 1: The marks of some grade 12 students applying to university are given below
Frequency (f i ) Example 1: The marks of some grade 12 students applying to university are given below")
4
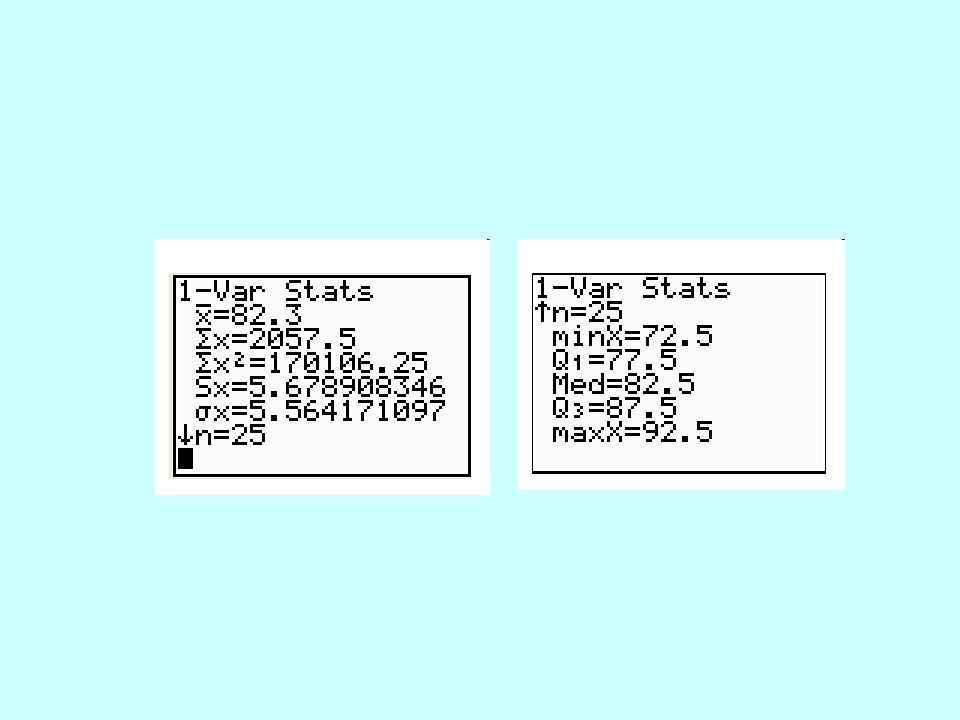
Determine the mean, median, quartiles and standard deviation for the data Using our calculator we get:

5
Our formula for the mean has been modified for frequency tables.

6
Sometimes we are given “Grouped Data” rather than exact data values MarksFrequency (f i ) [70,75[3 [75, 80[5 [80, 85[9 [85,90[6 [90, 95[2
 [70,75[3 [75, 80[5 [80, 85[9 [85,90[6 [90, 95[2")
7
Marksxixi Frequency (f i ) [70,75[72.53 [75, 80[77.55 [80, 85[82.59 [85,90[87.56 [90, 95[92.52 We no longer know the exact data values. We can only find an Estimate for the mean and standard deviation. To do this we use “mid class values x i

9
The grouped data can be displayed using a frequency histogram and frequency polygon Marksxixi Frequency (f i ) [70,75[72.53 [75, 80[77.55 [80, 85[82.59 [85,90[87.56 [90, 95[92.52
 [70,75[72.53 [75, 80[77.55 [80, 85[82.59 [85,90[87.56 [90, 95[92.52")
10
The grouped data can be displayed using a Cumulative frequency histogram and Cumulative frequency polygon MarksFrequency (f i ) Cumulative Frequency [70,75[33 [75, 80[58 [80, 85[917 [85,90[623 [90, 95[225
 Cumulative Frequency [70,75[33 [75, 80[58 [80, 85[917 [85,90[623 [90, 95[225")
11
We use the cumulative frequency polygon to estimate the median, upper and lower quartiles

12
We can also display the data using a “Box and Whisker Plot”

13
HOMEWORK: Read page 481 ex 16.8, page 482 key point 16.3 PAGE 475 # 1a, 3ai, 4 - 6 PAGE 483 # 3 – 6 PAGE 486 # 1a, 2, 3

Similar presentations


 OBJ: Find range, measures of central tendency, and construct tables and graphs.>")

