Download presentation
Presentation is loading. Please wait.

1
Environmental Analysis Machine Min Time Max Time Machine Min Time Max Time 1202651630 2202662026 3202672026 4202682026 Processing Time per Machine per Board

2
Environmental Analysis Selected Miscellaneous DataTime/shift 480 min Aisle/station2 Avg. downtime 30 min Board dimension 18”x28” Shifts/day 3 max Buffer cost $10,000 Maintenance 2 hrs/day Buffer capacity 1 Days/month20 Buffer dimension 5’x5’ Months/year13 Turntable cost $25,000 Inv. holding rate 18.5% Turntable capacity 1 Part value $10,000 Turntable dim. 5’x5’ Product Life 10 years Operator salary $60,000 Room dimension Actual33’x21’ 38’x24’ (35’x19’) Production quota 9,360 Mach. dimension 5’x5’ Scrap rate (1) 3% Aisle width 3.5’ Rework rate (5) 6%
 Production quota 9,360 Mach. dimension 5’x5’ Scrap rate (1) 3% Aisle width 3.5’ Rework rate (5) 6%.")
3
Problem Statement Time per Shift 480 min Average Downtime- 30 min Working Time per Shift 450 min Shifts per Day (2)x 2 shifts Days per Monthx 20 days Months per Yearx 13 months Processing Time per Year 3,900 hours Quota: 9,360 Boards per Year Maintenance assumed to take place in the 3 rd shift Time Constraints
x 2 shifts Days per Monthx 20 days Months per Yearx 13 months Processing Time per Year 3,900 hours Quota: 9,360 Boards per Year Maintenance assumed to take place in the 3 rd shift Time Constraints")
4
Methodology Find feasible layouts Measure room dimensions (account for pillars) Measure room dimensions (account for pillars) Arrange stations in order Arrange stations in order Run simulation on different layouts Define distribution (Uniform vs. Triangular) Define distribution (Uniform vs. Triangular) Scrap rate Scrap rate Rework rate Rework rate Collect output data Mean Mean Standard Deviation Standard Deviation Perform Case Analysis
 Define distribution (Uniform vs. Triangular) Scrap rate Scrap rate Rework rate Rework rate Collect output data Mean Mean Standard Deviation Standard Deviation Perform Case Analysis.")
5
Feasible Layouts Optional second door

6
hoursLayout #Mean*Std. Dev* 3,900 18,91419 29,21114 3,970 19,16827 29,43723 4,010 19,42423 29,52424 Simulation Results * Rounding the mean down and standard deviation up

7
Recommendation Layout 2 99% Confidence Interval: 99% Confidence Interval: Run Time Lower Bound Upper Bound 3,9009,1699,253 3,9709,3689,506

8
Expected Case

9
Worst Case

10
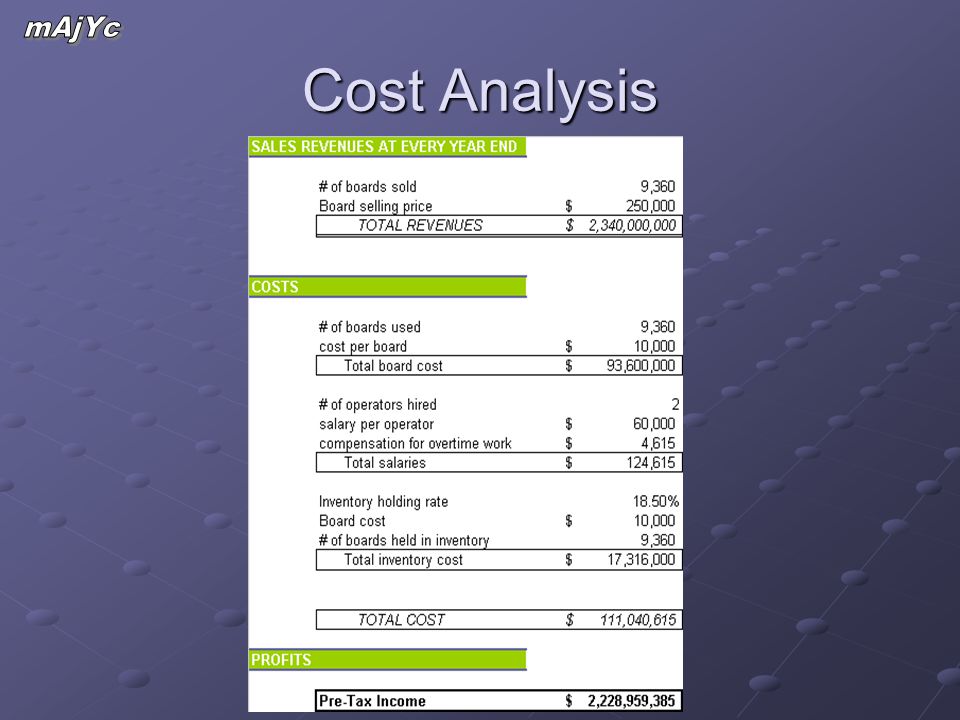
Cost Analysis

Similar presentations
: A linear program except that some or all of the decision variables must have integer.>")


, and type in a title for your data.>")


