Download presentation
Presentation is loading. Please wait.

1
1 Logistics Measures and Considerations IEGR 459: Intro to Logistics Management and Supply Chain Sept. 19, 2011 Fall 2011 Maintainability System Effectiveness Supply Chain Factors Transportation, Packaging and Handling Factors

2
2 Objective of maintainability Design and develop systems/equipment which can be maintained in the least time, at the least cost, and with a minimum expenditure of support resources, without adversely affecting the item performance or safety characteristics Maintainability greatly influences reliability and availability of a system or subsystem. Maintainability must be addressed early in the design stage to prevent or reduce failure or down times of the system.

3
3 Maintainability Definitions Maintainability is an inherent design characteristic of a system or product and it pertains to the ease, accuracy, safety, and economy in the performance of maintenance actions. Maintainability is the probability that a failed system will be restored to specified performance within a stated period of time when maintained under specified conditions.

4
4 Maintainability Metrics Times –MTTR: Mean Time to Repair –T 5o% : Median Time to Repair –T MAX : Maximum Time to Repair (usually 95 th percentile –LDT:Logistics Delay Time –SDT:Supply Delay Time –MDT: Mean Down Time –DTM:Down Time for Maintenance –DTS:Down Time For Supply Events –MTBM: Mean Time Between Maintenance –MTTPM: Mean Time to Preventive Maintenance –MTBPM: Mean Time Between Preventive Maintenance Manpower –CS: Crew Size –MMH/FH: Man-hours per flight hour Diagnostics –FD:Fault Detection –FI:Fault Isolation –FA:False Alarms

5
5 Maintenance Categories Maintenance Preventive Maintenance (retain item functionality) Corrective Maintenance (reestablish item functionality) Test of all relevant functions, Inspect to detect hidden failures Service to replace consumables Activities to compensate for drift and to reduce wear out failures Overhaul to increase useful life Time Change Prognostics health management: monitor and repair before failure Failure detection Failure isolation Repair Functional test
 Corrective Maintenance (reestablish item functionality) Test of all relevant functions, Inspect to detect hidden failures Service to replace consumables Activities to compensate for drift and to reduce wear out failures Overhaul to increase useful life Time Change Prognostics health management: monitor and repair before failure Failure detection Failure isolation Repair Functional test")
6
6 Maintenance Categories M ct – Mean Corrective-maintenance time Arithmetic average maintenance corrective cycle times Equivalent to MTTR. Probability functions for repair time Normal distribution Exponential distribution Log-normal Distribution

7
Repair-time distributions.

8
Corrective maintenance cycle.

9
9 Maintainability Measure Corrective Maintenace Time (minutes) 40584345638375669392 71525564376272977675 644839697146596864 67415430534883335063 86745172873757596563 Figures of Histogram and Frequency Polygon of maintenance actions Example:
 Figures of Histogram and Frequency Polygon of maintenance actions Example:")
10
10 Maintainability Measure Example:

11
Normal distribution of repair times. Example: Convert maintenance times of 40 and 50 mins into standard (Z)
.")
13
Lognormal distribution of repair times.

14
14 Mpt = ∑(fpt i )(Mpt i ) ∑fpt i Mean Preventive Maintenance time (Mpt) Mpt – Mean or average elapsed time for performing preventative or scheduled maintenance of an item. f pt i = Frequency of the individual (ith) preventative maintenance actions per system hour M pt i = elapsed time required for the ith preventative maintenace action
 preventative maintenance actions per system hour M pt i = elapsed time required for the ith preventative maintenace action.")
15
15 Mpt = ∑(fpt i )(Mpt i ) ∑fpt i Mean Preventive Maintenance time (Mpt) Mpt – Mean or average elapsed time for performing preventative or scheduled maintenance of an item. f pt i = Frequency of the individual (ith) preventative maintenance actions per system hour M pt i = elapsed time required for the ith preventative maintenace action
 preventative maintenance actions per system hour M pt i = elapsed time required for the ith preventative maintenace action.")
16
16 The median maintenance time is that value that divides all the downtime values so that 50% are equal to or less than the median and 50% are equal to or greater than the median. The median will usually give the best average location of the data sample. The median for a normal distribution is the same as the mean; the median in a log-normal distribution is the same as the geometric mean (MTTRg) Median active corrective maintenance time
 Median active corrective maintenance time.")
17
17 The median preventative maintenance time is that value that divides all the downtime values so that 50% are equal to or less than the median and 50% are equal to or greater than the median. Median active preventive maintenance time

18
18 Mean active maintenance time (M). M is the mean or average elapsed time required to perform scheduled (preventive) and unscheduled (corrective) maintenance. It excludes logistics delay time and administrative delay time. Mean active maintenance time (M).
 and unscheduled (corrective) maintenance. It excludes logistics delay time and administrative delay time. Mean active maintenance time (M)..")
19
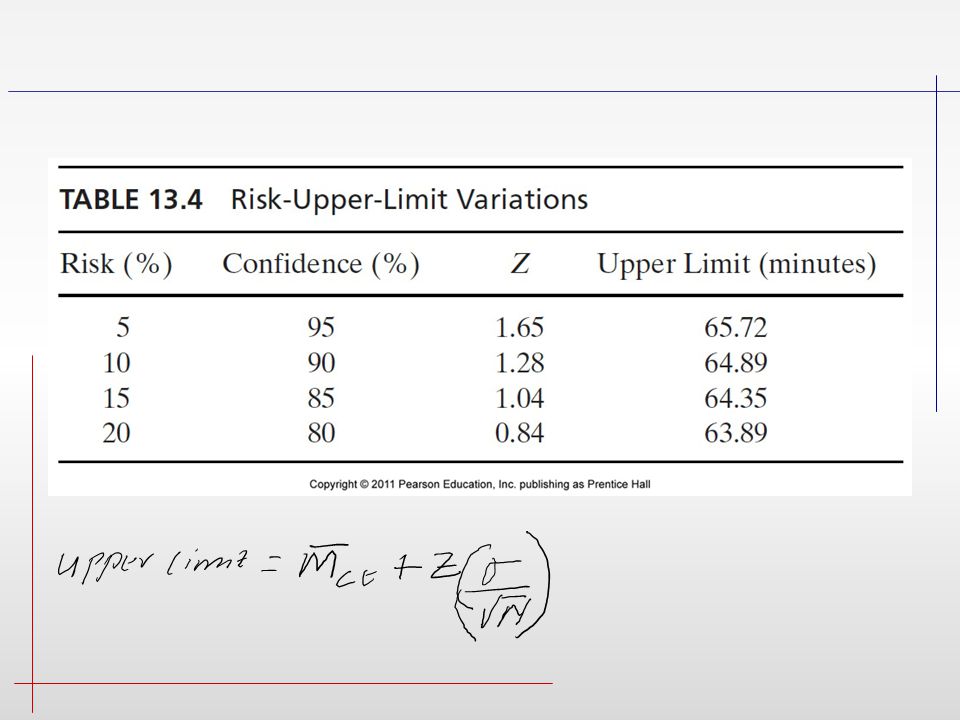
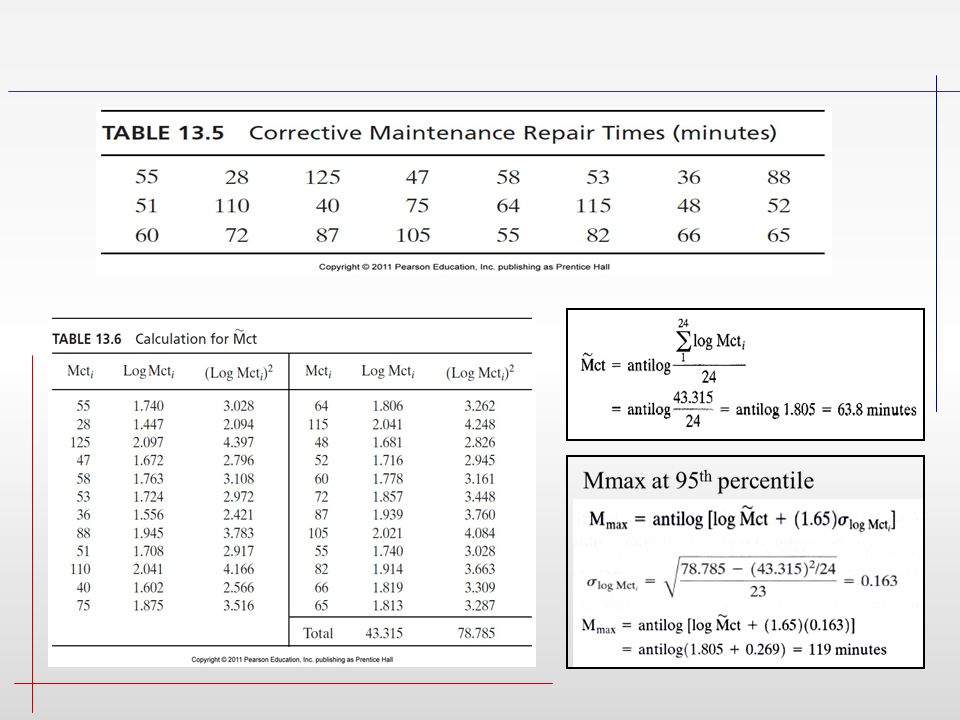
19 Mmax can be defined as that value of maintenance downtime below which a specified percentage of all maintenance actions can be expected to be completed. Mmax is related primarily to the log-normal distribution, and the 90th or 95th percentile point is generally taken as the specified value Maximum active corrective maintenance time (Mmax)
.")
21
21 Logistics delay time LDT - -Logistics delay time is the maintenance downtime that is expended as a result of waiting for a spare part to become available, waiting for necessary test equipment to perform maintenance. waiting for transportation, waiting to use a facility required for maintenance, and so on. LDT does not include active maintenance time but does constitute a major element of total maintenance downtime (MDT). Administrative delay time (ADT). Administrative delay time refers to that portion of downtime during which maintenance is delayed for reasons of an administrative nature: personnel assignment priority, labor strike, organizational constraint, and so on. ADT does not include active maintenance time but often constitutes a significant element of total maintenance downtime (MDT). Maintenance downtime (MDT). Maintenance downtime constitutes the total elapsed time required (when the system is not operational) to repair and restore a system to full operating status and/or to retain a system in that condition. MDT includes mean active maintenance time (M), logistics delay time (LDT), and administrative delay time (ADT). The mean or average value is calculated from the elapsed times for each function More Definitions
. Administrative delay time (ADT). Administrative delay time refers to that portion of downtime during which maintenance is delayed for reasons of an administrative nature: personnel assignment priority, labor strike, organizational constraint, and so on. ADT does not include active maintenance time but often constitutes a significant element of total maintenance downtime (MDT). Maintenance downtime (MDT). Maintenance downtime constitutes the total elapsed time required (when the system is not operational) to repair and restore a system to full operating status and/or to retain a system in that condition. MDT includes mean active maintenance time (M), logistics delay time (LDT), and administrative delay time (ADT). The mean or average value is calculated from the elapsed times for each function More Definitions.")
22
22 Other Maintenance Measures Maintenance Labor hours (MLH) MLH per System Operating hours (OH) MLH per cycle of system operation MLH per month MLH per maintenance action Maintenance Frequency Mean time between maintenance (MTBM) Mean time between replacement (MTBR) Maintenance Cost factors Cost per maintenance action ($/MA) $/OH $/month $/mission Ratio of maintenance cost to total life-cycle cost
 MLH per System Operating hours (OH) MLH per cycle of system operation MLH per month MLH per maintenance action Maintenance Frequency Mean time between maintenance (MTBM) Mean time between replacement (MTBR) Maintenance Cost factors Cost per maintenance action ($/MA) $/OH $/month $/mission Ratio of maintenance cost to total life-cycle cost")
23
Composite view of uptime/downtime factors.

24
The relationship between maintenance downtime and logistic and factors.

25
The elements of effectiveness.

26
26 Availability Availability – The probability or the percentage that a system will be ready or available when required for use and be able to complete its overall mission in a satisfactory manner A = Up-Time Up-Time + Down-Time inherent Availability – probability that a system or equipment, when used under stated conditions in an ideal support environment (i.e., readily available tools, spare: maintenance personnel, etc.), will operate satisfactorily at any point in time as required. It excludes preventive or scheduled maintenance actions, logistics delay time and administrative delay time

27
27 Achieved availability - the probability that a system or equipment, when used under stated conditions in an ideal support environment (i.e., readily available tools, spares, personnel, etc.), will operate satisfactorily at any point in time. Achieved availability includes preventative maintenance and excludes logistics delay time and administrative delay time Operational availability - the probability that a system or equipment, when used under stated conditions in an actual operational environment, will operate satisfactorily when called upon.

28
Systems Measures of Effectiveness 28

29
System Effectiveness 29 System effectiveness - Function of performance (P), Availability (A) and dependability (D) SE = (P) (A) (D) Overall equipment effectiveness - Function of performance rate (P), Availability (A)and quality rate (Q) SE = (P) (A) (Q) Availability = (loading time – downtime)/loading time Performance rate = {(output)(Actual time)/(loading time – downtime)} x (idea cycle time)/(actual cycle time) Quality rate (Q) = {input – (Quality defects + Startup defects + rework)}/input
, Availability (A) and dependability (D) SE = (P) (A) (D) Overall equipment effectiveness - Function of performance rate (P), Availability (A)and quality rate (Q) SE = (P) (A) (Q) Availability = (loading time – downtime)/loading time Performance rate = {(output)(Actual time)/(loading time – downtime)} x (idea cycle time)/(actual cycle time) Quality rate (Q) = {input – (Quality defects + Startup defects + rework)}/input")
30
Cost Effectiveness 30

31
Cost Effectiveness 31 With respect to availability Cost effectiveness = Availability/ Life-cycle cost With respect to Performance Cost effectiveness = Performance/ Life-cycle cost With respect to Logistics effectiveness Cost effectiveness = Logistics effectiveness/ Life-cycle cost Cost effectiveness with respect to overall equipment effectiveness Cost effectiveness with respect to facility space

Similar presentations


 2.Mean preventive maintenance.>")


 w Learn how to use these MP w Learn about Techniques for Continuous.>")

