Download presentation
Presentation is loading. Please wait.

1
With your partner, roll a number cube 20 times. Record your data in a table. Include a column for the cumulative total (or sum) of your rolls up to that point, such as: RollsTotalNext roll 005 155 2104 3142 4166 5223
 of your rolls up to that point, such as: RollsTotalNext roll")
3
Investigation 6B Advanced Integrated Math I

4
Look at the table you made in the warm-up. Is there a linear function that matches the table? Justify your answer.

5
Bethany rolls a number cube 100 times and records the total. Which of these totals is most likely after 100 rolls? Explain. A. 98 B. 256 C. 354 D. 412

6
On graph paper, draw a scatter plot with the number of rolls, r, on the horizontal axis and the total, T, on the vertical axis. Your graph should go from 0 to 20 on the horizontal axis and should fill up a whole sheet of graph paper.

7
On your scatter plot, graph each of the following functions: Which function best fits your data? Which function fits the worst?

8
Think about a ruler with weights hanging from it. Assume the weights are equal and the ruler’s weight is negligible. a) Suppose the ruler has two weights on it, at 3 inches and 8 inches. Where can you place the ruler on your finger to balance the weights? b) Suppose the two weights are at x inches and y inches. Write a rule that tells you where the ruler’s balance point is. c) Suppose the ruler has three weights on it, at 1 inch, 3 inches, and 8 inches. Where is the ruler’s balance point?
 Suppose the ruler has two weights on it, at 3 inches and 8 inches. Where can you place the ruler on your finger to balance the weights. b) Suppose the two weights are at x inches and y inches. Write a rule that tells you where the ruler’s balance point is. c) Suppose the ruler has three weights on it, at 1 inch, 3 inches, and 8 inches. Where is the ruler’s balance point .")
9
Page 525 #7-13

10
See textbook for #9-13

12
Think about a ruler with weights hanging from it. Assume the weights are equal and the ruler’s weight is negligible. a) Suppose the ruler has two weights on it, at 3 inches and 8 inches. Where can you place the ruler on your finger to balance the weights? b) Suppose the two weights are at x inches and y inches. Write a rule that tells you where the ruler’s balance point is. c) Suppose the ruler has three weights on it, at 1 inch, 3 inches, and 8 inches. Where is the ruler’s balance point?
 Suppose the ruler has two weights on it, at 3 inches and 8 inches. Where can you place the ruler on your finger to balance the weights. b) Suppose the two weights are at x inches and y inches. Write a rule that tells you where the ruler’s balance point is. c) Suppose the ruler has three weights on it, at 1 inch, 3 inches, and 8 inches. Where is the ruler’s balance point .")
14
Wednesday, February 25 4 th period (and into lunch)
")
15
Section 6.08 Advanced Integrated Math I

17
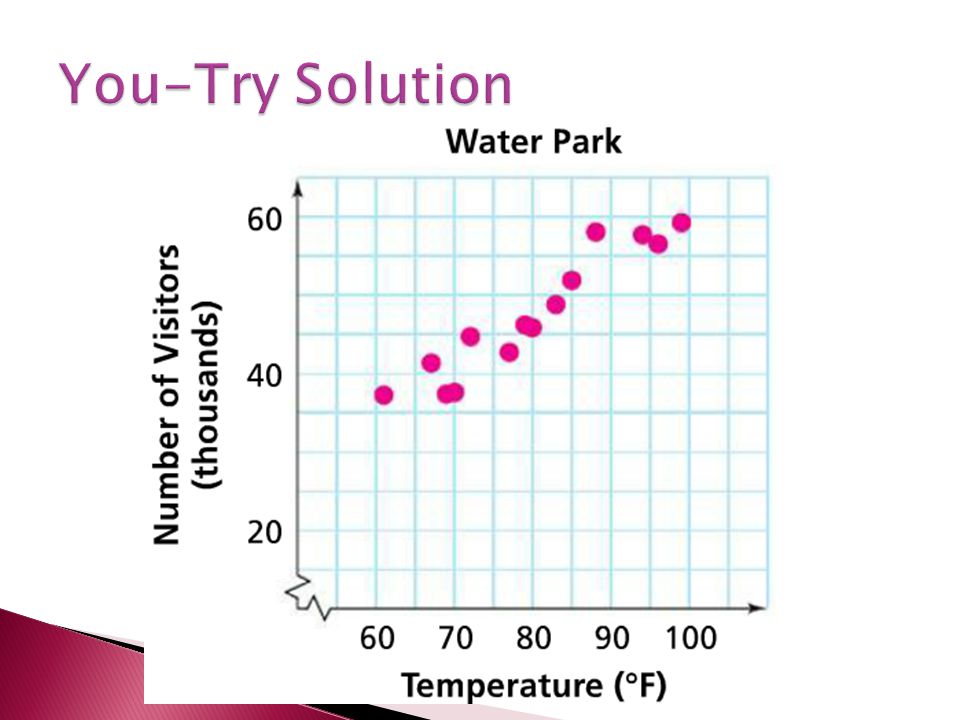
Mr. Green is the manager of the concession stand at a water park. He wants to know how much food he needs each day. Last summer, he recorded the high temperature of the day and the number of visitors to the park. Draw a scatter plot to see if there is a linear trend.

19
A fitting line is a line that comes close to the data points. The line of best fit is the most accurate fitting line. ◦ You cannot free-draw a line of best fit. It must be calculated mathematically.

20
What do we need in order to write the equation of a line?

21
The balance point of bivariate data is the mean of the data. ◦ The x-coordinate of the balance point is the mean of the x-values. ◦ The y-coordinate of the balance point is the mean of the y-values. We can use the balance point to write the equation of a fitting line.

22
Find the mean of the temperatures. Find the mean of the number of visitors.

23
Estimate a slope that seems to fit the data.

24
The forecast is for a high of 75°F. Estimate how many people will visit the park.

26
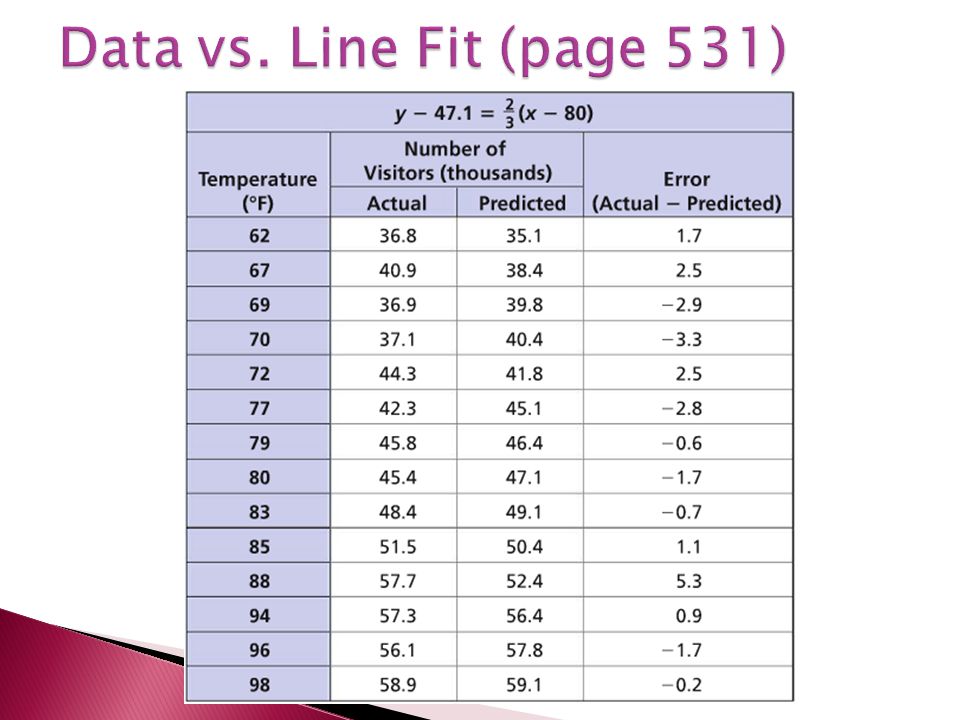
The residual is the error (Actual value) – (Predicted value) We need a number that represents all of the residuals. ◦ The answer is coming later in Investigation 6B

27
Read section 6.08 (pages 528-531) Page 533 #5-9 ◦ All graphs must be done on graph paper
 Page 533 #5-9 ◦ All graphs must be done on graph paper")
30
Without doing any calculations, estimate where the balance point would be for the following scatter plot.

32
Section 6.09 Advanced Integrated Math I

33
The balance point for the entire data set is (1949.8, 227.82) The balance point if you exclude the 1896 data point is (1952.2, 225.85)
 The balance point if you exclude the 1896 data point is (1952.2, )")
34
Estimate a slope for the scatter plot both including and excluding the 1896 data point.

35
Excel Time!

36
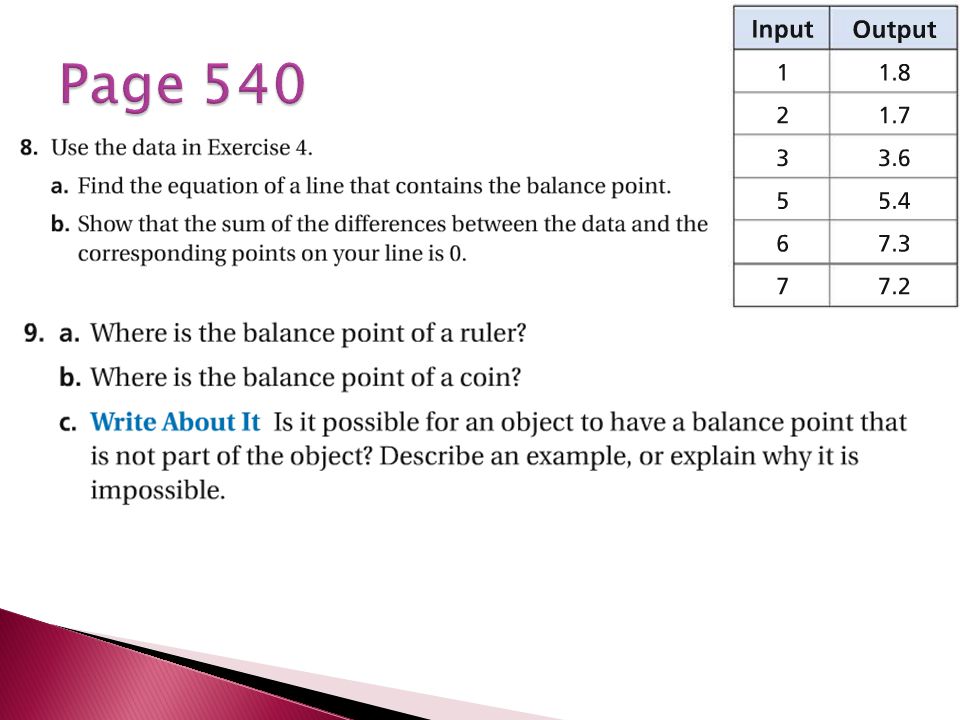
Read Section 6.09 (pages 536-538) Page 540 #8, 9, 11, 12, 13 ◦ Skip 8c
 Page 540 #8, 9, 11, 12, 13 ◦ Skip 8c")
39
Roger analyzed the data in the table and chose the fitting line y=3x+2. Determine the sum of the squares of the residuals. xy prediction residual res 2 01.820.20.04 15.150.10.01 27.480.60.36 310.9110.10.01 4151411.00 xy 01.8 15.1 27.4 310.9 415

41
Section 6.10 Advanced Integrated Math I

42
The mean absolute error is the average of the absolute values of the residuals/errors. The mean squared error is the average of the squares of the residuals/errors. ◦ The line of best fit minimizes the mean squared error. The standard error is the square root of the mean squared error. ◦ Also called the “root mean squared error.”

43
Read section 6.10 (page 543-546) PROJECT!!!
 PROJECT!!!")
Similar presentations


>")


Freehand Linear Fit b)Least Squares Fit c)Interpolation/Extrapolation.>")


 for each data point is the ________________________.>")


 3. C(–2, –1) 5. E(1, 0) 2. B( – 3, 3) 4. D(0, – 3) 6. F(3, – 2)>")
 2) 3) 4) 5)>")


