Download presentation
Presentation is loading. Please wait.

1
Michigan Department of Transportation Highway Operations - Performance Measures & Management Steven J. Cook, P.E. Engineer of Systems Operations & Maintenance

2
Overview Performance Management vs. Performance Measures User Delay Cost (UDC) Performance Management Process Mobile Data Source Outcomes
 Performance Management Process Mobile Data Source Outcomes.")
3
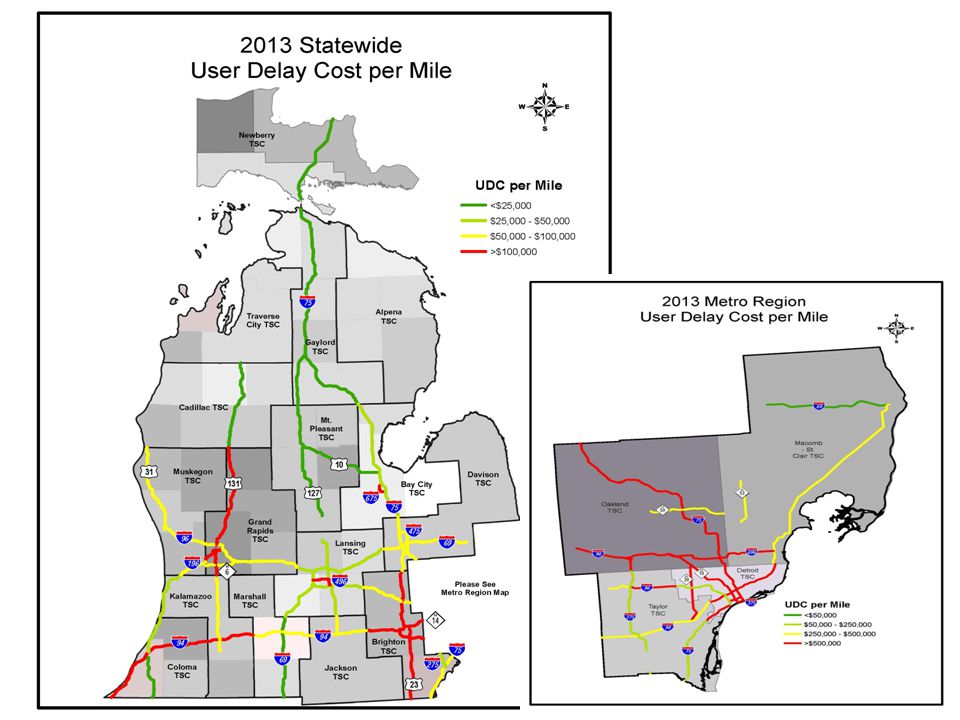
User Delay Cost Traditional project level taken to Transportation Systems Management & Operations level – Calculation based on travel volumes, speeds (constants: vehicle occupancy, cost per vehicle, segment, etc.) – Sensor and probe vehicle data (HERE previous Navteq) Travel Times and Mi Drive website User Delay Cost Performance Measurement Tool – “Red Images” – Regional Integrated Transportation Information System (RITIS)
 – Sensor and probe vehicle data (HERE previous Navteq) Travel Times and Mi Drive website User Delay Cost Performance Measurement Tool – Red Images – Regional Integrated Transportation Information System (RITIS)")
4
User Delay Cost Method 1. Capture Delays (red images) 2. Review images, document delays 3. Sum the number delays, convert to a user cost

5
User Delay Cost Method UDC on I-94 Work Zone Incident Example: 09/09/2013

6
RITIS – Congestion Scan User Delay Cost: $87,000 ~4 hours 7 miles Gawking - additional UDC

8
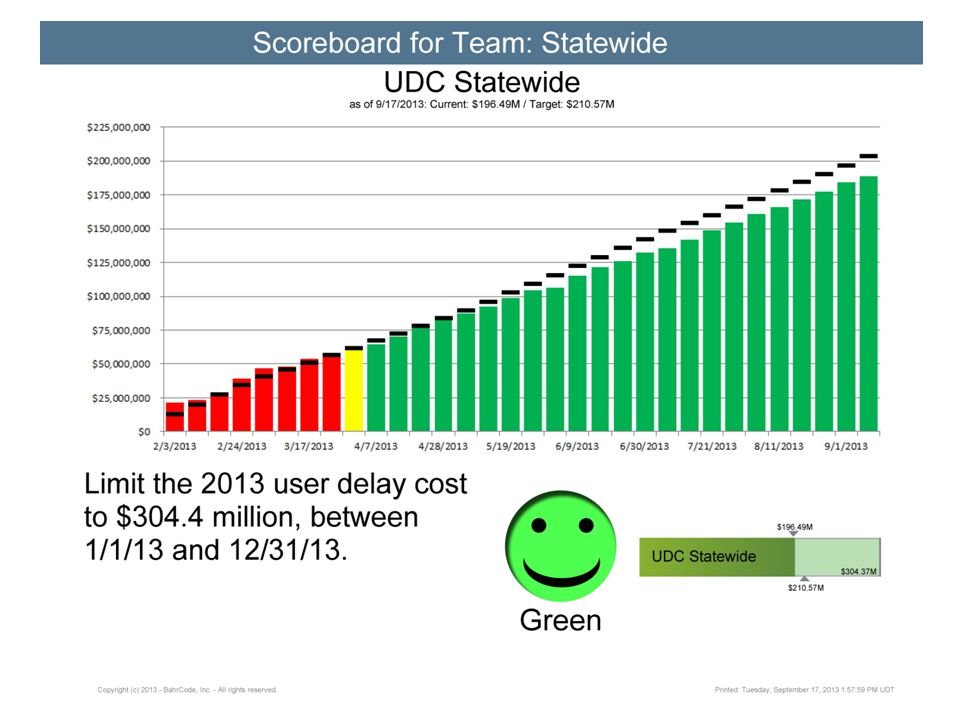
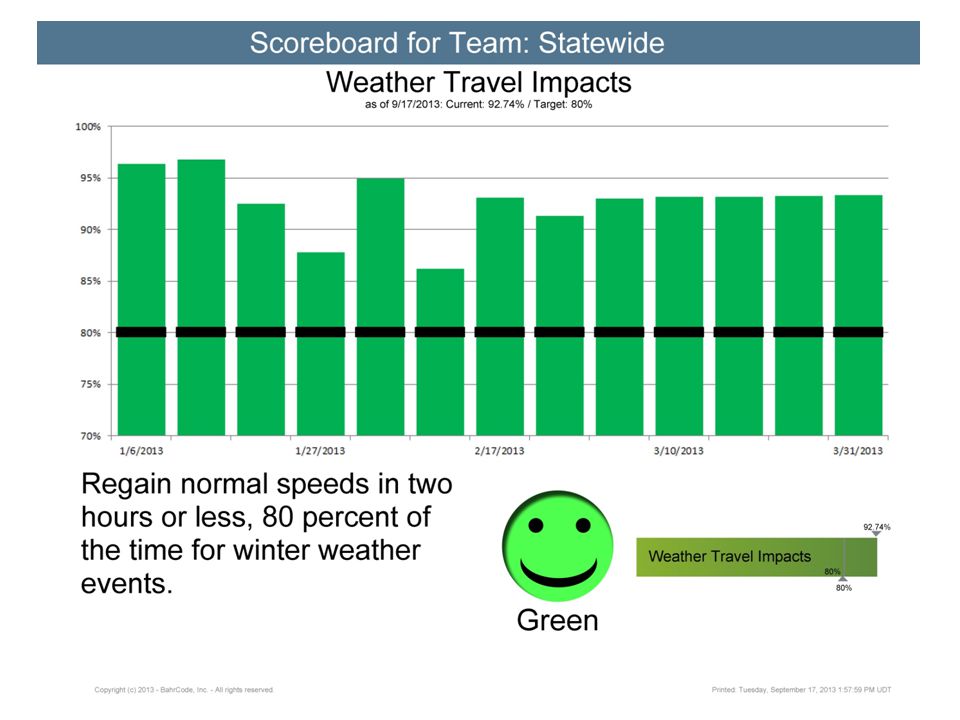
Managing User Delay Cost Winter Weather sub-goal: Regain normal speeds in 2 hours or less 80% of time Lead Measure 1: Perform After Storm Huddles 80% of the time Lead Measure 2: Compliance with Salting Policies 80% of the time TIM sub-goal: Limit the number of traffic incidents closing 1+ lanes lasting longer than 2 hours to 203 Lead Measure 1: Perform Post Incident Reviews 75% of the time Work Zone sub-goal: Limit Non-Recurring Construction UDC to $80.3M Lead Measure 1: Perform WZ Reviews 80% of the time Lead Measure 2: Compare Predicted vs. actual Capacity & Diversion Rates Goal: Limit 2013 User Delay Cost to $304.4 Million by 12/31/13

11
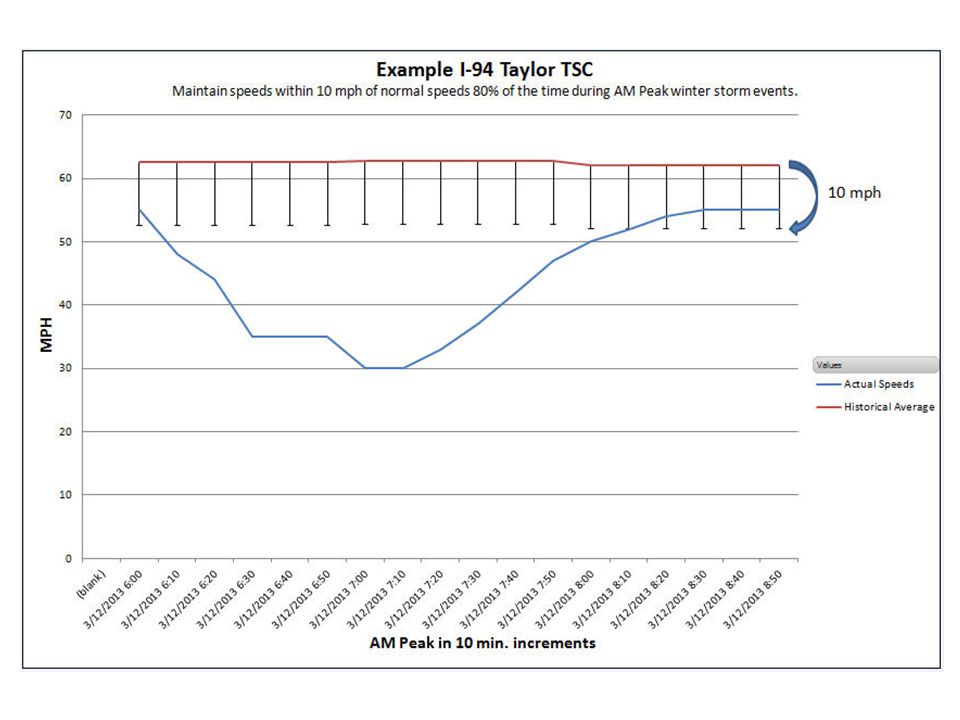
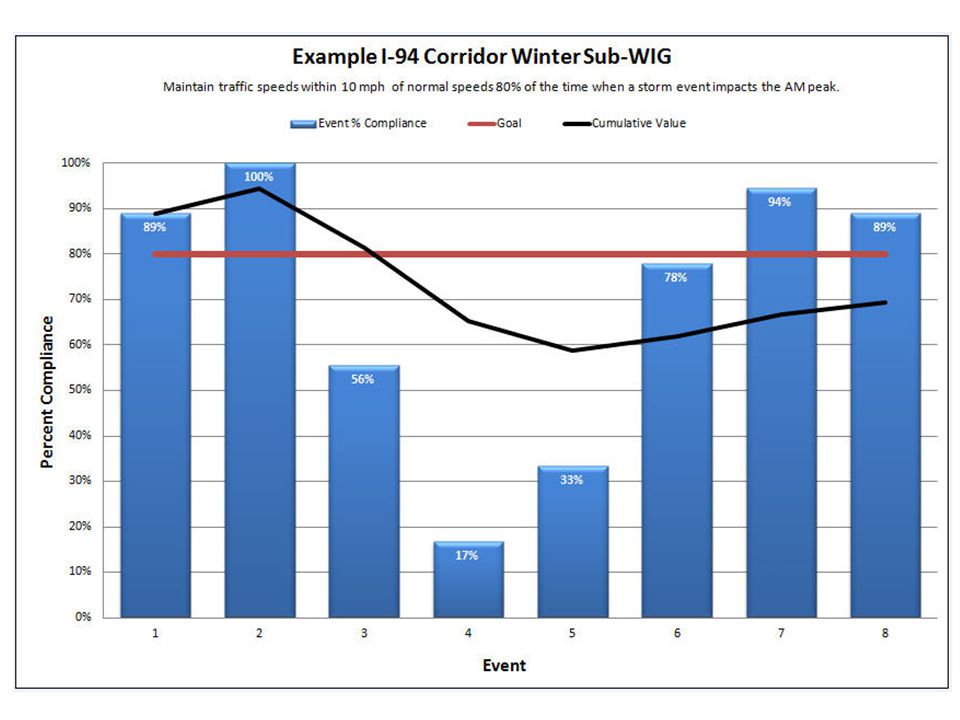
Continuous Improvement Previous goal – Regain normal speeds in two hours or less, 80% of the time for winter weather events Proposed goal – Maintain traffic speeds within 10 mph of normal speeds 80% of the time when a storm event impacts the AM peak (6am - 9am) % Speeds within 10 mph LocationAll DayAM Peak (6-9)PM Peak (3-7)6am-6pm Grand Region74%45%67%68% US-127(Isabella Co.)91%82%100%89% I-94(Jackson TSC)79%75%80% I-94(Taylor TSC)51%41%65%58% I-94(Marshall TSC)68%73%57%74%
 % Speeds within 10 mph LocationAll DayAM Peak (6-9)PM Peak (3-7)6am-6pm Grand Region74%45%67%68% US-127(Isabella Co.)91%82%100%89% I-94(Jackson TSC)79%75%80% I-94(Taylor TSC)51%41%65%58% I-94(Marshall TSC)68%73%57%74%")
12
Managing User Delay Costs Winter Weather sub-goal: Maintain traffic speed w/in 10 mph of normal speeds 80% of time (6am-9am) Lead Measure 1: Perform After Storm Huddles 80% of the time Lead Measure 2: Compliance with Salting Policies 80% of the time Traffic Incident Mgt sub-goal: Limit the number of traffic incidents closing 1+ lanes lasting longer than 2 hours to 203 Lead Measure 1: Perform Post Incident Reviews 75% of the time Work Zone sub-goal: Limit Non-Recurring Construction UDC to $80.3M Lead Measure 1: Perform WZ Reviews 80% of the time Lead Measure 2: Compare Predicted vs. actual Capacity & Diversion Rates Goal: Limit 2014 User Delay Cost to $300 Million by 12/31/14

15
9 - Categories & 32 – Metrics Economic Growth Safety Condition Accountability Mobility Customers Financial Health Environmental Employees www.michigan.gov/mdot “MDOT Performance” “Transportation Scorecard”

16
Mobile Data

17
Vehicle Data Sources SIGNAL DAS or Smart PhoneOBD-KeySurface Monitor Position - GPSX speedX directionX altitudeX distanceX vehicle dynamics (accelerometer)X Roughness (accelerometer - vertical)X photoX VIN X RPMX Throttle PositionX Anti-lock Braking System (ABS) X Traction Control X Barometer X Air temperature X Pavement temperature X Humidity X Dew point X
X Roughness (accelerometer - vertical)X photoX VIN X RPMX Throttle PositionX Anti-lock Braking System (ABS) X Traction Control X Barometer X Air temperature X Pavement temperature X Humidity X Dew point X")
18
Potential Applications Data quality checks (ground truth - RWIS stations, MDSS, third party speed data) Targeted individual messages (augments DMS & website) Provide travel times and incident updates Performance Measure/Management In-the-storm performance (how well are you managing the event) Maintenance Decision Support System Remote imaging and physical monitoring of environment (camera photos) Visibility monitoring (i.e.: snow squalls, localized lake effect white outs, fog, rain, etc.) Slippery surface notification (ABS lockup & differential wheel speed) Pin point icy road conditions (driver & maintenance staff) Early notification to First responders, Hospitals, Work place, Schools, Community events, etc. Regional and cross jurisdictional alerts (Great Lake Regional Transportation Operations Coalition ties into the Northwest Passage and other regional coalitions) Provide in-vehicle alerts Vehicle/device health monitoring (are devices installed on vehicles working?) Vehicle diagnostics (fleet monitoring and management (miles, hours, routine maintenance, etc.)
 Provide in-vehicle alerts Vehicle/device health monitoring (are devices installed on vehicles working ) Vehicle diagnostics (fleet monitoring and management (miles, hours, routine maintenance, etc.).")
19
Lessons Learned Performance Measures w/o Performance Management does not achieve improved system performance Process requires full support from top management. Need automation to help manage the process. Can’t let the process itself overrun other staff daily duties Are we measuring the right things? Choosing the right measure (and wording) takes time Tracking project performance 24-7 maintains staff focus on mobility and improves decision making toward operations Performance Measures - User Delay Cost provides accountability and helps justify Highway Systems Operations for legislators, transportation partners, and the motorists
 takes time Tracking project performance 24-7 maintains staff focus on mobility and improves decision making toward operations Performance Measures - User Delay Cost provides accountability and helps justify Highway Systems Operations for legislators, transportation partners, and the motorists.")
20
THANK YOU!

Similar presentations
 Kevin R. Petty Ph.D. and William P. Mahoney III National Center for.>")

>")


 Installation in South Broward County ATMS.>")


 US Highway 53 and State Highway 73 Minong, Wisconsin Additional information Project Website:>")