Download presentation
Presentation is loading. Please wait.

1
Jessie Joubert, Edgear/JPams Consultant Brenda Joubert, SREB School Improvement Consultant Ralph Thibodeaux, Deputy Director, HS Redesign, LA DOE Dropout Early Warning: Who, What, When, and How

2
Southern Regional Education Board HSTW Dropout Early Warning System ‣ Explore why early detection of problems is key ‣ Resolve how to identify students ‣ Identify who needs help ‣ Discuss when students should receive what assistance

3
Overview of Research Identify students to target ◦ Data in Student Information Systems ◦ Identifying students using data Interventions ◦ Identifying interventions ◦ Planning for interventions to occur

4
Dropouts are much more likely than their peers who graduate to be: Unemployed Living in poverty Receiving public assistance In prison Unhealthy Divorced Single parents with children who drop out from high school themselves The Silent Epidemic John M. Bridgeland, John J. DiIulio, Jr., Karen Burke Morison. March 2006

5
A Growing Prison Population 75 Percent Of State Prison Inmates And 59 Percent Of Federal Inmates Are High-school Dropouts. Increasing Welfare Costs A Limited Labor Supply For An Economy With An Increasing Appetite For Educated Workers For American society, the annual cost of providing for youth who fail to complete high school and their families is $76 billion/year – or approximately $800 for each taxpayer in states and localities across the country One-third of a Nation: Rising Dropout Rates and Declining Opportunities, ETS, February 2006

6
1. 47% Classes not interesting 2. 43% Missed too many days, could not catch up 3. 42% Spent time with people disinterested in school 4. 38% Had too much freedom & not enough rules 5. 35% Was failing in school The Silent Epidemic John M. Bridgeland, John J. DiIulio, Jr., Karen Burke Morison. March 2006

7
69 % said they were not motivated or inspired to work hard, 66% would have worked harder if more was expected of them (higher academic standards and more studying or homework), 37 % said that “failing in school” was a major factor for dropping out; 62 % missed class often the year before dropping out. National Center For Dropout Prevention

8
Grade Level of Dropouts Source: Ed Week: EPE Research Center 2006

9
In hindsight, dropouts are almost universally remorseful for having left school. About ¾ of dropouts indicate they would have remained in school if they could relive the experience. 74% of dropouts would re-enter school if they could attend in alternative settings with age-level peers. SOURCE: The Silent Epidemic, Civic Enterprises, March 2006

10
Research by Louisiana DOE determined ninth grade is the critical year when students drop out, but mental dropping out begins long before physical withdrawal from school.

11
Each 8 th grade course failure increases the odds of non- promotion from 9th to 10th grade by 16% Students who are 15 years of age or older when they enter high school Although 8th-grade test scores are good predictors of students’ likelihood to do well in high school courses, course attendance is eight times more predictive of course failure in the freshman year Education Commission of the States; 2008

12
12 6 th Grade Research Academic Achievement Course failure is a better indicator of not graduating than low test scores. 1. Failing Math (for the year) in 6 th grade 2. Failing English (for the year) in 6 th gradeAttendance When attendance dips below 80% (36 days or more/ year), 75% or more of these students don’t graduate. Balfanz & Mac Iver, Johns Hopkins Herzog, Philadelphia Education Fund
 in 6 th grade 2. Failing English (for the year) in 6 th gradeAttendance When attendance dips below 80% (36 days or more/ year), 75% or more of these students don’t graduate. Balfanz & Mac Iver, Johns Hopkins Herzog, Philadelphia Education Fund.")
13
13 6 th Grade Research Suspensions Only 20% who receive one or more suspensions in 6th grade graduate within a year of on-time graduation. Behavior grades predict half of the school/district’s future nongraduates. Unsatisfactory behavior magnifies the damaging effects of course failure on students’ prospects of graduating! Balfanz, Herzog, & Mac Iver, Johns Hopkins, Philadelphia Education Fund

14
Every grade level should work with students who exhibit at risk behaviors: Absenteeism Low grades Poor discipline Overage

15
Specific Interventions targeted at needs: Absenteeism Low grades Poor discipline Overage

16
You can’t teach an old dog… A penny saved is… Don’t bite the hand that… If at first you don’t succeed… You get out of something only what you… Strike while the… math not much looks dirty get new batteries! see pictured on the box. bug is close

17
Identify Students to Target Automatic Email Notifications Query Of At Risk Students Looking at the Work

18
Reporting system that identifies potential dropouts and brings these students to the attention of school, district, and state personnel.

19
Identifies 8th – 12th grade students who are: Over age by two years Absenteeism ≥ 10% of days enrolled Discipline ≥ 7% of days enrolled Grades ◦ Current GPA drop of 1.5 or more from previous GPA > 2.0 ◦ Current GPA drop of.5 or more from previous GPA ≤ 2.0 ◦ Current GPA ≤ 1.0

20
Automatic Email on the 1 st and 15 th of each month Sent to ◦ School Principal ◦ Assistant Principal ◦ Counselor ◦ District Superintendent Includes ◦ Comprehensive list of students showing at risk information ◦ New students who meet criteria is sent daily

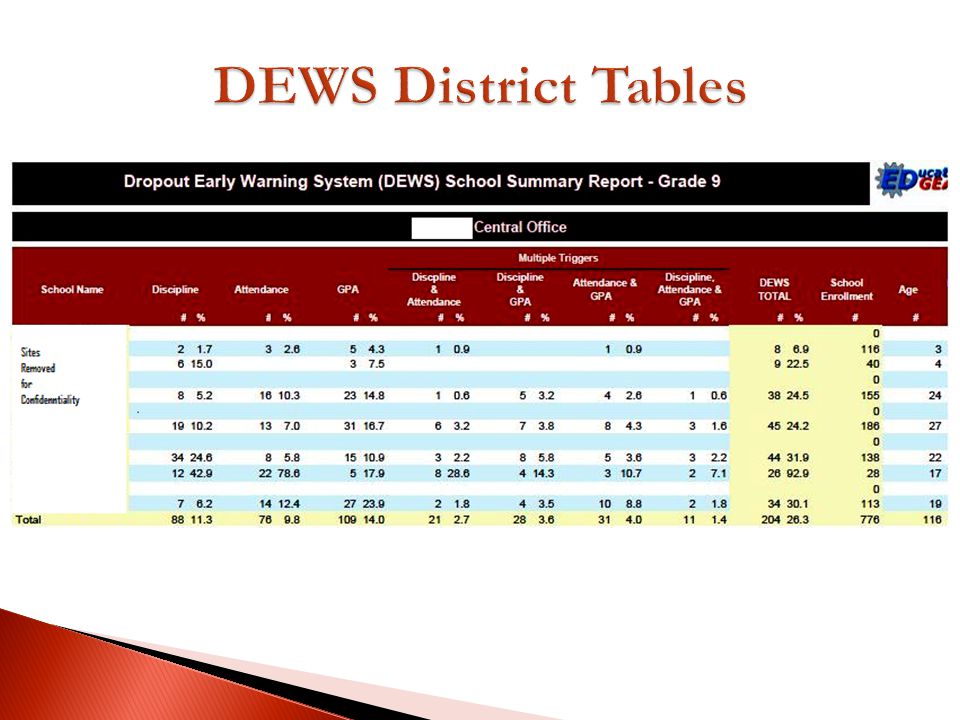
22
Automatic Email on the 1 st and 15 th of each Month Delivered to ◦ School Principals ◦ Assistant Principals ◦ District Superintendent Two Reports ◦ Counts of 9 th graders for each site by at risk indicators ◦ Counts of 8th – 12 th graders for each site by at risk indicators

25
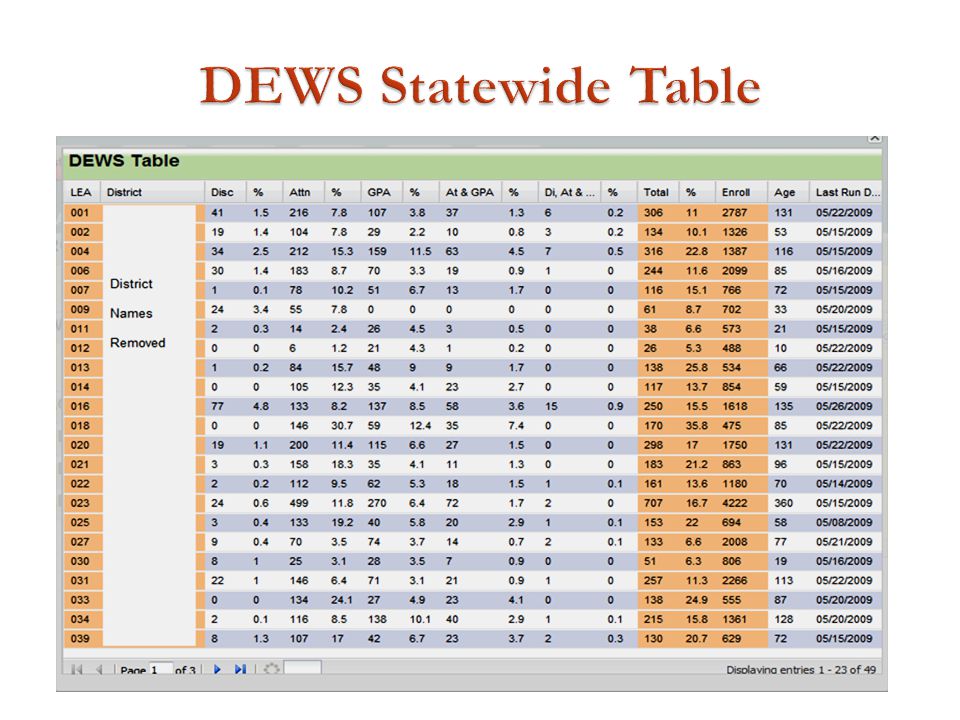
Automatic Email on the 1 st and 15 th of each month Delivered to ◦ LA Dept of Education State Superintendent ◦ Selected DOE Staff Includes ◦ Counts of 8 th –12 th grade students by district by at risk indicators.

27
Report Generation Data in Student Information Systems Identifying At Risk Students Using Data Looking at the Work

28
DEWS automatic emails are broad in nature. To target assistance, more information is needed. Reports On-Demand Investigate student specifics Grades Discipline Attendance Test scores

29
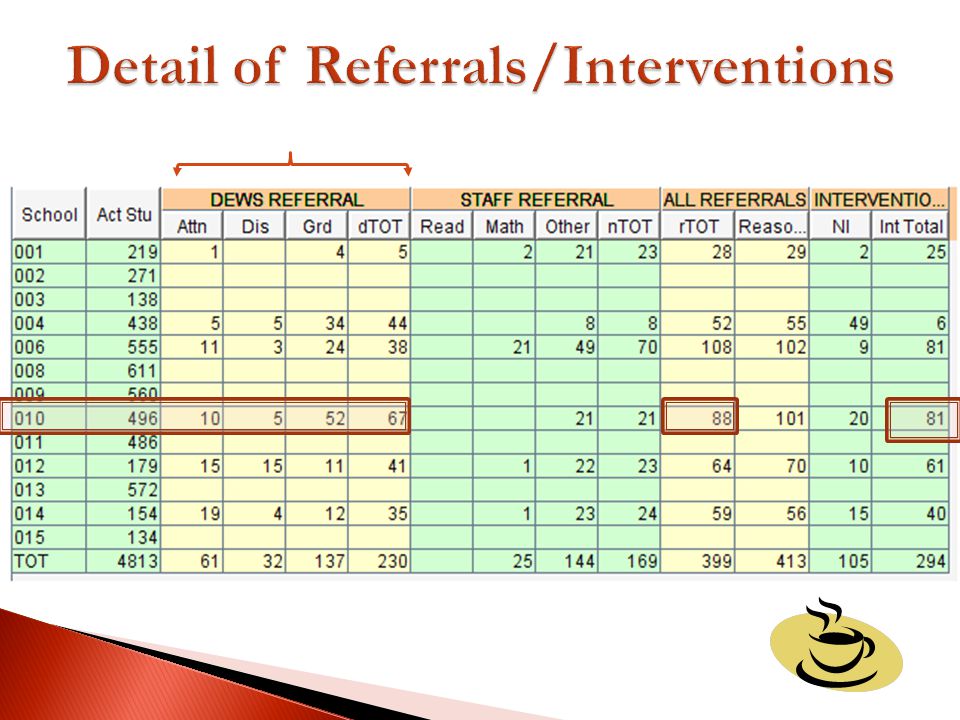
Cell click a count or name to display further detail.

30
Interventions Identifying Effective Interventions Planning For Interventions To Occur Monitoring And Adjusting Interventions Looking at the Work

31
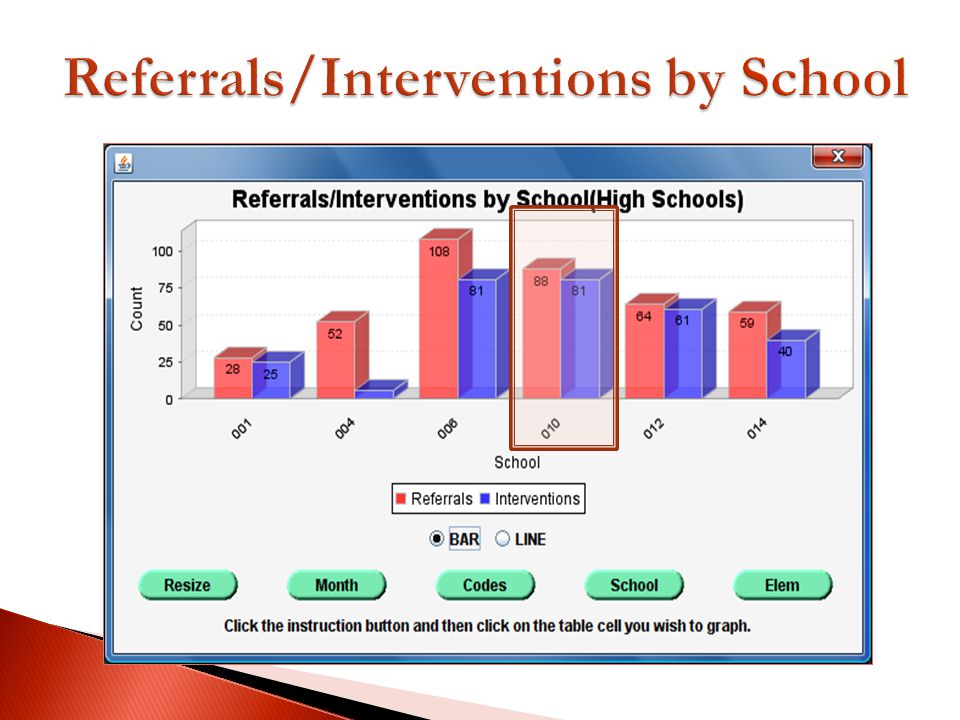
SBLC Student Details Reason for Referral Recommended Interventions SBLC Meetings Minutes SBLC School Trends Report Referrals by Type Interventions

32
Tutorial Services Homework hotline Teacher assistance Peer tutoring program Special class Teaming Ninth-grade teams Regular team meetings Notifying teacher or other professionals Classroom Adjustment Ability grouping Smaller class sizes Freshman-only classes Extended day Credit Recovery Alternative Program Options In school suspensions/expulsions Alternative site Alternative school Parent/Guardian Notification Progress reports Report cards Attendance letter Phone calls Parent Command Center Parent/Guardian Conference Meeting with parents/guardians to discuss intervention actions Judicial Truancy court Pre court conferences TASC Home visits FINS Marine Institute Boot camp Positive Behavior SWPBS DARE Counseling School Based Professional treatment Conference with student Mental health services Verified not at risk Special Services Referral to pupil appraisal Special education referral Behavior plan Mentoring Pairs students with adults and or students Buddy System Natural helpers Other Miscellaneous category

35
Early Warning System and Interventions Rigor-Relevance-Relationships Presenter Ralph Thibodeaux

36
Improve the Graduation Rate Improve GPA Improve Attendance Improve Discipline Improve ILEAP/GEE Scores Rigor-Relevance-Relationships ReDesign Goals

37
SUCCESS IS A JOURNEY… NOT A DESTINATION.

38
History Why an Early Warning System Early Warning Indicators Example of Reports Utilization of the Early Warning System Programs for all Students Interventions for Individual Students Goals of the Early Warning System Objectives Rigor-Relevance-Relationships

39
May 2006 August 2006 October 2006 January 2007 Rigor-Relevance-Relationships

40
228 -52 184 176 Data for the Graduating Class of 2005 This is a 19.3% loss of students. Why do we need an Early Warning System and Interventions? Starting Freshman Graduating Seniors Passed to Sophomore Most of which happened in the first year

41
‣ Discipline for year and/or current term ‣ Attendance for year and/or current term ‣ Grade Point Average ‣ Decline in Grade Point Average Rigor-Relevance-Relationships

43
‣ Principal ‣ Assistant Principals ‣ School Counselors ‣ Freshman Teams ‣ All Grade levels Rigor-Relevance-Relationships

44
‣ Scheduled a Team Meeting ‣ Created a list of all Interventions/Programs/Strategies from the Model Schools Conference plus prior knowledge ‣ Divided into small groups to create each level ‣ Together reached a consensus on all levels Development of the Interventions/Programs/Strategies Rigor-Relevance-Relationships

45
Early Preparation Programs Multi-Level Comprehensive Interventions Celebrate Success High Expectations Interventions/Programs/Strategies Rigor-Relevance-Relationships

46
Freshman Parent Night Progress Report 3 rd Week of each 6 Weeks 1 st Contact Phone Call Advisory Room “Making High School Count” Freshman Orientation Day Spring 8 th Grade Tour Spring 8 th Grade Parent Meeting Spring Letters from 9 th graders to 8 th graders Freshman of the Month Special Renaissance Reward (9 th Ice Cream, etc.) Achievements Posted Honors Contracts Parent Command Center “Capturing Kids’ Hearts” M.B. Flippen “I” Contracts Reteach/Retest Pilot in Math Future Academy Ideas Level 1 Interventions Rigor-Relevance-Relationships

47
Teacher/Student Conference Follow-up Parent Phone Call Voluntary Tutoring Talk to Advisory Room Teacher and Team Teachers Web/Computer Review and Skills Development Level 2 Interventions Rigor-Relevance-Relationships

48
Parent Teacher Conference Signing of Planners Nightly Parent Letters Sent Home Mid-term “Possible Failure” Letter Level 3 Interventions Rigor-Relevance-Relationships

49
Mandatory After-School Tutoring “Wildcat Conductor” Counselor Watch Jr./Sr. Mentor / E-Mentors Parent Calls and Letters Peer Teacher Observation Team Parent Conference Level 4 Interventions Rigor-Relevance-Relationships

50
Parent/Counselor/Administration Conference FINS Recommendation 504/SPED Recommendation Review Academic Options and Programs Level 5 Interventions Rigor-Relevance-Relationships

51
Level 1 Level 4 Level 3 Level 2 Level 5 The Final Product Rigor-Relevance-Relationships Early Warning System

52
Collect data from previous graduation classes Determine indicators for different types of schools Generate Early Warning Program reports by applying the previous year’s statistics to current students The Future?? Rigor-Relevance-Relationships

53
Willard R. Daggett Ed.D Rigor-Relevance-Relationships “Good is the Enemy of Great.”

54
Take This Home Looking at the Work

55
Research John Hopkins University Research The Silent Epidemic National Center for Educational Statistics Longitudinal local and state student data ◦ Attendance ◦ Discipline ◦ Test scores ◦ Graduation ratesPlan Use data to guide reports ◦ Louisiana research guides JPams DEWS and other SIS Reports ◦ Your state research can guide what items are also on the “list” Determine methods of intervention based on student needs

56
Brenda Joubert brenda.joubert@sreb.orgbrenda.joubert@sreb.org Jessie Joubertjjoubert2@gmail.comjjoubert2@gmail.com Ralph Thibodeauxralph.thibodeaux@ldoe.comralph.thibodeaux@ldoe.com

57
“Almost one million students who start ninth grade each year will not earn a diploma four years later - one of every four students. For African American and Latino students, it’s closer to one in three.” Graduation Matters: Improving Accountability for High School Graduation, by Daria Hall

58
Southern Regional Education Board HSTW Aim For Success for All Students

59
Southern Regional Education Board HSTW Resources Balfanz & Mac Iver, Johns Hopkins University; Herzog, Philadelphia Education Fund EdGear, LLC, Shreveport, Louisiana Education Commission of the States; 2008 Graduation Matters: Improving Accountability for High School Graduation, Daria Hall, 2006 National Center For Dropout Prevention One-third of a Nation: Rising Dropout Rates and Declining Opportunities, ETS, February 2006 The Silent Epidemic, Bridgeland, DiIulio, Morison, March 2006 The Silent Epidemic, John M. Bridgeland, John J. DiIulio, Jr., Karen Burke Morison. March 2006 59

60
Jessie Joubert jjoubert2@gmail.com Jessie Joubert, Edgear/Jpams Consultant, jjoubert2@gmail.com jjoubert2@gmail.com Brenda Joubert brenda.joubert@sreb.org Brenda Joubert, SREB School Improvement Consultant, brenda.joubert@sreb.org brenda.joubert@sreb.org Ralph Thibodeaux, Ralph Thibodeaux, Deputy Director, HS Redesign, LA DOE Bryan Staton Bryan Staton, A. Principal, St. Martinville Junior High, Louisiana Dropout Early Warning: Who, What, When, and How

Similar presentations


 Program, CARE Youth Project Escondido Union School.>")


 Public Schools Donald Labossiere.>")


