Download presentation
Presentation is loading. Please wait.

1
MCA II 2008-09

2
08/09 Demographics StateDistrict Number of Students823,234787 Ethnicity24%5% LEP8%0 Special Education13%16% Free & Reduced33%42% Attendance Rate95% Graduation Rate92%100%

3
ACGC DISTRICT

4
North Elementary

5
ACGC 5 th & 6th

6
ACGC SOUTH ACGC South Elementary

7
ACGC SECONDARY

8
ACGC ALP

9
DISCUSSION What are the hurdles in achieving higher tests scores? How can we over come these hurdles?

10
Achievement Analysis Green Green = GREAT: meets expectations Red Red = URGENT: in need of immediate action Analyze - Sort the Data to Examine Patterns (Stoplight Approach)
")
11
D Does not meet the standard P Partially meets the standard M Meets the standard E Exceeds the standard Alphabet Soup! What do the letters mean?

12
Let’s take a look at reading…

13
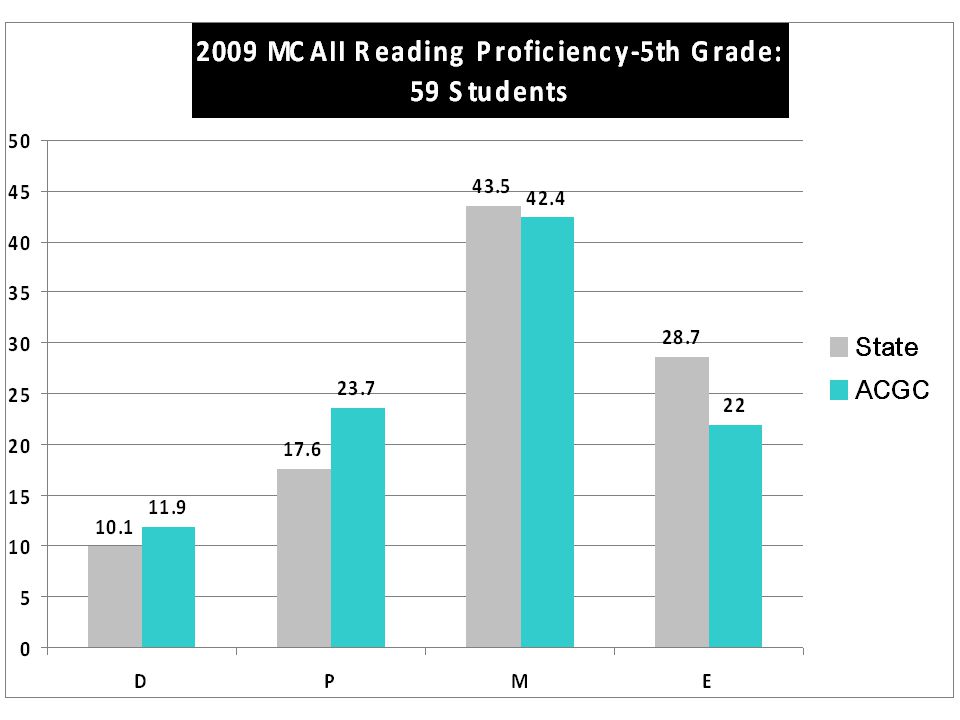
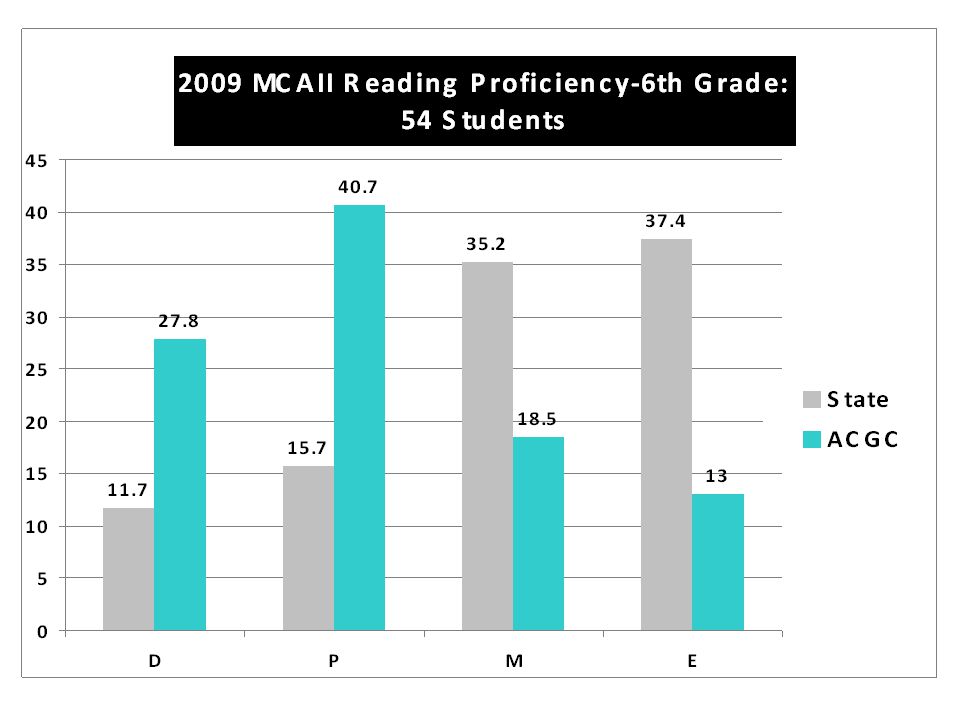
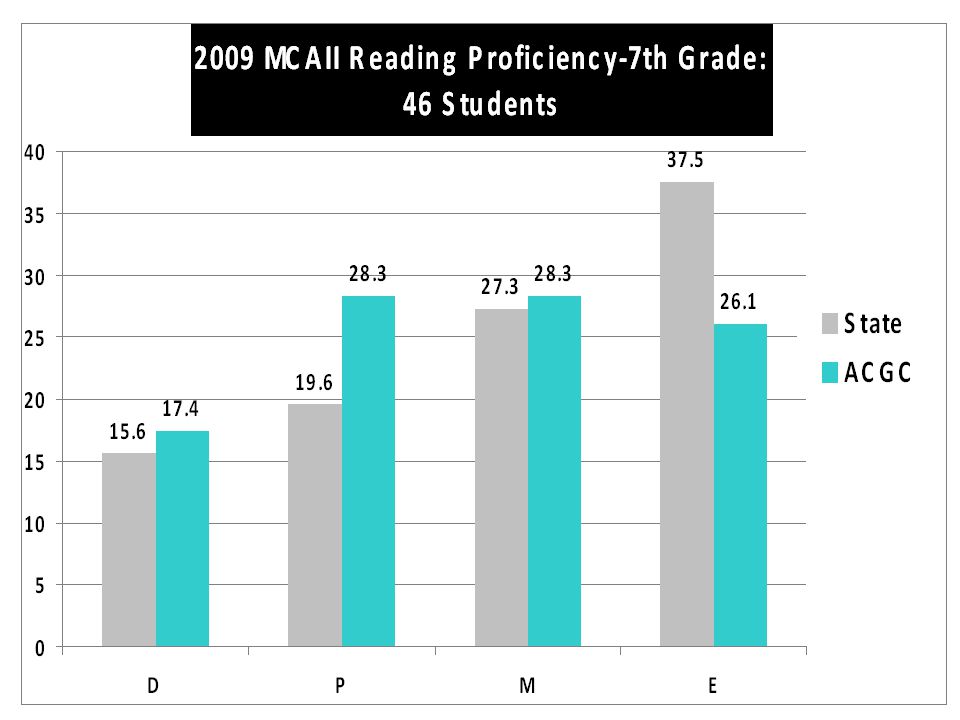
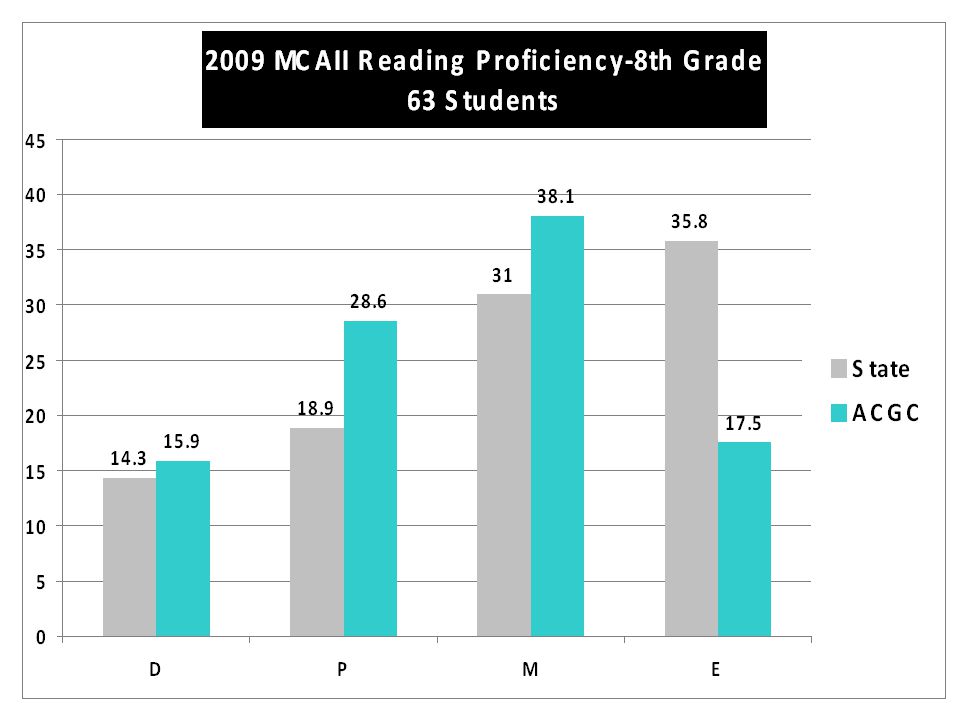
MCAII 2009 READING - Achievement Levels D State / ACGC P State / ACGC M State / ACGC E State / ACGC 3 rd 11.2 / N 13.6 S 7.7 10.5 / N 6.8 S 7.7 27.9 / N 31.8 S 38.5 50.5 / N 47.7 S 46.2 4 th 10.9 / N 8.3 S 9.1 14.6 / N 27.8 S 9.1 36.5 / N 36.1 S 27.3 38.0 / N 27.8 S 54.5 5 th 10.1 / 11.917.6 / 23.743.5 / 42.428.7 / 22.0 6 th 11.7 / 16.415.7 / 34.535.2 / 29.137.4 / 20.0 7 th 15.6 / 17.419.6 / 28.327.3 / 28.337.5 / 26.1 8 th 14.3 / 15.918.9 / 28.631.0 / 38.135.8 / 17.5 10 th 9.2 / 6.116.6 / 15.234.5 / 37.939.7 / 40.9 Green = area of strength Black = average Red = area of concern

14
% of students scoring in the Exceeds Standards on MCAII Grade State 2008ACGC 2008State 2009ACGC 2009 3 rd 52.05%38.9850.5% D 47.4 N 47.7 S 46.2 4 th 38.70%28.3038.0% D 37.9 N 27.8 S 54.5 5 th 33.61%16.3328.7%22.0 6 th 37.41%16.3937.4%20.0 7 th 36.72%25.0037.5%26.1 8 th 34.87%23.8135.8%17.5 10 th 36.08%16.3939.7%40.9 READINGREADING

15
% of students scoring in the Does Not Meets & Partially Meets on the MCAII Grade State 2008ACGC 2008State 2009ACGC 2009 3 rd 21.02%40.6821.7% D 19.3 N 20.4 S 15.4 4 th 27.77%30.1925.5% D 29.3 N 36.1 S 18.2 5 th 26.57%46.9327.7%35.6 6 th 30.38%45.8927.4%50.9 7 th 35.31%48.4435.2%45.7 8 th 34.28%50.7933.2%44.5 10 th 29.31%45.9025.8%21.3 READINGREADING

16
Grade 2007-08 State 2007-08 ACGC 2008-09 State 2008-09 ACGC 3 rd North59%75% 3 rd South68%81% 4 th North66%62% 4 th South78%72% 5 th Grade66%58%69%66% 6 th Grade71%68%73%65% 7 th Grade75%72% 67% 8 th Grade64%60%65%59% 10 th Grade71%73%74%76% NONFICTION COMPARISON 72% 68% 66% 77%

17
CONSTRUCTED RESPONSE COMPARISON Grade 2007-08 State 2007-08 ACGC 2008-09 State 2008-09 ACGC 3 rd North32%73% 3 rd South48%81% 4 th North37%52% 4 th South63%61% 5 th Grade51%45%71%48% 6 th Grade50%46%54%44% 7 th Grade52%47%53%40% 8 th Grade45%38%45%36% 10 th Grade60%65%68%72% 47% 52% READINGREADING 77% 52%

18
Green Green = GREAT: meets expectations Red Red = URGENT: in need of immediate action Sub Score Analysis Analyze - Sort the Data to Examine Patterns (Stoplight Approach)
")
19
N: 44 Students S: 13 Students

20
N: 36 Students S: 22 Students

21
MCAII 2009 3rd Grade Reading: South Elementary Sub-strand Pts Possible State/South All State/South White State/South FRP State/South SPE Vocabulary 7 5.6 / 5.7 5.9 / 5.7 5.0 / 5.1 4.4 / 4.8 Comprehension 15 11.0 / 11.2 11.6 / 11.2 9.6 / 10.0 8.4 / 9.0 Literature 22 17.2 / 18.2 18.0 / 18.2 15.4 / 17.0 13.5 / 15.0 MCAII 2009 4th Grade Reading: South Elementary Sub-strand Pts Possible State/South All State/South White State/South FRP State/South SPE Vocabulary 6 4.9 / 5.0 5.1 / 5.0 4.4 / 5.6 3.9 / 4.2 Comprehension 18 12.8 / 14.2 13.5 / 14.1 11.0 / 16.1 9.9 / 12.0 Literature 22 15.3 / 15.8 16.0 / 16.0 13.4 / 17.1 11.9 / 10.8

22
MCAII 2009 3rd Grade Reading: North Elementary Sub-strand Pts Possible State/North All State/North White State/North FRP State/North SPE Vocabulary 7 5.6 / 5.6 5.9 / 5.6 5.0 / 5.4 4.4 / 2.4 Comprehension 13 11.0 / 10.9 11.6 / 10.9 9.6 / 10.7 8.4 / 5.0 Literature 22 17.2 / 16.6 18.0 / 16.8 15.4 / 16.4 13.5 / 9.2 MCAII 2009 4th Grade Reading: North Elementary Sub-strand Pts Possible State/North All State/North White State/North FRP State/North SPE Vocabulary 6 4.9 / 4.6 5.1 / 4.7 4.4 / 4.9 3.9 / 2.6 Comprehension 18 12.8 / 12.4 13.5 / 12.5 11.0 / 13.3 9.9 / 8.8 Literature 22 15.3 / 14.6 16.0 / 14.8 13.4 / 15.1 11.9 / 8.8

25
MCAII 2009 5th Grade Reading Sub-strand Pts Possible State/ACGC All State/ACGC White State/ACGC FRP State/ACGC SPE Vocabulary 6 4.9 / 4.6 5.2 / 4.6 4.4 / 4.3 3.8 / 3.3 Comprehension 23 15.6 / 14.4 16.4 / 14.4 13.4 / 13.3 11.6 / 10.8 Literature 20 14.9 / 14.6 15.5 / 14.6 13.5 / 13.4 11.9 / 11.6 MCAII 2009 6th Grade Reading Sub-strand Pts Possible State/ACGC All State/ACGC White State/ACGC FRP State/ACGC SPE Vocabulary 7 5.6 / 5.1 5.9 / 5.0 5.0 / 5.0 4.4 / 2.6 Comprehension 25 18.3 / 16.4 19.0 / 16.3 16.0 / 15.7 13.6 / 11.0 Literature 22 15.1 / 13.9 15.7 / 13.7 13.5 / 12.8 11.5 / 9.5

28
MCAII 2009 7th Grade Reading Sub-strand Pts Possible State/ACGC All State/ACG White State/ACGC FRP State/ACG SPE Vocabulary 6 4.3 / 4.1 4.6 / 4.1 3.8 / 4.3 3.3 / 2.3 Comprehension 26 18.8 / 18.0 19.5 / 18.0 16.7 / 17.6 14.4 / 11.8 Literature 25 16.6 / 14.6 17.3 / 14.5 14.3 / 13.7 11.9 / 11.7 MCAII 2009 8th Grade Reading Sub-strand Pts Possible State/ACGC All State/ACGC White State/ACGC FRP State/ACGC SPE Vocabulary 6 4.3 / 4.1 4.5 / 4.1 3.7 / 3.8 3.2 / 2.8 Comprehension 33 22.1 / 20.7 23.0 / 20.7 19.2 / 19.9 15.9 / 13.0 Literature 18 11.8 / 11.0 12.3 / 11.0 9.9 / 10.0 8.0 / 5.7

30
MCAII 2009 10th Grade Reading Sub-strand Pts Possible State/ACGC All State/ACGC White State/ACGC FRP State/ACGC SPE State/ACGC ELL Vocabulary 9 6.5 / 6.4 6.8 / 6.5 5.6 / 6.1 5.0 / 4.7 4.2 / 3.0 Comprehension 33 24.4 / 25.1 25.4 / 25.4 21.3 / 23.5 18.2 / 17.3 17.9 / 11.0 Literature 18 13.0 / 13.3 13.5 / 13.7 11.2 / 12.4 9.6 / 8.2 9.0 / 5.0

31
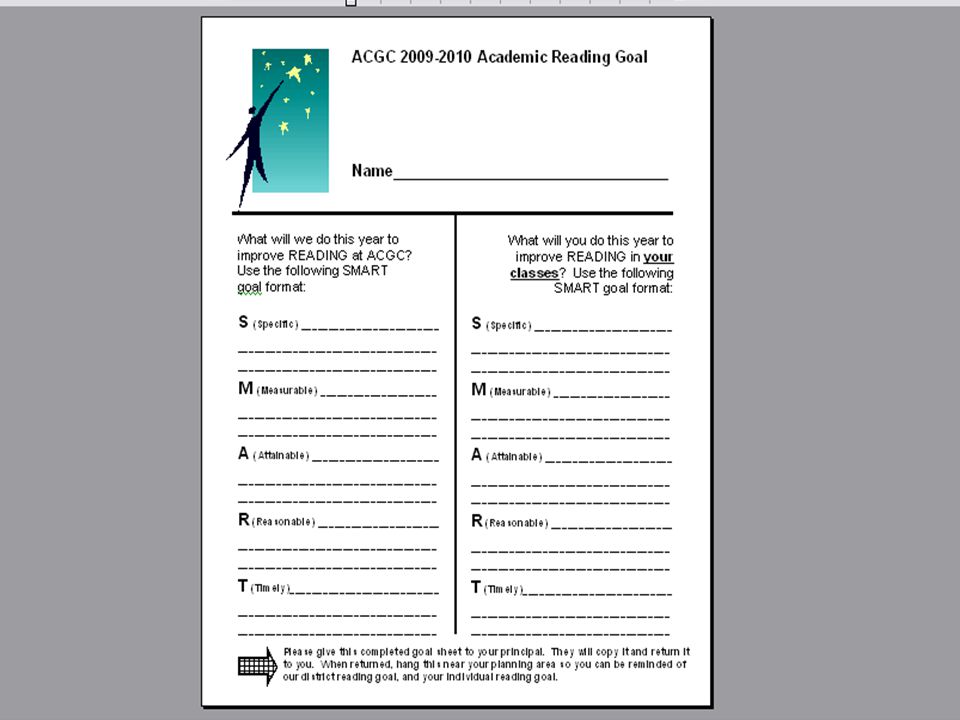
ACGC 2009-2010 Reading Goal ?

32
DISCUSSION What will we do this year to improve READING at ACGC? Visit with your colleagues and determine a SMART Goal in reading for ACGC. SMARTSMART Specific _____________________________ Measurable __________________________ Attainable ___________________________ Reasonable _________________________ Timely _____________________________

33
INDIVIDUAL GOAL What will you do this year to improve READING in your classes? Reflect and determine a SMART Goal in reading for your class or classes. SMARTSMART Specific _____________________________ Measurable __________________________ Attainable ___________________________ Reasonable _________________________ Timely _____________________________

35
Let’s take a look at math…

36
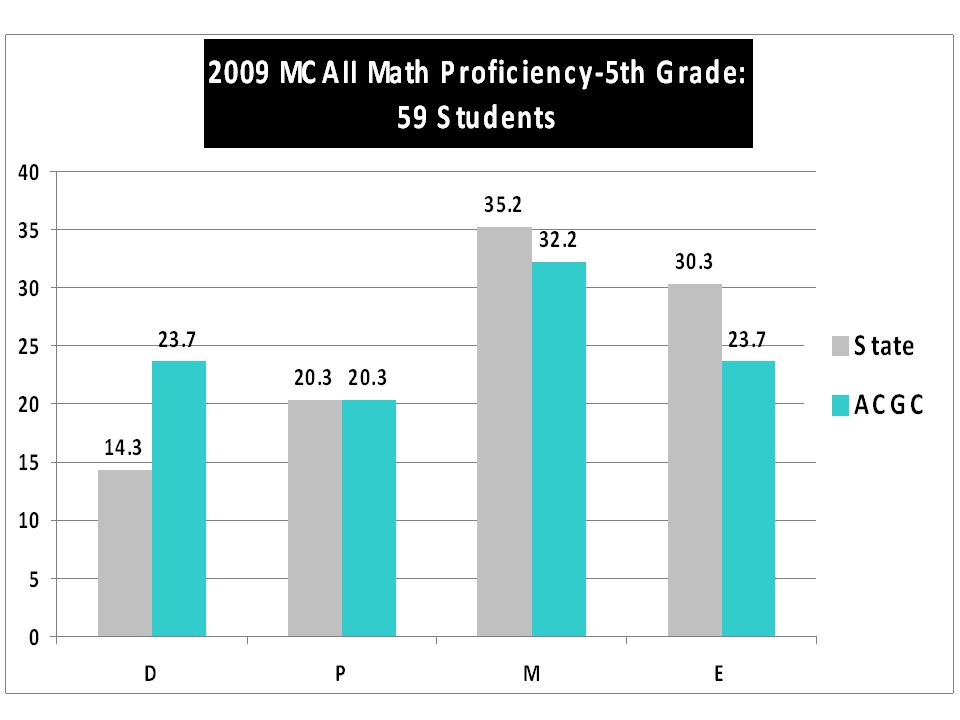
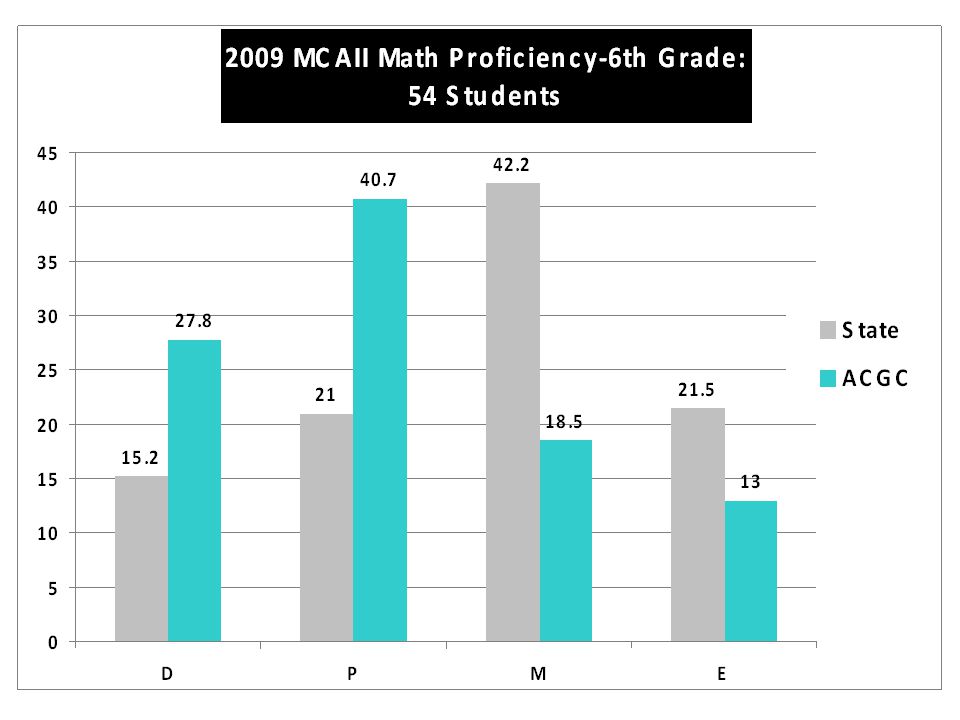
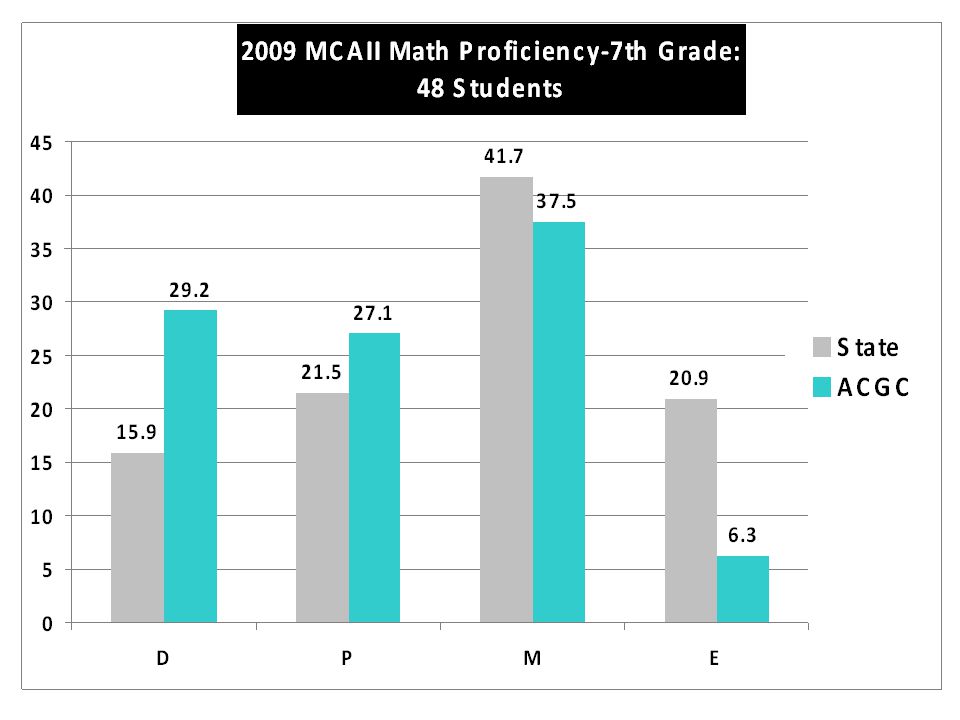
MCAII 2009 MATH - Achievement Levels Green = area of strength Black = average Red = area of concern D State / ACGC P State / ACGC M State / ACGC E State / ACGC 3 rd 4.2 / N 4.5 S 0.0 13.7 / N 20.5 S 0.0 43.9 / N 59.1 S 46.2 38.2 / N 15.9 S 53.8 4 th 8.0 / N 8.3 S 0.0 17.1 / N 33.3 S 18.2 44.6 / N 36.1 S 31.8 30.2 / N 22.2 S 50.0 5 th 14.3 / 23.720.3 / 20.335.2 / 32.230.3 / 23.7 6 th 15.2 / 27.821.0 / 40.742.2 / 18.521.5 / 13.0 7 th 15.9 / 29.221.5 / 27.141.7 / 37.520.9 / 6.3 8 th 18.3 / 32.322.0 / 27.438.4 / 30.621.2 / 9.7 11 th 36.4 / 27.822.0 / 27.823.9 / 24.117.7 / 20.4

37
% of students scoring in the Exceeds Standards on MCAII Grade State 2008ACGC 2008State 2009ACGC 2009 3 rd 35.26%22.0338.2% D 24.6 N 15.9 S 53.8 4 th 31.14%32.0830.2% D 32.8 N 22.2 S 50.0 5 th 25.61%4.0030.3%23.7 6 th 20.52%14.7521.5%13.0 7 th 21.36%7.8120.9%6.3 8 th 22.28%4.8021.2%9.7 11 th 13.93%5.8017.7%20.4 MATHMATH

38
% of students scoring in the Does Not Meets & Partially Meets on the MCAII Grade State 2008ACGC 2008State 2009ACGC 2009 3 rd 18.64%45.7617.9% D 19.3 N 25.0 S 0.0 4 th 28.35%55.2925.1% D 32.8 N 41.6 S 18.2 5 th 33.98%55.1034.6%44.0 6 th 35.36%50.8236.2%68.5 7 th 38.61%59.3837.4%56.3 8 th 41.78%58.0640.3%59.7 11 th 65.64%32.0058.4%55.6 MATHMATH

39
N: 44 Students S: 13 Students

40
MCAII 2009 3rd Grade Math: North Elementary Sub-strand Pts Possible State/North All State/North White State/North FRP State/North SPE Number Sense 17 14.2 / 13.7 14.5 / 13.7 13.1 / 13.5 12.3 / 9.8 Patterns, Functions, & Algebra 9 6.3 / 5.8 6.5 / 5.8 5.6 / 5.3 5.2 / 3.6 Data, Stats, & Probability 6 4.3 / 4.2 4.5 / 4.2 3.8 / 4.1 3.5 / 3.2 Spatial Sense, Geometry & Measurement 16 11.0 / 9.4 11.4 / 9.3 9.7 / 8.8 9.1 / 6.8

41
MCAII 2009 3rd Grade Math: South Elementary Sub-strand Pts Possible State/South All State/South White State/South FRP State/South SPE Number Sense 17 14.2 / 15.8 14.5 / 15.8 13.1 / 15.4 12.3 / 14.5 Patterns, Functions, & Algebra 9 6.3 / 7.0 6.5 / 7.0 5.6 / 6.7 5.2 / 6.5 Data, Stats, & Probability 6 4.3 / 5.3 4.5 / 5.3 3.8 / 5.3 3.5 / 5.3 Spatial Sense, Geometry & Measurement 16 11.0 / 11.4 11.4 / 11.4 9.7 / 10.1 9.1 / 9.8

42
N: 36 Students S: 22 Students

43
MCAII 2009 4th Grade Math: North Elementary Sub-strand State/North All State/North White State/North FRP State/North SPE Number Sense 18 14.9 / 14.3 15.3 / 14.7 13.5 / 14.2 12.5 / 10.2 Patterns, Functions, & Algebra 9 6.3 / 5.1 6.6 / 5.3 5.4 / 4.8 4.8 / 2.6 Data, Stats, & Probability 9 6.2 / 5.6 6.5 / 5.9 5.4 / 5.6 5.0 / 4.4 Spatial Sense, Geometry & Measurement 15 9.7 / 8.5 10.0 / 8.7 8.3 / 8.4 7.5 / 5.6

44
MCAII 2009 4th Grade Math: South Elementary Sub-strand State/South All State/South White State/South FRP State/South SPE Number Sense 18 14.9 / 15.6 15.3 / 15.6 13.5 / 16.4 12.5 / 15.2 Patterns, Functions, & Algebra 9 6.3 / 7.0 6.6 / 7.1 5.4 / 7.8 4.8 / 5.6 Data, Stats, & Probability 9 6.2 / 7.4 6.5 / 7.4 5.4 / 8.1 5.0 / 6.8 Spatial Sense, Geometry & Measurement 15 9.7 / 11.3 10.0 / 11.4 8.3 / 11.1 7.5 / 8.4

46
MCAII 2009 5th Grade Math Sub-strand Pts Possible State/District All State/District White State/District FRP State/District SPE Number Sense 16 11.7 / 10.6 12.1 / 10.6 10.1 / 9.9 8.8 / 8.2 Patterns, Functions, & Algebra 10 7.4 / 6.6 7.6 / 6.6 6.6 / 6.2 5.9 / 4.6 Data, Stats, & Probability 13 8.8 / 8.5 9.1 / 8.5 7.6 / 8 6.7 / 6.8 Spatial Sense, Geometry & Measurement 15 10.0 / 9.1 10.4 / 9.1 8.8 / 8.5 7.8 / 7.3

48
MCAII 2009 6th Grade Math Sub-strand Pts Possible State/District All State/District White State/District FRP State/Dist SPE Number Sense 21 14.1 / 12.1 14.6 / 11.7 15.0 / 11.9 10.1 / 7.6 Patterns, Functions, & Algebra 9 5.9 / 4.8 6.1 / 4.8 6.2 / 4.3 4.2 / 3.0 Data, Stats, & Probability 12 7.3 / 6.6 7.6 / 6.5 7.8 / 6.4 5.2 / 3.4 Spatial Sense, Geometry & Measurement 17 12.0 / 10.7 12.4 / 10.6 12.7 / 9.8 9.0 / 5.8

50
MCAII 2009 7th Grade Math Sub-strand Pts Possible State/District All State/District White State/District FRP State/Dist SPE Number Sense 21 10.8 / 8.7 11.3 / 8.6 11.6 / 7.9 7.1 / 5.1 Patterns, Functions, & Algebra 9 7.5 / 6.4 7.9 / 6.3 8.1 / 5.9 4.8 / 3.5 Data, Stats, & Probability 12 7.1 / 6.0 7.5 / 5.9 7.7 / 5.4 4.4 / 3.1 Spatial Sense, Geometry & Measurement 17 11.3 / 9.1 11.7 / 9.0 12.0 / 8.3 8.1 / 6.4

52
MCAII 2009 8th Grade Math Sub-strand Pts Possible State/District All State/District White State/District FRP State/Dist SPE Number Sense 15 8.9 / 7.2 9.3 / 7.3 7.2 / 6.3 5.8 / 4.6 Patterns, Functions, & Algebra 17 11.4 / 10.0 11.9 / 10.1 9.5 / 9.8 7.5 / 6.8 Data, Stats, & Probability 12 8.1 / 7.0 8.4 / 7.1 6.9 / 6.7 5.3 / 3.9 Spatial Sense, Geometry & Measurement 16 10.1 / 9.0 10.6 / 9.1 8.4 / 8.3 6.9 / 5.6

54
MCAII 2009 11th Grade Math Sub-strand Pts Possible State/District All State/District White State/District FRP State/Dist SPE Patterns, Functions, & Algebra 24 13.6 / 14.6 14.3 / 14.6 10.8 / 14.4 8.0 / 8.8 Data, Stats, & Probability 21 12.0 / 13.3 12.8 / 13.3 9.4 / 13.2 7.1 / 5.5 Spatial Sense, Geometry & Measurement 20 10.8 / 10.9 11.4 / 10.9 8.4 / 10.6 6.3 / 4.3

55
ACGC 2009-2010 Math Goal ?

56
DISCUSSION What will you do this year to improve MATH at ACGC this year? Visit with your colleagues and determine a SMART Goal in math for ACGC. SMARTSMART Specific _____________________________ Measurable __________________________ Attainable ___________________________ Reasonable _________________________ Timely _____________________________

57
INDIVIDUAL GOAL What will you do this year to improve MATH in your classes? Reflect and determine a SMART Goal in math for your class or classes. SMARTSMART Specific _____________________________ Measurable __________________________ Attainable ___________________________ Reasonable _________________________ Timely _____________________________

60
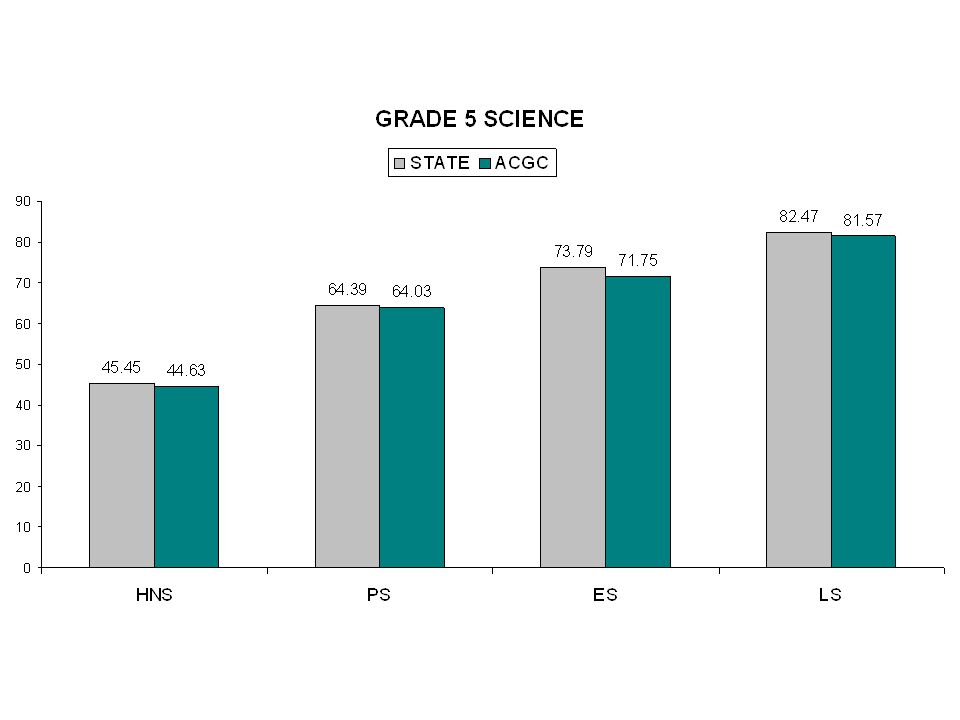
GRADE 5 SCIENCE (3-4-5)
")
62
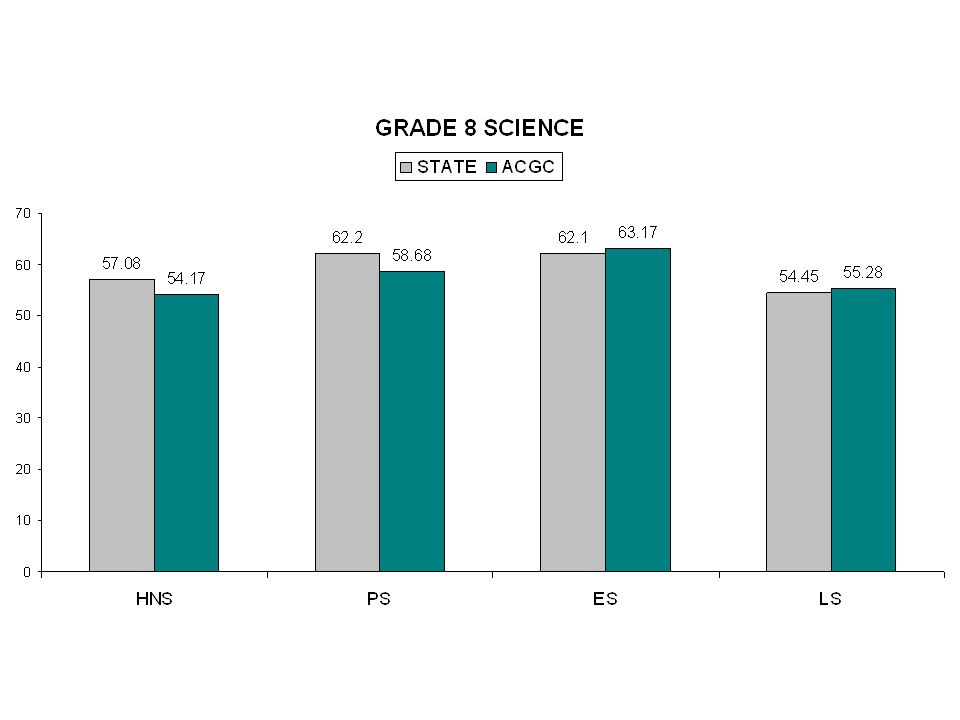
GRADE 8 SCIENCE (6-7-8)
")
64
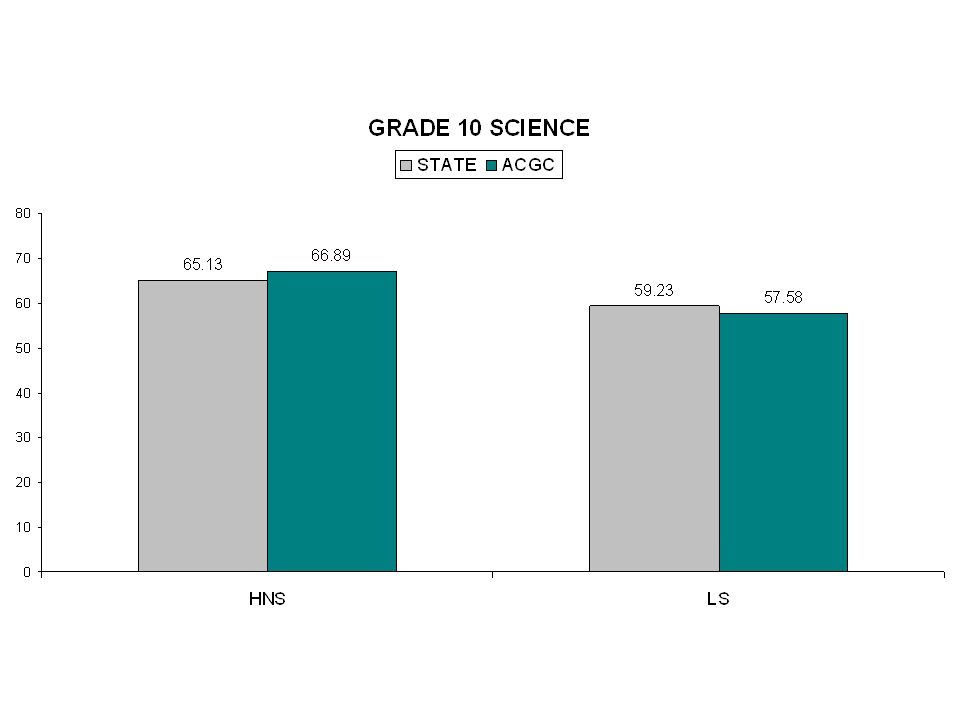
GRADE 10 SCIENCE (<=10)
")
66
ACGC 2009-2010 Science Goal ?

67
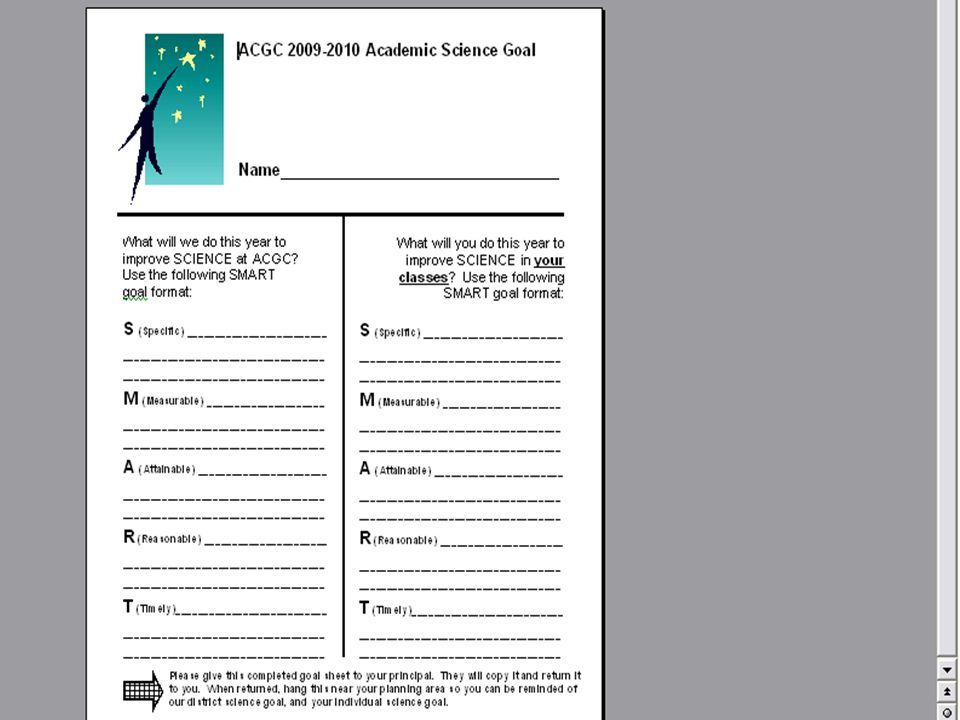
DISCUSSION What will you do this year to improve SCIENCE at ACGC this year? Visit with your colleagues and determine a SMART Goal in science for ACGC. SMARTSMART Specific _____________________________ Measurable __________________________ Attainable ___________________________ Reasonable _________________________ Timely _____________________________

68
INDIVIDUAL GOAL What will you do this year to improve SCIENCE in your classes? Reflect and determine a SMART Goal in science for your class or classes. SMARTSMART Specific _____________________________ Measurable __________________________ Attainable ___________________________ Reasonable _________________________ Timely _____________________________

70
WE ARE ALL IN THIS TOGETHER! WE CAN ACCOMPLISH GREAT THINGS IF WE ARE SCOOPERS AND NOT POINTERS! SO, LET’S SCOOP TOGETHER!

71
How close are we to making AYP? How do we identify students to insure AYP?

72
LEVEL JUMPERS

73
There are four levels: D oes Not Meet Standards P artially Meets Standards ~ G40 M eets Standards and ~ G50 E xceeds Standards How does a student earn district points? D = 0 P =.5M = 1E = 1

74
LEVEL JUMPERS Who is most capable of jumping? Students within 3 scale points from G40 and G50!

Similar presentations


 and the Connecticut Academic Achievement Test (CAPT) Spring 2011 Presented to the Guilford Board of Education September.>")

