Download presentation
Presentation is loading. Please wait.

1
Campylobacter Risk Assessment in Poultry Helle Sommer, Bjarke Christensen, Hanne Rosenquist, Niels Nielsen and Birgit Nørrung

2
P r e v a l e n s C o n c e n t r a t i o n SLAUGHTERHOUSERETAILCONSUMERRISK P farmh. C a.bleeding Probability of Infection Probability of Exposure

3
Data examinations – distributions Process model building – explicit equations Explicit equations/ simulations Cross contamination What-if-simulations Slaughter house modules

4
Data examinations Data for 3 different purposes - prevalence distribution -> slaughterhouse program - concentration distribution - model building, before and after a process From mean values to a distribution Lognormal/ normal –> illustrations Same or different distributions –> variance analysis

5
From mean values to a distribution 17 log mean values from different flocks and from 2 different studies

6
From mean values to a distribution 17 distributions -> one common distribution

7
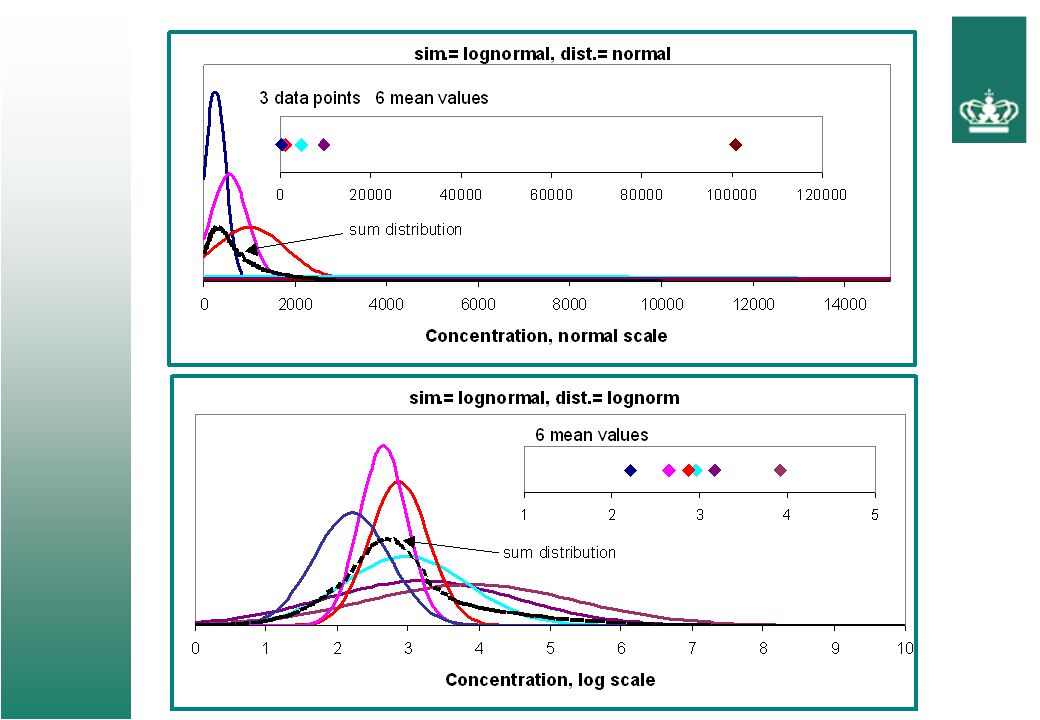
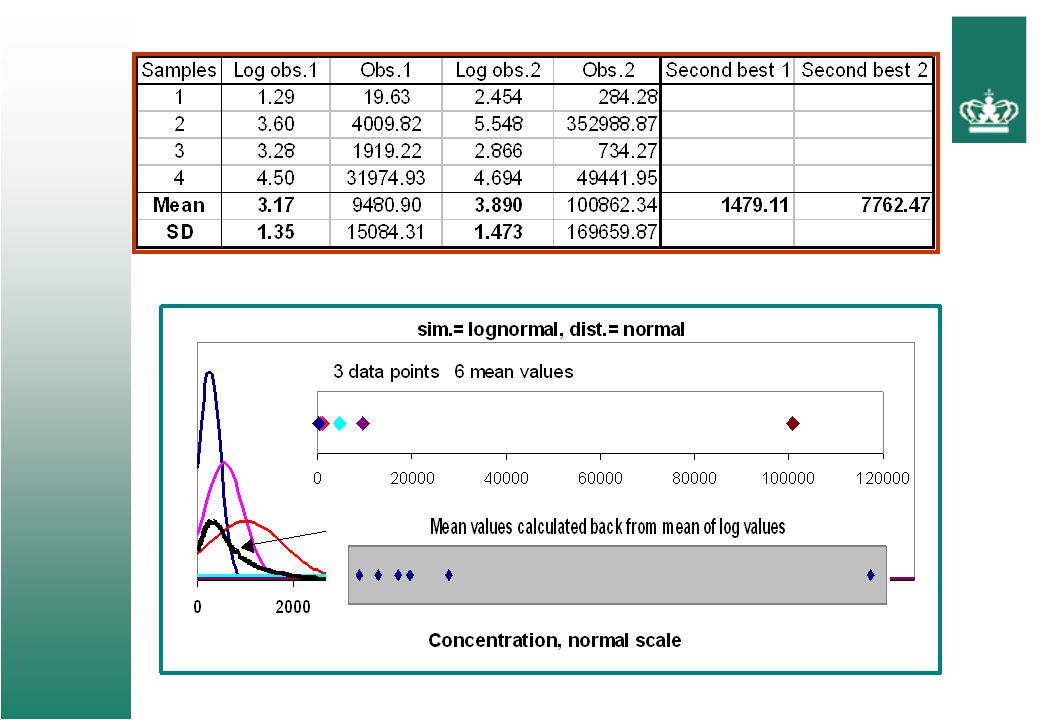
Log-normal or normal distribution ? ”True” data structure = simulated data (sim.=) Assumed distribution (dist.=) Published data = means of 4 samples,6 means from one study sim.= lognormal(6.9,2.3) dist.= normal or lognormal
 Assumed distribution (dist.=) Published data = means of 4 samples,6 means from one study sim.= lognormal(6.9,2.3) dist.= normal or lognormal.")
11
Real data set Normal scale

12
New Danish data

13
Slaughterhouse process Building mathematical models

14
Why new mathematical process models ?

15
Explicit mathematical process model

16
In normal scale μ y = μ x / Δ μ 100 = 10000 / 100 In log scale μ logy = μ logx – Δ μ 2 = 4 - 2

17
Explicit mathematical process model In normal scale μ y = μ x / Δ μ 100 = 10000 / 100 In log scale μ y = μ x – Δ μ 2 = 4 - 2 σ y 2 = β 2 · σ x 2 Transformation line y = + β·x

18
Explicit mathematical process model Overall model μ y = μ x - Δμ σ y 2 = β 2 · σ x 2 Local model Y = + β·x Calculation of = (1-β)· μ x - Δμ
· μ x - Δμ")
19
Explicit mathematical process model In normal scale μ y / μ x = 158 In log scale μ y = μ x - 2.2

20
Explicit mathematical process model In normal scale y = x + z z Є N (μ, σ)
")
21
Summing up Explicit equations for modelling slaughterhouse processes + Monte Carlo simulations, modelling each chicken with a given status of infection, concentration level, order in slaughtering, etc. New data of concentration (input distribution) -> different or same distribution ? (mean and shape) Data + knowledge/logical assumptions of the process -> multiplicativ or additive process
 -> different or same distribution . (mean and shape) Data + knowledge/logical assumptions of the process -> multiplicativ or additive process.")
22
Advantage with explicit equations Accounts for homogenization within flocks More information along the slaughter line does not give rise to more uncertainty on the output distribution. Faster than simulations/Bootstrap/Jackknifing

Similar presentations


 of representative samples or strength parameters or slope.>")

>")


