Download presentation
Presentation is loading. Please wait.

1
Decision analysis and Risk Management course in Kuopio
Sensitivity analysis Marko Tainio Decision analysis and Risk Management course in Kuopio

2
Sensitivity analysis studies on what happens inside the Black Box
(the model) Results Data
 Results. Data.")
3
Outline of lecture What is sensitivity analysis?
Why to use sensitivity analysis What options there are? Example of two sensitivity analysis methods Nominal Range Sensitivity Rank-order Correlation Other sensitivity analysis methods

4
What is sensitivity analysis

5
Definition of sensitivity analysis
Sensitivity analysis (SA) is the study of how the variation (uncertainty) in the output of a mathematical model can be apportioned, qualitatively or quantitatively, to different sources of variation in the input of the model. Put another way, it is a technique for systematically changing parameters in a model to determine the effects of such changes.
 is the study of how the variation (uncertainty) in the output of a mathematical model can be apportioned, qualitatively or quantitatively, to different sources of variation in the input of the model. Put another way, it is a technique for systematically changing parameters in a model to determine the effects of such changes.")
6
Main idea of SA In sensitivity analysis you change the input parameters to see how the model results response to these changes Thus, sensitivity analysis resembles laboratory research where you control input and measure the outcome Same statistical methods are applied in laboratory studies and in sensitivity studies (correlation, regression analysis, ANOVA)!
!")
7
Different sensitivity analysis methods
Frey and Patil, 2002 divides sensitivity analyses to three broad categories: Mathematical Suitable for deterministic models Statistical (or probabilistic) Usually based on simulation and statistical parameters. Graphical Presenting of sensitivity with graphs, charts etc.
 Usually based on simulation and statistical parameters. Graphical. Presenting of sensitivity with graphs, charts etc.")
8
When to use sensitivity analysis
In simple, always when making risk or decision models! Two main advantages: You can guide your own modeling work by testing the sensitivity of the model while doing the assessment; You can also communicate to possible users the main uncertainties related to assessment

9
Calculation of sensitivity analysis: - Nominal Range Sensitivity - Rank-order Correlation

10
Setting How many square meters of tables we have in this building?
The model is simple: (Number of tables) x (average width) x (average height) = n x w x h Since we don’t know any of these parameters, we assume some distributions for them
 x (average width) x (average height) = n x w x h. Since we don’t know any of these parameters, we assume some distributions for them.")
11
Nominal Range Sensitivity Analysis Method
NRSA is used to evaluate the effect on model outputs of varying only one of the model inputs across its entire range of plausible values, while holding all other inputs at their nominal or base-case values Equation: Page 14, Frey 2

12
NRSA sensitivity analysis
Model is most sensitive to Number of tables parameter.

13
Qualities of NRSA analysis
Advantages: Works with deterministic models (no need for Monte Carlo) Easy to use and apply in number of models Disadvantages: Works only with linear models Doesn’t take into account interactions/correlations between input parameters NRSA is a good screening level sensitivity analysis tool
 Easy to use and apply in number of models. Disadvantages: Works only with linear models. Doesn’t take into account interactions/correlations between input parameters. NRSA is a good screening level sensitivity analysis tool.")
14
Sample and Rank Correlation Coefficients
Number of tables 50 150 300 Height Model (aka. Black Box) Result 0.5 1.0 1.2 104 214 384 Width 1 1.5 2.0
 Result Width")
15
Sample and Rank Correlation Coefficients
Two options for correlation analysis: Parametric or Pearson For linear models Non-parametric or Spearman or rank Also for non-linear models Importance analysis Correlation varies between -1 and 1 The value of -1 represents a perfect negative correlation while a value of +1 represents a perfect positive correlation

16
In Monte Carlo, correlation is calculated between samples

17
Result of the rank-order correlation sensitivity analysis
The uncertainty in the results correlates 80% with the uncertainty of „Number of tables” parameter.

18
Qualities of correlation sensitivity analysis
Advantage: Easy to compute Correlation available in most of the computer modeling tools (including Excel) Disadvantage: Correlation is not causation Non-linear and non-monotonic models are problematic
 Disadvantage: Correlation is not causation. Non-linear and non-monotonic models are problematic.")
19
Other sensitivity analysis methods

20
Research on sensitivity analysis
Frey et al (Evaluation of Selected Sensitivity Analysis Methods Based Upon Applications to Two Food Safety Process Risk Models) lists 11 different sensitivity analysis methods They also made recommendations on which sensitivity analysis to use in which situation Report available:
 lists 11 different sensitivity analysis methods. They also made recommendations on which sensitivity analysis to use in which situation. Report available:")
21
Different sensitivity analysis methods
Mathematical Methods for Sensitivity Analysis Nominal Range Sensitivity Analysis Method Differential Sensitivity Analysis (DSA) Statistical Methods for Sensitivity Analysis Sample and Rank Correlation Coefficients Regression Analysis Rank Regression Analysis of Variance Classification and Regression Tree Sobol’s Indices Fourier Amplitude Sensitivity Test (FAST) Graphical Methods for Sensitivity Analysis Scatter Plots Conditional Sensitivity Analysis
 Statistical Methods for Sensitivity Analysis. Sample and Rank Correlation Coefficients. Regression Analysis. Rank Regression. Analysis of Variance. Classification and Regression Tree. Sobol’s Indices. Fourier Amplitude Sensitivity Test (FAST) Graphical Methods for Sensitivity Analysis. Scatter Plots. Conditional Sensitivity Analysis.")
22
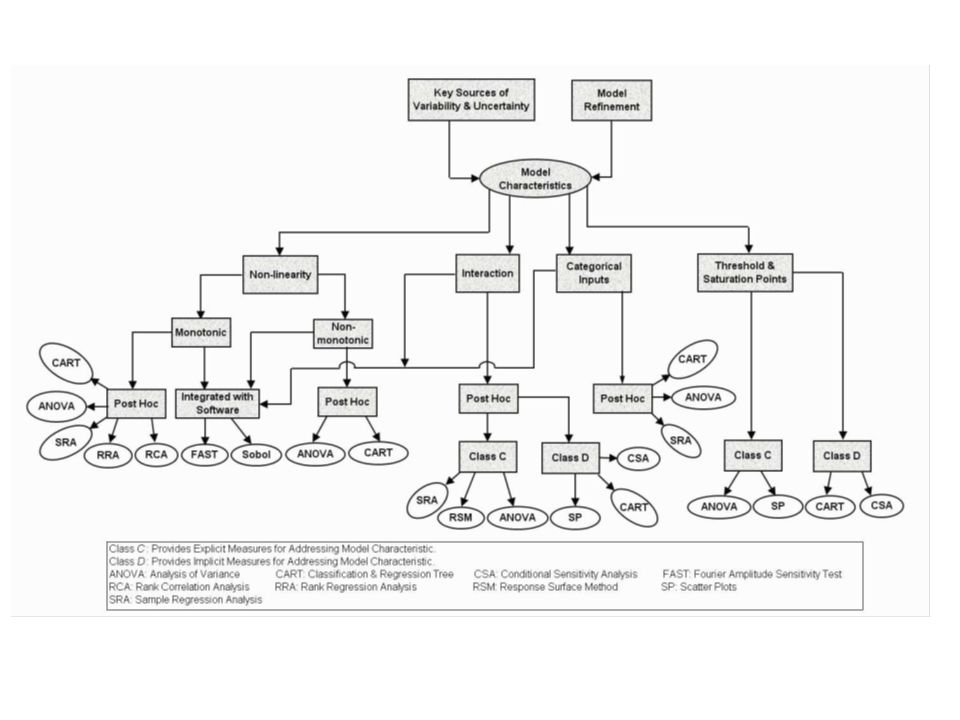
Selection of the sensitivity analysis (Frey et al. 2004)
Some selection criteria's: What are the objectives of sensitivity analysis? Based upon the objectives, what information is needed from sensitivity analysis? What are the characteristics of the model that constrain or indicate preference regarding method selection? How detailed is the analysis? What are the characteristics of the software that may constrain selection of methods? What are the specifications of the computing resources? Can “push-button” methods adequately address characteristics of interest in the analysis? Is the implementation of the selected sensitivity analysis method post-hoc? Frey et al. pages 46-47,

23
Some objectives of sensitivity analysis
Rank ordering the importance of model inputs (e.g., critical control points); Identifying combination of input values that contribute to high exposure and/or risk scenarios; Identifying and prioritizing key sources of variability and uncertainty; Identifying critical limits; Evaluating the validity of the model.
; Identifying combination of input values that contribute to high exposure and/or risk scenarios; Identifying and prioritizing key sources of variability and uncertainty; Identifying critical limits; Evaluating the validity of the model.")
24
What Information is Needed from Sensitivity Analysis?
Qualitative or quantitative ranking of inputs Discrimination of the importance among different inputs Grouping of inputs that are of comparable importance Identification of inputs that are not important Identification of critical limits Identification of inputs and ranges that produce high exposure or risk Identification of trends in the model response

25
Frey et al. Pages 58, http://www.ce.ncsu.edu/risk/Phase3Final.pdf

27
Further reading Frey et al Recommended Practice Regarding Selection, Application, and Interpretation of Sensitivity Analysis Methods Applied to Food Safety Process Risk Models: Frey et al Evaluation of Selected Sensitivity Analysis Methods Based Upon Applications to Two Food Safety Process Risk Models: Patil and Frey Comparison of sensitivity analysis methods based on applications to a food safety risk assessment model. Risk Analysis 24 (3):
:")
Similar presentations