Download presentation
Presentation is loading. Please wait.

1
Water Use and Resources in Arizona – Part 1 Role Playing Project

2
Water Project Game Plan: Part 1 What is the Hydrologic Cycle? Where does our water come from? Which governmental agencies bring us our water How much to we overdraft our water resources

3
Hydrologic Cycle

4
Hydrologic Cycle – Groundwater

5
Hydrologic Cycle - AZ Major Water Sheds – Mogollon Highlands, Colorado Rockies, Wind River Mountains, and Utah Highlands Major Rivers – Colorado River, Salt River, and Verde River

6
Hydrologic Cycle - AZ Mogollon Rim Rocky Mountains Wind River Mountains Boulder Mountain

7
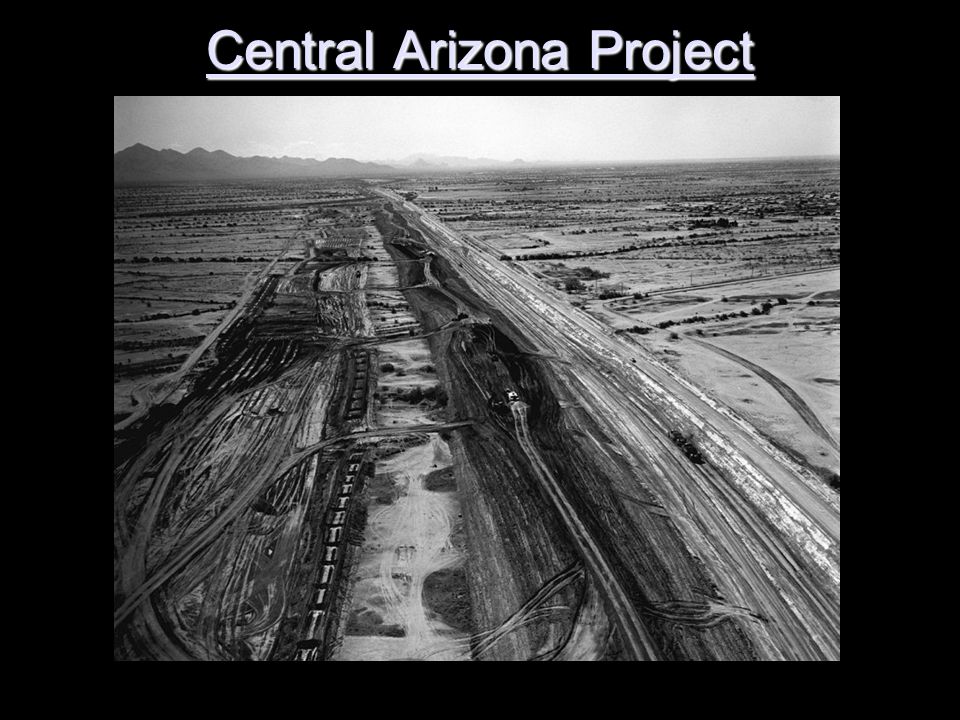
Central Arizona Project Transports water from the Colorado River (Lake Havasu) to Maricopa, Pima, and Pinal Counties (Phoenix and Tucson) Supplies up to 2.8 million acre- feet of water deemed Arizona’s share from the Colorado River Compact [1 acre-foot equates to the amount of water needed for a family of five annually] Lifts the water 2,900 vertical feet along the way through 14 pumping stations Run by 15 member elected board 22,500 gallons of water per second
![Central Arizona Project Transports water from the Colorado River (Lake Havasu) to Maricopa, Pima, and Pinal Counties (Phoenix and Tucson) Supplies up to 2.8 million acre- feet of water deemed Arizona’s share from the Colorado River Compact [1 acre-foot equates to the amount of water needed for a family of five annually] Lifts the water 2,900 vertical feet along the way through 14 pumping stations Run by 15 member elected board 22,500 gallons of water per second](http://images.slideplayer.com/14/4434853/slides/slide_7.jpg "Central Arizona Project Transports water from the Colorado River (Lake Havasu) to Maricopa, Pima, and Pinal Counties (Phoenix and Tucson) Supplies up to 2.8 million acre- feet of water deemed Arizona’s share from the Colorado River Compact [1 acre-foot equates to the amount of water needed for a family of five annually] Lifts the water 2,900 vertical feet along the way through 14 pumping stations Run by 15 member elected board 22,500 gallons of water per second")
8
Central Arizona Project

13
Salt River Project Supplies water to Phoenix through canal locations used over 2,000 years ago by the Hohokam people, largest in the world without surveying equipment Two sides: 1) electricity operated by the state 2) a corporation that delivers over 1 million acre feet of water SRP forged by early Phoenicians who pledged their homes and farms as collateral for a federal loan to construct Roosevelt Dam on the Salt River between 1906 – 1911 Later placed more dams along the Salt (3) and along the Verde River (3) Water from 13,000 square mile watershed (Mogollon Rim) and from 250 pumping stations of groundwater In normal years groundwater contributes roughly 25% of SRP’s water, dry years as much as 65%. Wells used to be drilled 500 feet deep, now 1,200 feet. Annual deficit of ~82 billion gallons WHY BUILD DAMS???

14
Salt River Project Roosevelt Dam on the Salt River!

15
Salt River Project Roosevelt Dam Construction on the Salt River!

16
Salt River Project Horse Mesa Dam on the Salt River!

17
Salt River Project Bartlett Dam on the Verde River for Irrigation Diversion!

18
Salt River Project Stewart Mountain Dam on the Salt River for Irrigation Diversion!

19
Salt River Project Drilling of an SRP well (250) that utilizes groundwater to augment surface flow water!
 that utilizes groundwater to augment surface flow water!")
20
Total water brought to Phoenix, AZ Called the “Phoenix Active Management Area” – controlled by the Arizona Department of Water Resources Goal to achieve sustainable water resources by 2025 5,646 square miles in area Uses 2.3 million acre feet annually 1.4 million acre-feet from renewable sources 900,000 acre-feet from groundwater Overdraft of renewable sources of 251,000 acre- feet (even though some excess CAP water in the winter is recharged back into the ground through infiltration fields [termed water banking] and through natural processes)
![Total water brought to Phoenix, AZ Called the Phoenix Active Management Area – controlled by the Arizona Department of Water Resources Goal to achieve sustainable water resources by ,646 square miles in area Uses 2.3 million acre feet annually 1.4 million acre-feet from renewable sources 900,000 acre-feet from groundwater Overdraft of renewable sources of 251,000 acre- feet (even though some excess CAP water in the winter is recharged back into the ground through infiltration fields [termed water banking] and through natural processes)](http://images.slideplayer.com/14/4434853/slides/slide_20.jpg "Total water brought to Phoenix, AZ Called the Phoenix Active Management Area – controlled by the Arizona Department of Water Resources Goal to achieve sustainable water resources by ,646 square miles in area Uses 2.3 million acre feet annually 1.4 million acre-feet from renewable sources 900,000 acre-feet from groundwater Overdraft of renewable sources of 251,000 acre- feet (even though some excess CAP water in the winter is recharged back into the ground through infiltration fields [termed water banking] and through natural processes)")
21
Water Banking Authority

22
Water Project Lab 1 This is a homework assignment Go to the following link: http://watersim.asu.edu http://watersim.asu.edu Utilize the Water Sim model for the city of Phoenix to complete the lab and return to class in ONE week

23
Things to Know: Basics of the Hydrologic Cycle major watersheds PhoenixWhat are the major watersheds that supply water to Phoenix? Groundwater and surface flow from Colorado, Slat and Verde Rivers supply water to Phoenix What are the two Agencies that supply water to Phoenix?

Similar presentations


 how modification in one place (e.g., canals, dams, farming techniques, industrialization)>")


