Download presentation
Presentation is loading. Please wait.

1
MTBI Mathematical and Theoretical Biology Institute

2
Modeling Influenza Epidemics and Related Issues Carlos Castillo-Chavez Department of Biological Statistics and Computational Biology Department of Theoretical and Applied Mechanics Current Collaborators (Direct or Indirect) Miriam Nuno, Cornell University Zhilan Feng, Purdue University Maia Martcheva, Polytechnic University Laura Jones, Cornell University
 Miriam Nuno, Cornell University Zhilan Feng, Purdue University Maia Martcheva, Polytechnic University Laura Jones, Cornell University")
3
Influenza virus Picture

4
Historical Overview History suggests that influenza pandemics have probably happened during at least the last four centuries. During the 20th century, three pandemics and several "pandemic scares" occurred. 1918: Spanish Flu The Spanish Influenza pandemic is the catastrophe against which all modern pandemics are measured. It is estimated that approximately 20 to 40 percent of the worldwide population became ill and that over 20 million people died. Between September 1918 and April 1919, approximately 500,000 deaths from the flu occurred in the U.S. alone. Many people died from this very quickly. Some people who felt well in the morning became sick by noon, and were dead by nightfall. Those who did not succumb to the disease within the first few days often died of complications from the flu (such as pneumonia) caused by bacteria. One of the most unusual aspects of the Spanish flu was its ability to kill young adults. The reasons for this remain uncertain. With the Spanish flu, mortality rates were high among healthy adults as well as the usual high-risk groups. The attack rate and mortality was highest among adults 20 to 50 years old. The severity of that virus has not been seen again.
 caused by bacteria. One of the most unusual aspects of the Spanish flu was its ability to kill young adults. The reasons for this remain uncertain. With the Spanish flu, mortality rates were high among healthy adults as well as the usual high-risk groups. The attack rate and mortality was highest among adults 20 to 50 years old. The severity of that virus has not been seen again..")
5
Historical Overview (Taken from Web Site) History suggests that influenza pandemics have probably happened during at least the last four centuries. 20th century pandemics and "pandemic scares." 1918: Spanish Flu It is estimated that approximately 20 to 40 percent of the worldwide population became ill and that over 20 million people died. Between September 1918 and April 1919, approximately 500,000 deaths from the flu occurred in the U.S. alone. Some people who felt well in the morning became sick by noon, and were dead by nightfall. Those who did not succumb to the disease within the first few days often died of complications from the flu (such as pneumonia) caused by bacteria. With the Spanish flu, mortality rates were high among healthy adults as well as the usual high-risk groups. The attack rate and mortality was highest among adults 20 to 50 years old. The severity of that virus has not been seen again.
 caused by bacteria. With the Spanish flu, mortality rates were high among healthy adults as well as the usual high-risk groups. The attack rate and mortality was highest among adults 20 to 50 years old. The severity of that virus has not been seen again..")
6
1957: Asian Flu In February 1957, the Asian influenza pandemic was first identified in the Far East. Immunity to this strain was rare in people less than 65 years of age, and a pandemic was predicted. The 1957 pandemic virus was quickly identified, due to advances in scientific technology. Vaccine was available in limited supply by August 1957. The virus came to the U.S. quietly, with a series of small outbreaks over the summer of 1957. When U.S. children went back to school in the fall, they spread the disease in classrooms and brought it home to their families. Infection rates were highest among school children, young adults, and pregnant women in October 1957. Most influenza-and pneumonia-related deaths occurred between September 1957 and March 1958. The elderly had the highest rates of death. During January and February 1958, there was another wave of illness among the elderly. This is an example of the potential "second wave" of infections that can develop during a pandemic. The disease infects one group of people first, infections appear to decrease and then infections increase in a different part of the population. Although the Asian flu pandemic was not as devastating as the Spanish flu, about 69,800 people in the U.S. died.

7
1968: Hong Kong Flu In early 1968, the Hong Kong influenza pandemic was first detected in Hong Kong. The first cases in the U.S. were detected as early as September of that year, but illness did not become widespread in the U.S. until December. Deaths from this virus peaked in December 1968 and January 1969. Those over the age of 65 were most likely to die. The same virus returned in 1970 and 1972. The number of deaths between September 1968 and March 1969 for this pandemic was 33,800, making it the mildest pandemic in the 20th century.

8
1976: Swine Flu Scare When a novel virus was first identified at Fort Dix, it was labeled the "killer flu." Experts were extremely concerned because the virus was thought to be related to the Spanish flu virus of 1918. The concern that a major pandemic could sweep across the world led to a mass vaccination campaign in the United States. In fact, the virus--later named "swine flu"--never moved outside the Fort Dix area. Research on the virus later showed that if it had spread, it would probably have been much less deadly than the Spanish flu.

9
1977: Russian Flu Scare In May 1977, influenza A/H1N1 viruses isolated in northern China, spread rapidly, and caused epidemic disease in children and young adults (< 23 years) worldwide. The 1977 virus was similar to other A/H1N1 viruses that had circulated prior to 1957. (In 1957, the A/H1N1 virus was replaced by the new A/H2N2 viruses). Because of the timing of the appearance of these viruses, persons born before 1957 were likely to have been exposed to A/H1N1 viruses and to have developed immunity against A/H1N1 viruses. Therefore, when the A/H1N1 reappeared in 1977, many people over the age of 23 had some protection against the virus and it was primarily younger people who became ill from A/H1N1 infections. By January 1978, the virus had spread around the world, including the United States. Because illness occurred primarily in children, this event was not considered a true pandemic. Vaccine containing this virus was not produced in time for the 1977-78 season, but the virus was included in the 1978-79 vaccine.
. Because of the timing of the appearance of these viruses, persons born before 1957 were likely to have been exposed to A/H1N1 viruses and to have developed immunity against A/H1N1 viruses. Therefore, when the A/H1N1 reappeared in 1977, many people over the age of 23 had some protection against the virus and it was primarily younger people who became ill from A/H1N1 infections. By January 1978, the virus had spread around the world, including the United States. Because illness occurred primarily in children, this event was not considered a true pandemic. Vaccine containing this virus was not produced in time for the season, but the virus was included in the vaccine..")
10
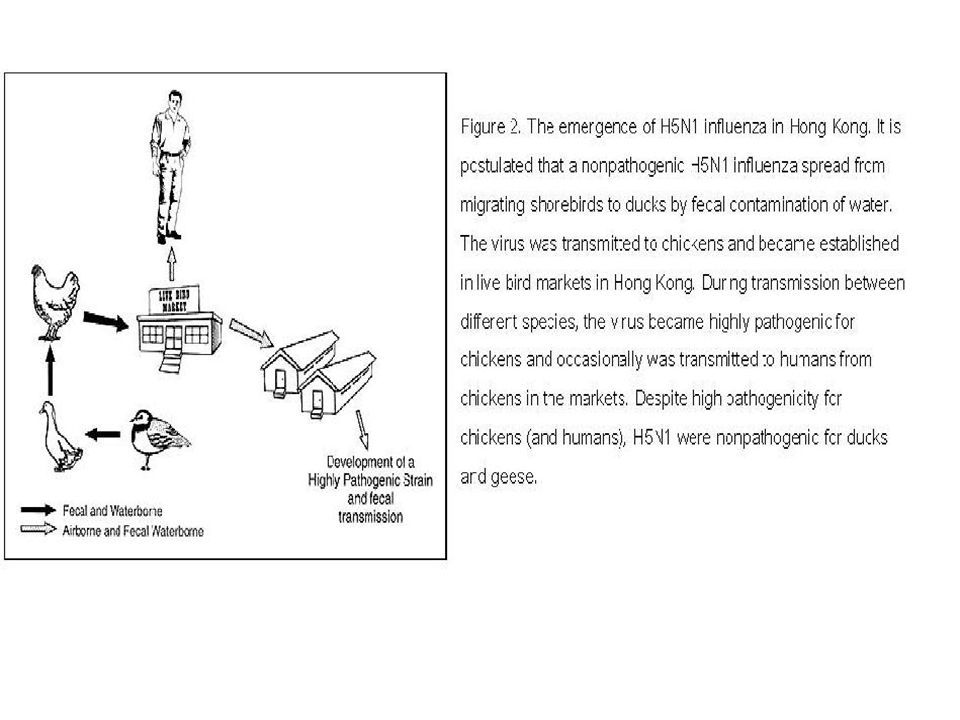
1997: Avian Flu Scare The most recent pandemic "scares" occurred in 1997 and 1999. In 1997, at least a few hundred people became infected with the avian A/H5N1 flu virus in Hong Kong and 18 people were hospitalized. Six of the hospitalized persons died. This virus was different because it moved directly from chickens to people, rather than having been altered by infecting pigs as an intermediate host. In addition, many of the most severe illnesses occurred in young adults similar to illnesses caused by the 1918 Spanish flu virus. To prevent the spread of this virus, all chickens (approximately 1.5 million) in Hong Kong were slaughtered. The avian flu did not easily spread from one person to another, and after the poultry slaughter, no new human infections were found. In 1999, another novel avian flu virus – A/H9N2 – was found that caused illnesses in two children in Hong Kong. Although both of these viruses have not gone on to start pandemics, their continued presence in birds, their ability to infect humans, and the ability of influenza viruses to change and become more transmissible among people is an ongoing concern.
 in Hong Kong were slaughtered. The avian flu did not easily spread from one person to another, and after the poultry slaughter, no new human infections were found. In 1999, another novel avian flu virus – A/H9N2 – was found that caused illnesses in two children in Hong Kong. Although both of these viruses have not gone on to start pandemics, their continued presence in birds, their ability to infect humans, and the ability of influenza viruses to change and become more transmissible among people is an ongoing concern..")
13
Influenza and Cross-Immunity OUTLINE Epidemiology of Influenza Cross-Immunity Two strain models (CHALL) Age structure Results Limitations Example Conclusions Future Work
 Age structure Results Limitations Example Conclusions Future Work")
14
Motivation Researchers have explored the possible mechanism(s) underlying the recurrence of epidemics and persistence of co-circulating virus strains of influenza types between pandemics. It is believed that interactions between human populations with host (animal) populations such as swine, duck, equine may be responsible for the observed epidemic and pandemic outbreaks.
 populations such as swine, duck, equine may be responsible for the observed epidemic and pandemic outbreaks..")
15
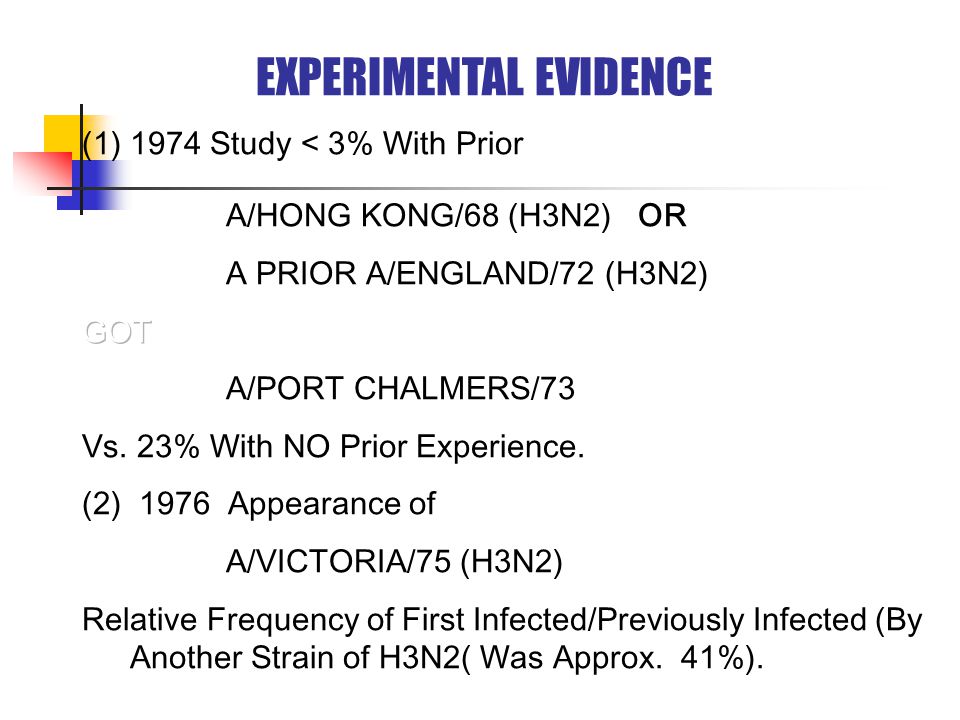
Evidence of Cross-Immunity Study in 1979 shows that only 3% of individuals previously exposed to strain A/Hong Kong/68 or A/England/72 were infected with a similar subtype H3N2, while 23% were infected without a previous exposure. Frequency of detection of antibody-positive sera between 1977 and 1978 changed from 0% to38% for young people. (reappearance of H1N1 subtype). Houston study indicates that no cross-reactive immunity exist between subtypes H1N1 and H3N2.
. Houston study indicates that no cross-reactive immunity exist between subtypes H1N1 and H3N2..")
16
What is Cross-Immunity? There are three subtypes of influenza A: H1N1, H2N2, and H3N2 Infection with an influenza subtype A strain may provide cross protection against other antigenically similar circulating strains.

17
Cross Immunity -coefficient of cross-immunity Relative reduction on susceptibility due to prior exposure to a related strain. =0, represents total cross-immunity =1, represents no cross-immunity 0< <1, represents partial cross-immunity >1, represents immune deficiency

19
EXPERIMENTAL EVIDENCE (3)1977 Co-Circulating H1N2 Strains Individuals bon before 1952 “GOT” a strain of H1N1 DETECTION OF ANTIBODY-POSITIVE SERA YOUNG: Changed From 0% to 9%. OLDER: Did not change (remained at 9%). (4) 1982 (Glezen) No Cross-Immunity Between Subtypes (H1N1 & H3N2)
. (4) 1982 (Glezen) No Cross-Immunity Between Subtypes (H1N1 & H3N2).")
20
Facts Experimental results indicate that Cross-immunity shares the following features (Couch and Kasel, 1983): Exhibits subtype specificity. Exhibits cross-reactivity to variants within a subtype, but with reduced cross-reactivity for variants that are antigenically distant from the initial variant. Exhibits a duration of at least five to eight years. Be able to account for the observation that resistance to reinfection with H1N1 may last 20 years

21
First Approaches In 1975 epidemiological interference of virus populations was introduced [Dietz]. In 1989 age-structure, proportionate mixing and cross- immunity are studied [Castillo-Chavez, et.al]. In 1989 interactions between human and animal host populations are studied as a source of recombinants in strains and cross-immunity.
![First Approaches In 1975 epidemiological interference of virus populations was introduced [Dietz].](http://images.slideplayer.com/14/4413621/slides/slide_21.jpg " In 1989 age-structure, proportionate mixing and cross- immunity are studied [Castillo-Chavez, et.al]. In 1989 interactions between human and animal host populations are studied as a source of recombinants in strains and cross-immunity..")
22
Models with age structure

23
SIR Model with Age Structure s(t,a) : Density of susceptible individuals with age a at time t. i(t,a) : Density of infectious individuals with age a at time t. r(t,a) : Density of recovered individuals with age a at time t. # of recovered individuals with ages in (a 1, a 2 ) at time t # of infectious individuals with ages in (a 1, a 2 ) at time t # of susceptible individuals with ages in (a 1, a 2 ) at time t
 : Density of infectious individuals with age a at time t. r(t,a) : Density of recovered individuals with age a at time t. # of recovered individuals with ages in (a 1, a 2 ) at time t # of infectious individuals with ages in (a 1, a 2 ) at time t # of susceptible individuals with ages in (a 1, a 2 ) at time t.")
24
: recruitment/birth rate. (a): age-specific probability of becoming infected. c(a): age-specific per-capita contact rate. (a): age-specific per-capita mortality rate. (a): age-specific per-capita recovery rate. Parameters
: age-specific per-capita contact rate. (a): age-specific per-capita mortality rate. (a): age-specific per-capita recovery rate. Parameters.")
25
Equations

26
Initial and Boundary Conditions

27
n(t,a) satisfies the Mackendrick Equation We assume that the total population density has reached this demographic steady state. Demographic Steady State n(t,a): density of individual with age a at time t
: density of individual with age a at time t.")
28
1. p(t,a,a`) 0 2. 3. Proportionate mixing: Mixing Rules
 Proportionate mixing: Mixing Rules")
29
Stability of Disease-free Steady State

30
Characteristic Equation The characteristic equation has a unique real solution which is dominant, that is, the real part of rest solutions is less than This dominant solution.

31
R 0 <1, Disease-free State Is Stable The characteristic equation has a unique dominant real solution. That is, the real part of all other solutions is less than this dominant solution; The dominant solution is negative iff R 0 <1; Whenever R 0 <1, the disease-free steady state is locally asymptotically stable.

32
Endemic Steady States

33
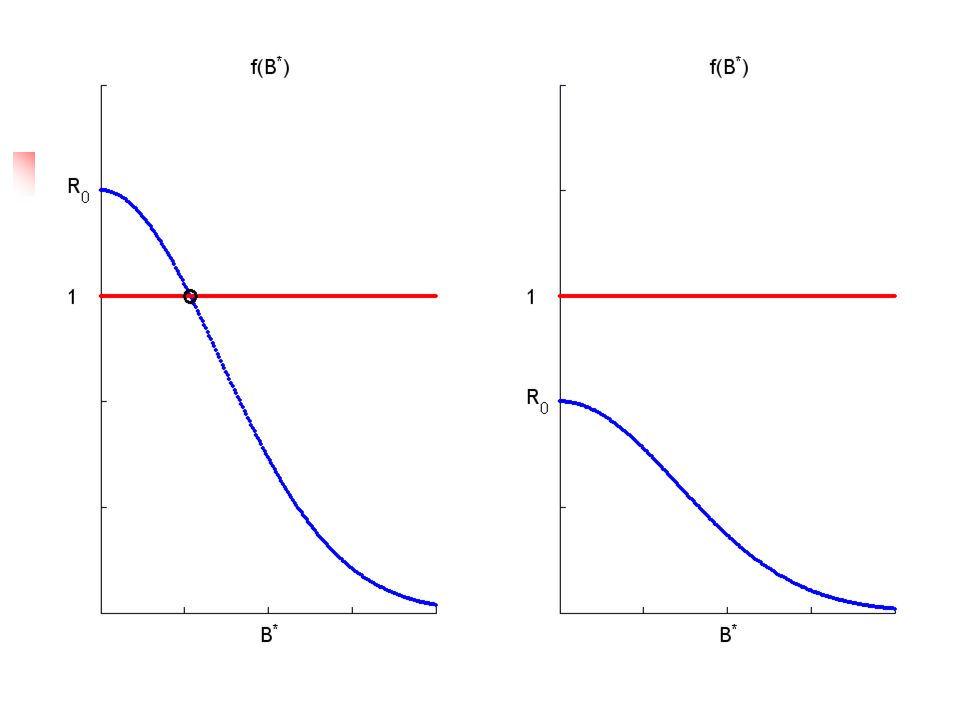
Moving forward, one can formally solve for the steady states. The existence of endemic steady states is determined by the roots of the following equation: f(B * ) is a decreasing function of B * with f( )=0. R 0 >1, there exists a unique endemic (e.g. non trivial) steady states; R 0 <1, an endemic steady state does not exist.
 is a decreasing function of B * with f( )=0. R 0 >1, there exists a unique endemic (e.g. non trivial) steady states; R 0 <1, an endemic steady state does not exist..")
35
Cross Immunity -coefficient of cross-immunity Relative reduction on susceptibility due to prior exposure to a related strain. =0, represents total cross-immunity =1, represents no cross-immunity 0< <1, represents partial cross-immunity >1, represents immune deficiency

36
Transfer Diagram: X Y 1 Z 1 Y 2 V 2 Z 2 V 1 W NOTATION: XSusceptible Individuals YiIndividuals Infected Strain i. ZiIndividuals Recovered Strain i. But Susceptible to Other Strain. ViIndividuals Infected by Strain I but Recovered From the Other Strain. WRecovered Individuals.

39
Hopf-Bifurcation point 1 I 0 0 C 11 C 1 12 w nBifurcatio-Hopf 1

40
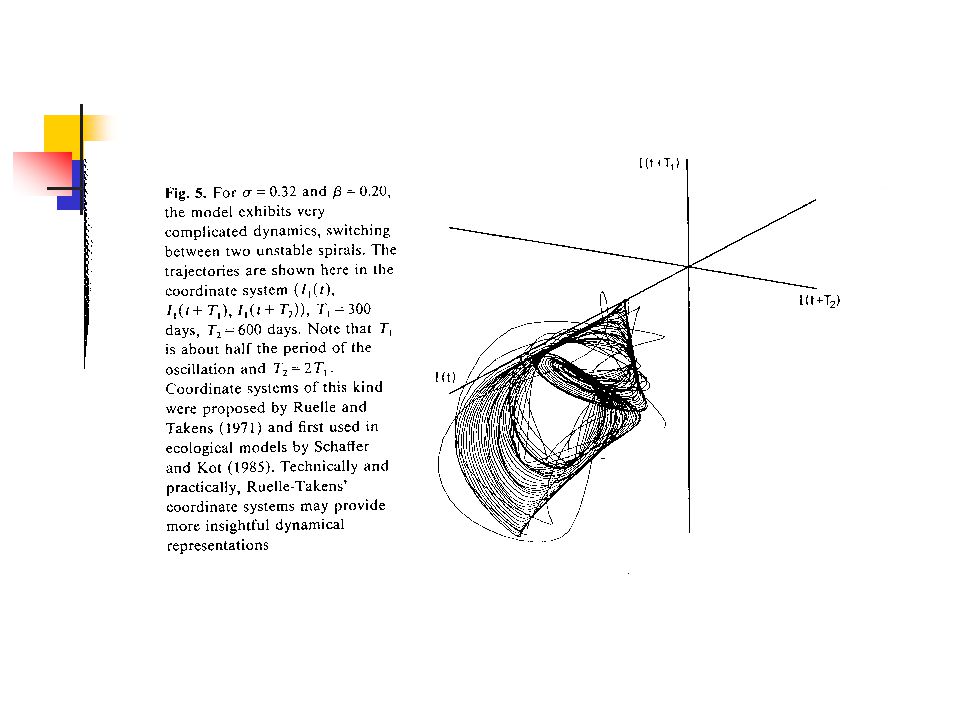
Hopf -Bifurcation 1 2 0 E 2 E 1 E Strain 1 Strain 2 present is 1Strain present is 2Strain *We have oscillations for a range of the quarantine period

47
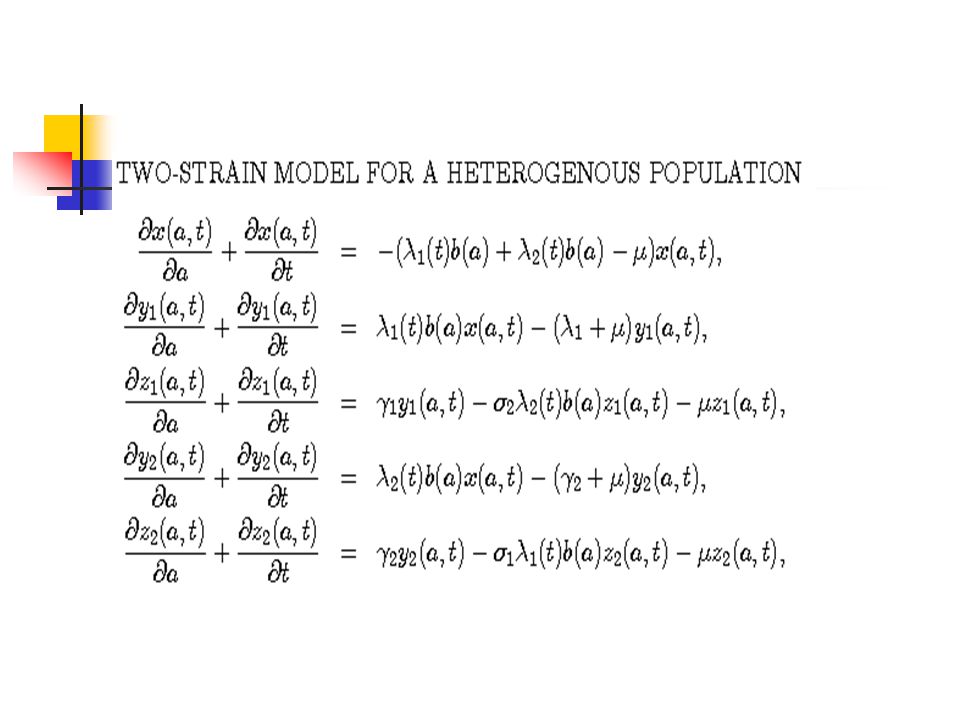
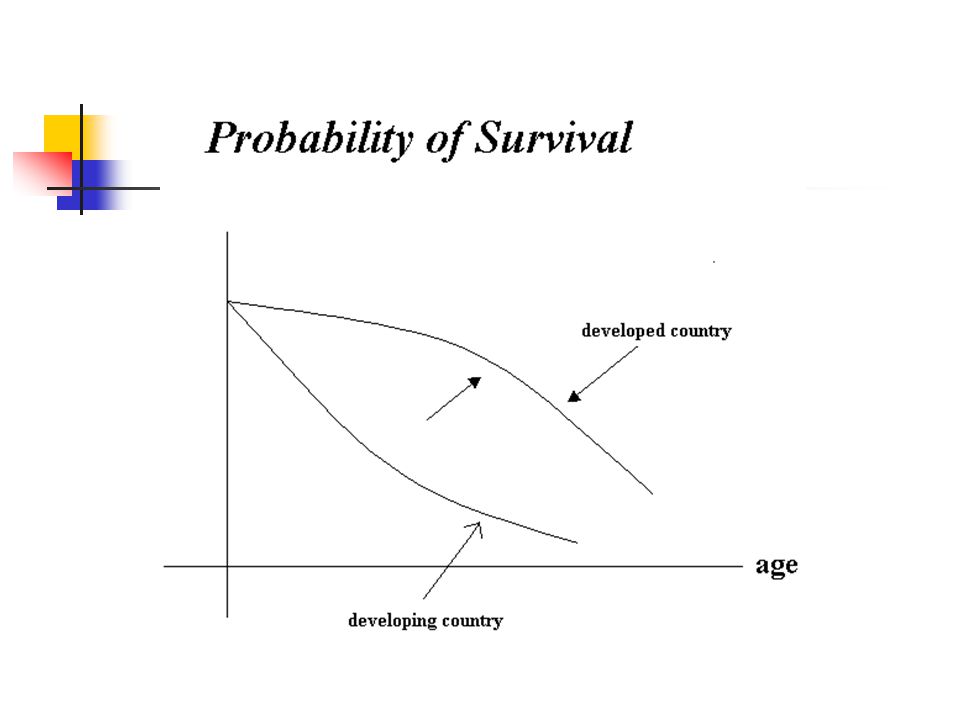
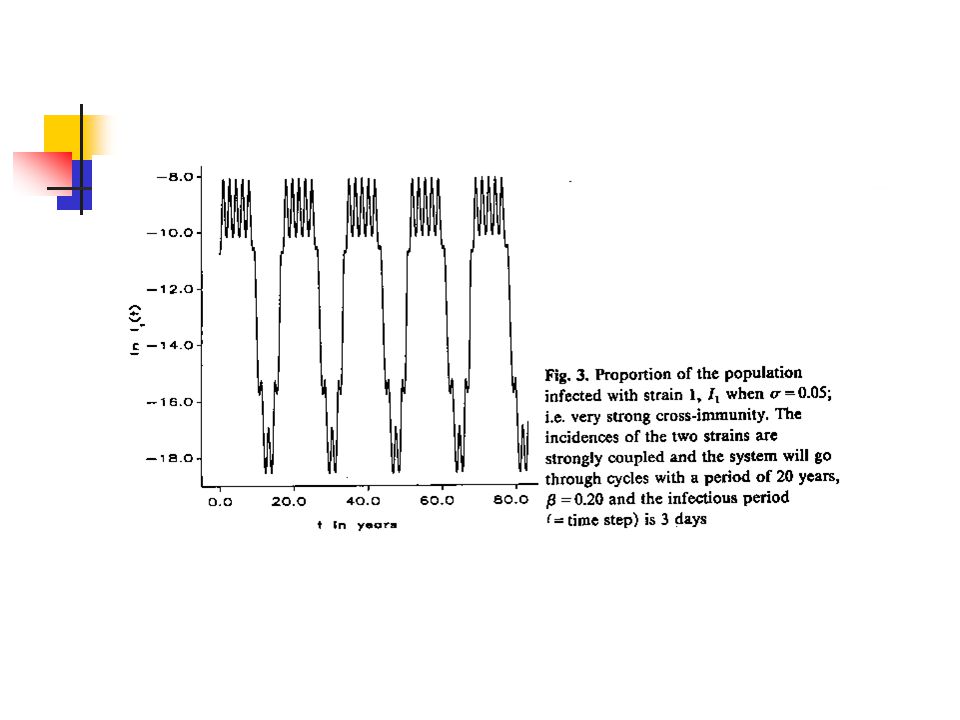
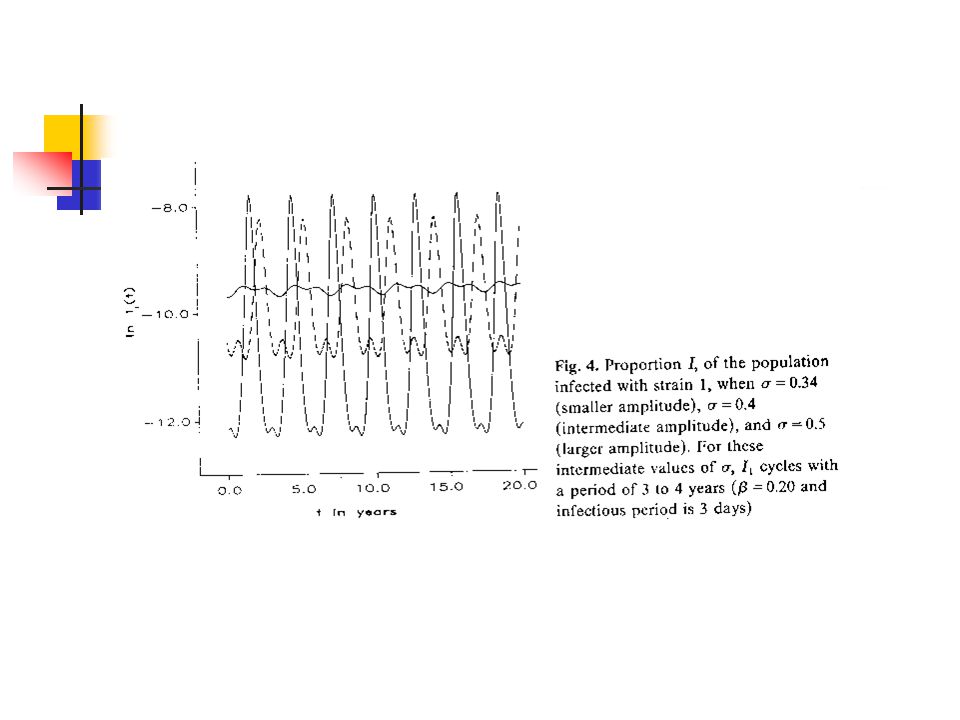
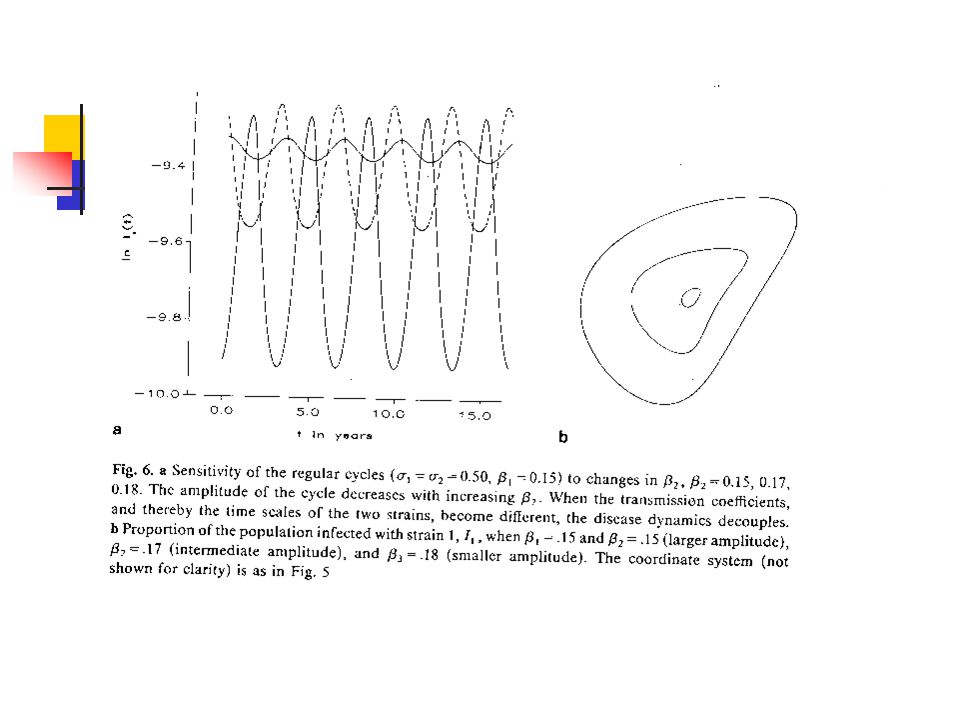
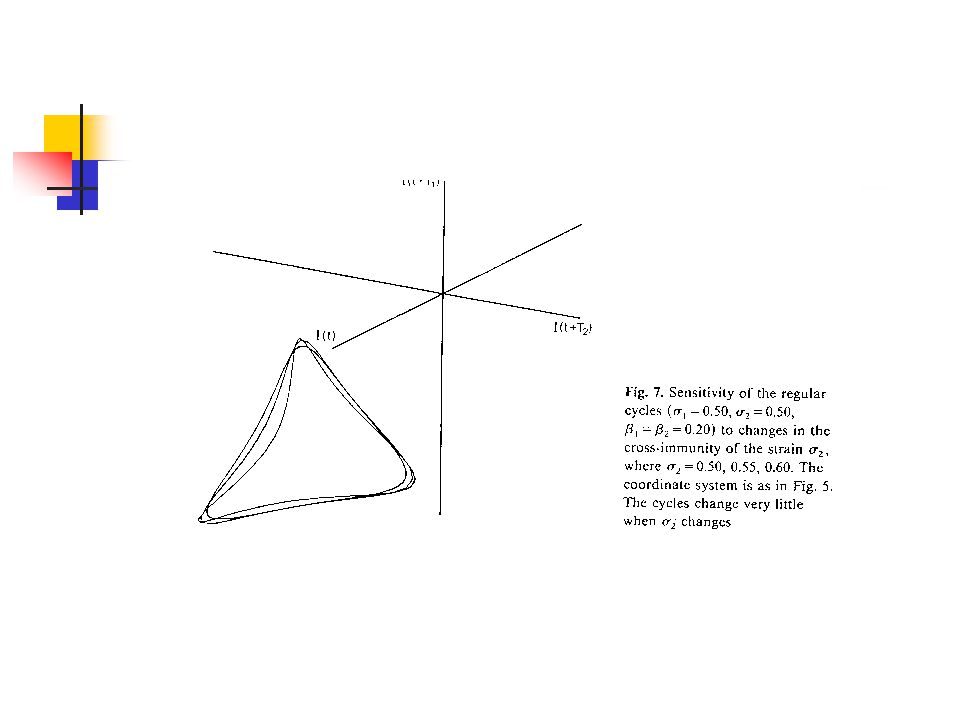
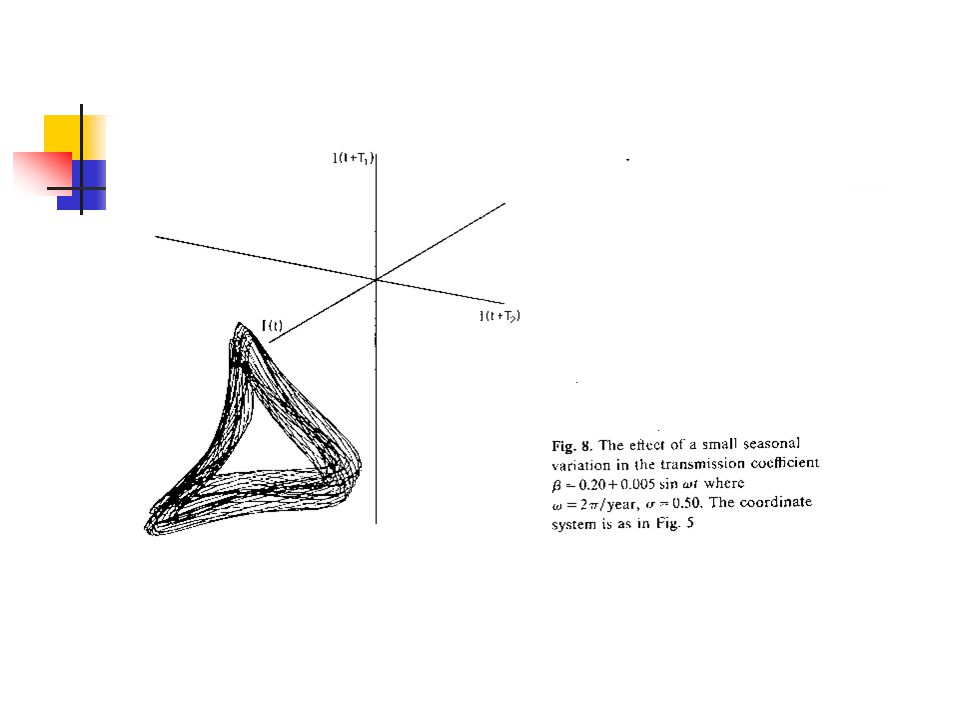
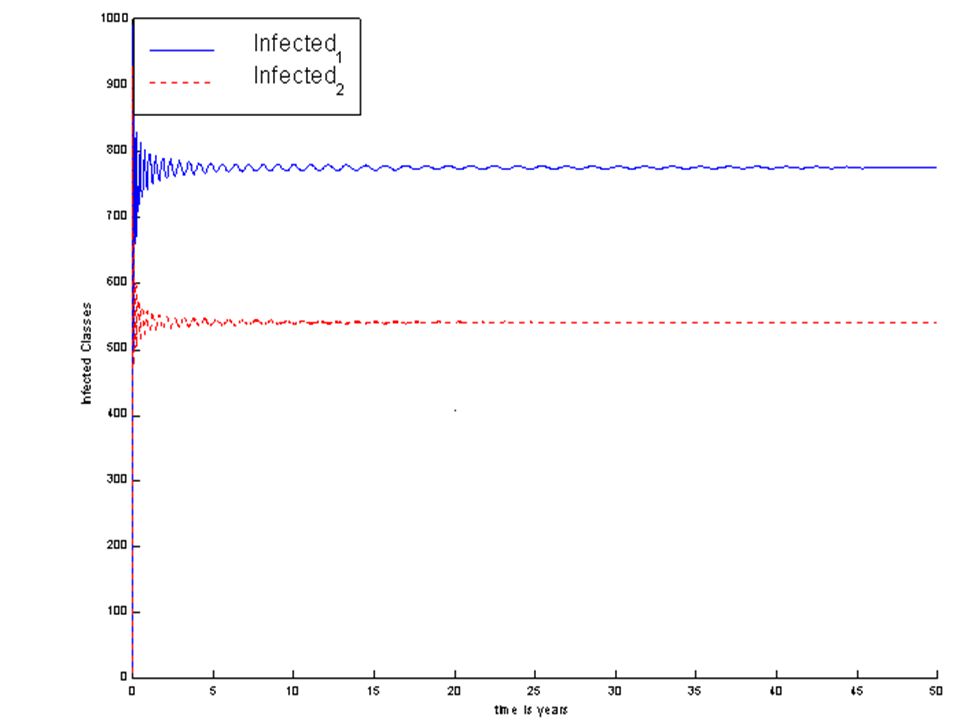
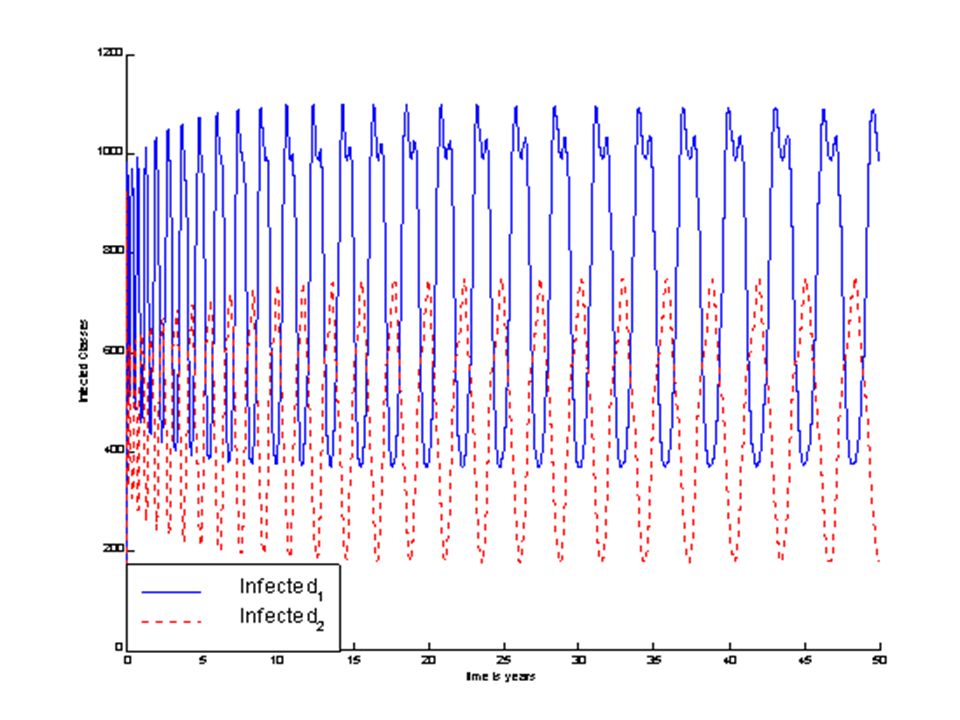
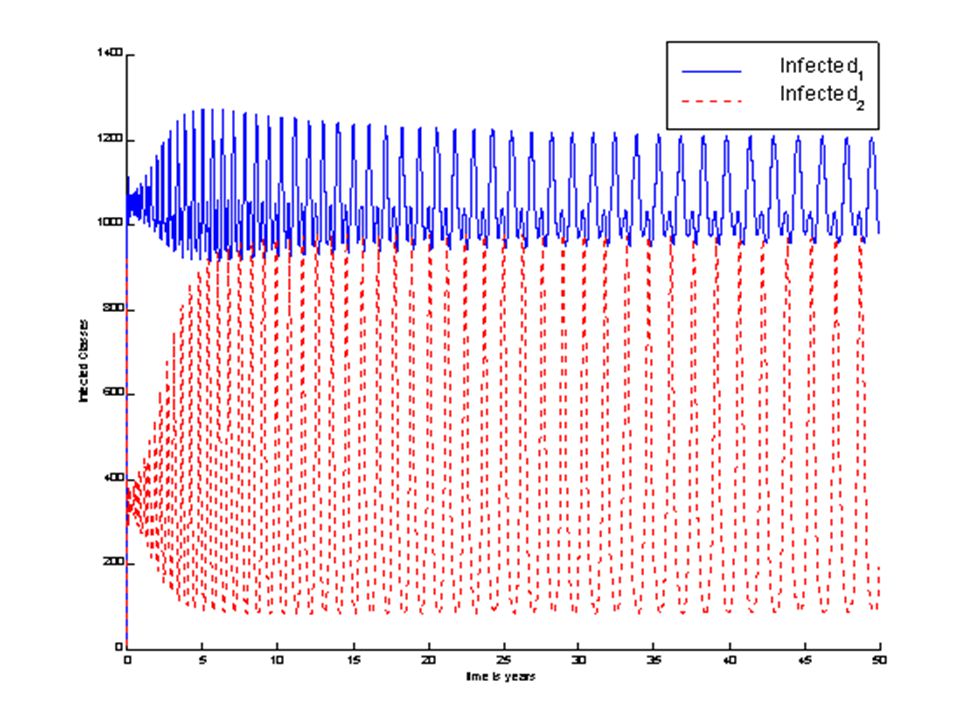
Results Age-structure is sufficient to drive sustained oscillations in a multiple strain model[Castillo-Chavez, Hethcote, Andreasen, Liu and Levin]. For a heterogeneous population and age-dependent mortality, cross-immunity provides an explanation to the observed recurrence of strains [Castillo-Chavez, et.al]. Under the assumption of cross-immunity and multiple strains, quarantine periods support sustained oscillations [Castillo-Chavez, et.al].
![Results Age-structure is sufficient to drive sustained oscillations in a multiple strain model[Castillo-Chavez, Hethcote, Andreasen, Liu and Levin].](http://images.slideplayer.com/14/4413621/slides/slide_47.jpg " For a heterogeneous population and age-dependent mortality, cross-immunity provides an explanation to the observed recurrence of strains [Castillo-Chavez, et.al]. Under the assumption of cross-immunity and multiple strains, quarantine periods support sustained oscillations [Castillo-Chavez, et.al]..")
48
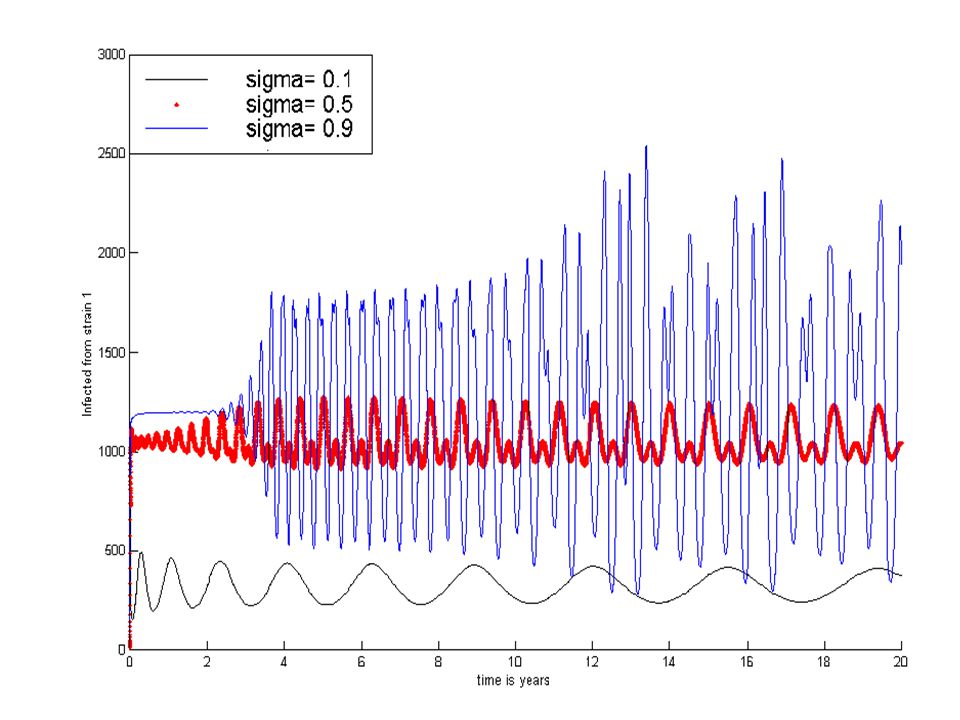
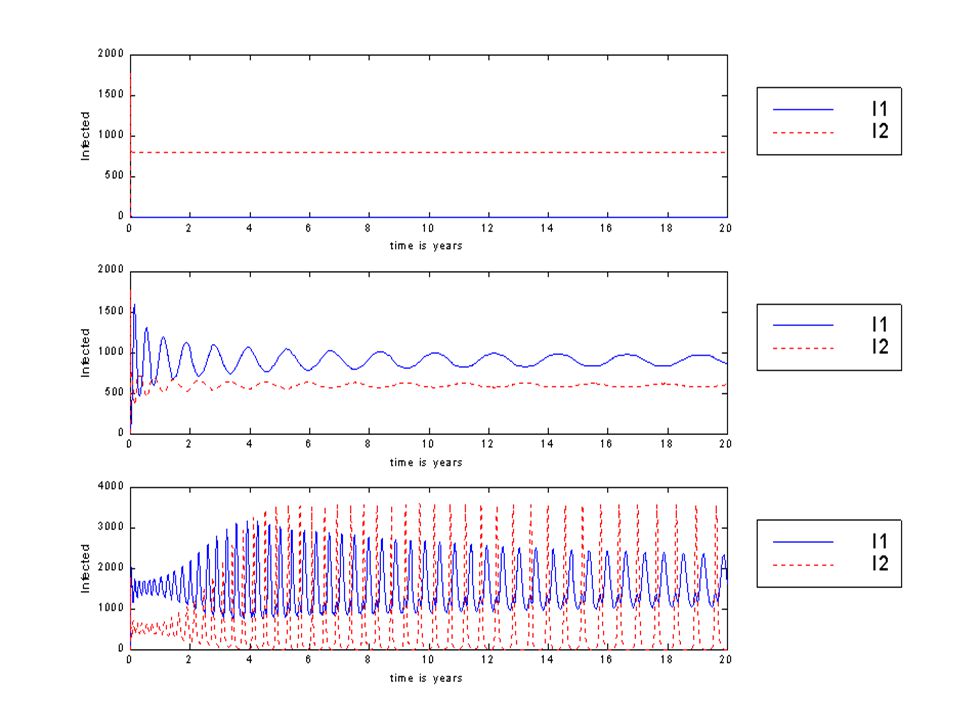
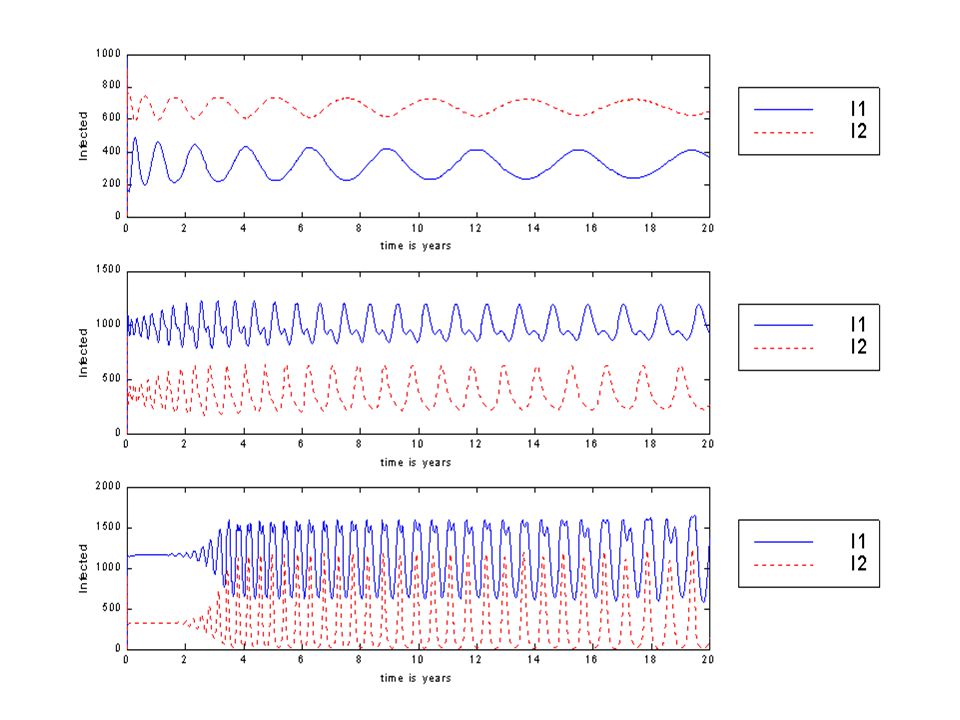
A model on the role of cross-immunity and quarantine In the following model we explore cross- immunity and quarantine periods as the mechanisms driving the observed epidemic outbreaks. Multiple outbreaks appear and grow in number as we increase the levels of cross protection for the circulating type A influenza strains.

49
Q 1 Q 1 1 R 2 I 2 R 2 Q 1 I W A V 111 IS 11 I 11 Q 1 R 11 I 1 I S A V)S(I 222 2 I 2 Q 22 Q 22 I A V 1121 IR 2 R 1 V 11 V W 22 V 22 I 2 V 1 V A 2212 VIR 2 V S
S(I 222 2 I 2 Q 22 Q 22 I A V 1121 IR 2 R 1 V 11 V W 22 V 22 I 2 V 1 V A 2212 VIR 2 V S")
50
The Model S A V Adt d jjjiii IS)VS(IS iiii i Q)(I Q dt d A d jj ijiiiii i VI RRQI R ii ii ji i V A VI R dV ii iiii ISI A V dt d i I WVV W jjii d
VS(IS iiii i Q)(I Q dt d A d jj ijiiiii i VI RRQI R ii ii ji i V A VI R dV ii iiii ISI A V dt d i I WVV W jjii d")
51
Hopf-Bifurcation point 1 I 0 0 C 11 C 1 12 w nBifurcatio-Hopf 1

52
Hopf -Bifurcation 1 2 0 E 2 E 1 E Strain 1 Strain 2 present is 1Strain present is 2Strain *We have oscillations for a range of the quarantine period

59
Conclusions Cross-immunity allows for the incorporation of immune system level phenomena into population models. Population structure is critical in the study of communicable diseases. The impact of reservoir of infection needs further study. Identification of mechanisms capable of generating sustained oscillations is important.

60
Future Work The study of influenza and other communicable diseases at global scales is critical (several Russian researchers and Longini have done some important past work). The impact of continued population growth and environmental changes also must be considered in the study of disease spread.

Similar presentations


 is a respiratory disease of pigs caused by type A influenza virus.>")
 Virus>")
 flu. It is a new desease that has appeared in 2009 around the world, and we are going.>")


