Download presentation
Presentation is loading. Please wait.

1
HCV Evolution: Diversification and Convergence Yury Khudyakov Division of Viral Hepatitis Centers for Disease Control and Prevention, Atlanta, GA

2
Public Health Reduction of morbidity and mortality - Diagnostics - Treatment - Prevention Medicine Introduction

3
A high rate of mutation defines rapid HCV evolution HCV genome continuously changes “Arms Race” Pervasive coevolution Opportunity for convergence Introduction

4
PHYLOGENETIC ANALYSIS Intra-Host HCV Variants Patient 1 Patient 2 Patient 3 Patient 4

5
Network of coordinated substitutions in the HCV polyprotein K-Core Decomposition of HCV Network

6
Bayesian Network of HCV Polyprotein Site Interactions and Therapy Outcome

7
Bayesian Network associating the HVR1 sites with IFN response and host demographic factors HVR1-BN

8
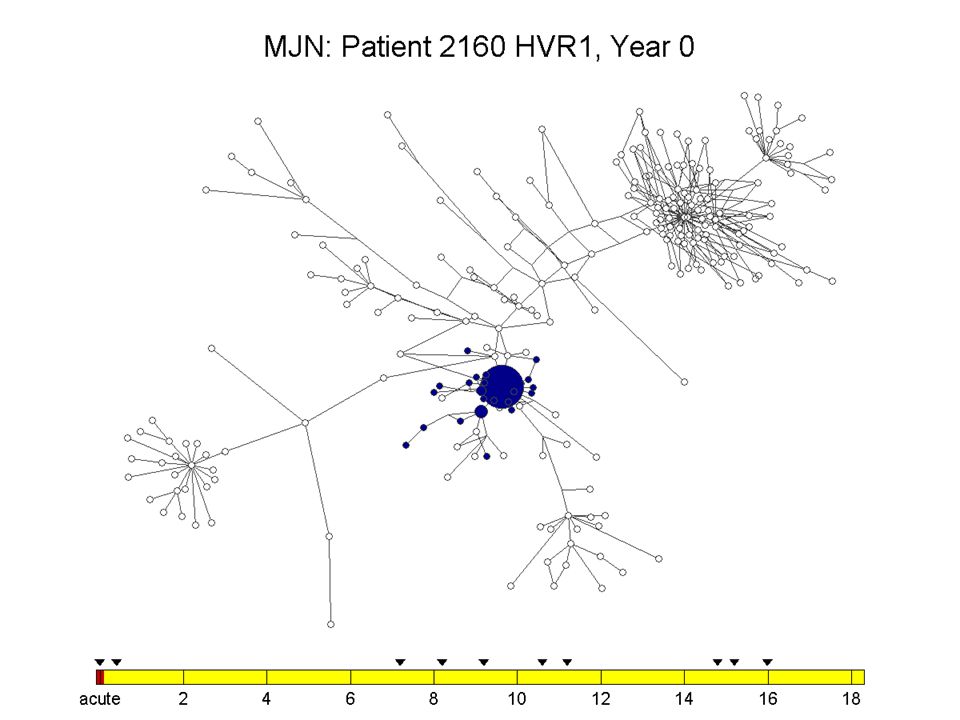
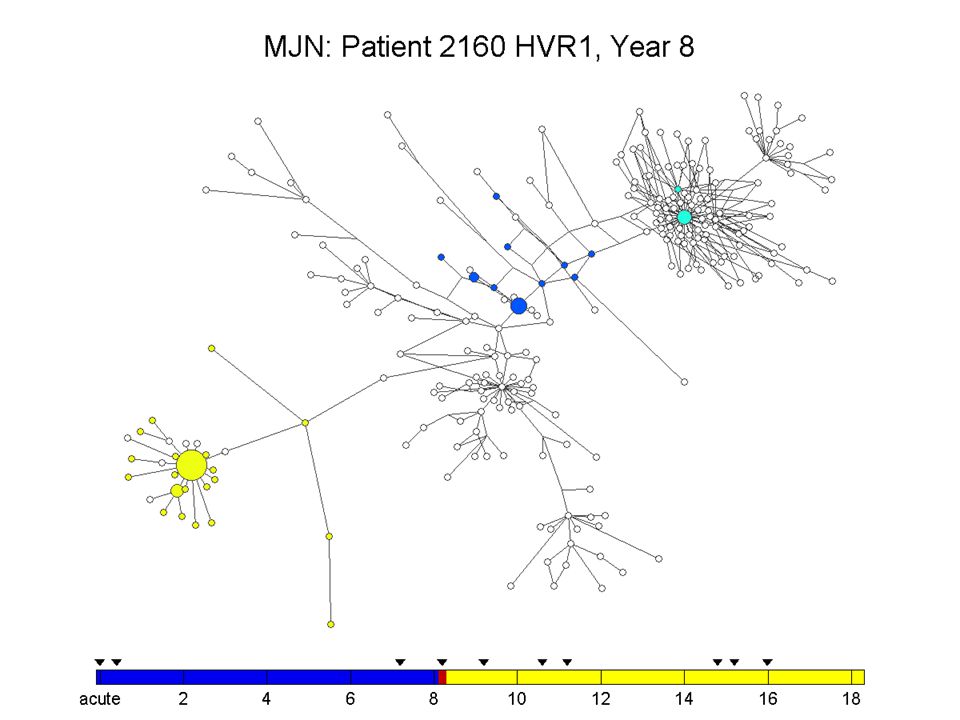
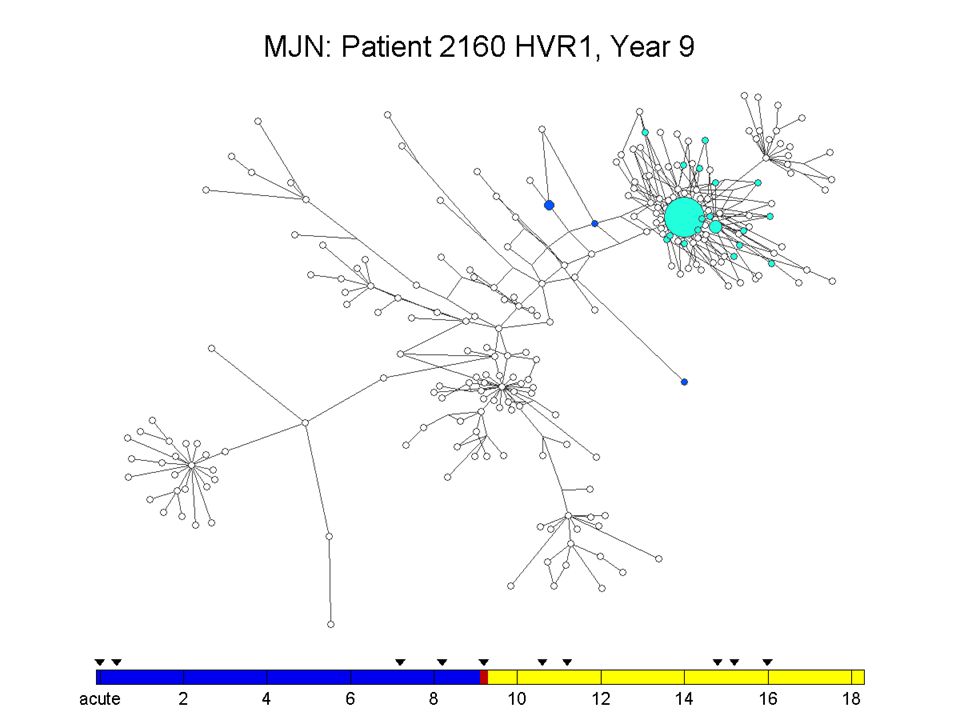
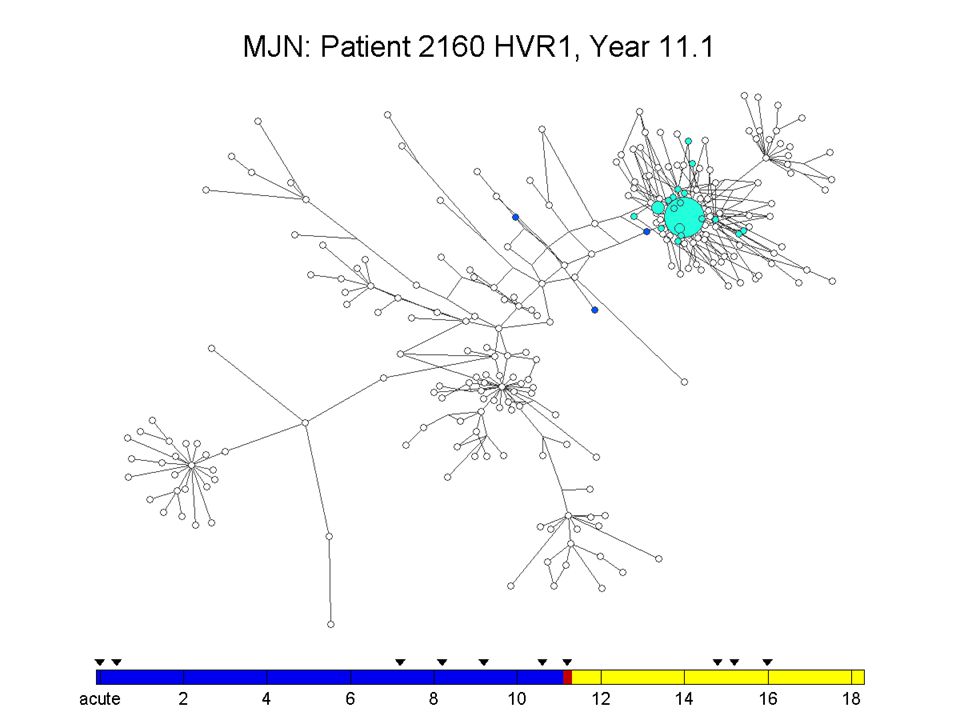
Intra-Host Evolution over Many Years

9
15.991aIDUFemaleUnknownD 15.961aUnknownMaleBlackC 18.121aIDUFemaleBlackB 8.841bTransfusionMaleWhiteA YearsGenotypeTransmissionGenderRacePatient ID Sentinel County HCV Follow-up Study

10
0.05.010.015.0 0.00 10.00 20.00 Divergence Time DBAC HCV Quasispecies Divergence During Long-Term Chronic Infection Patients

11
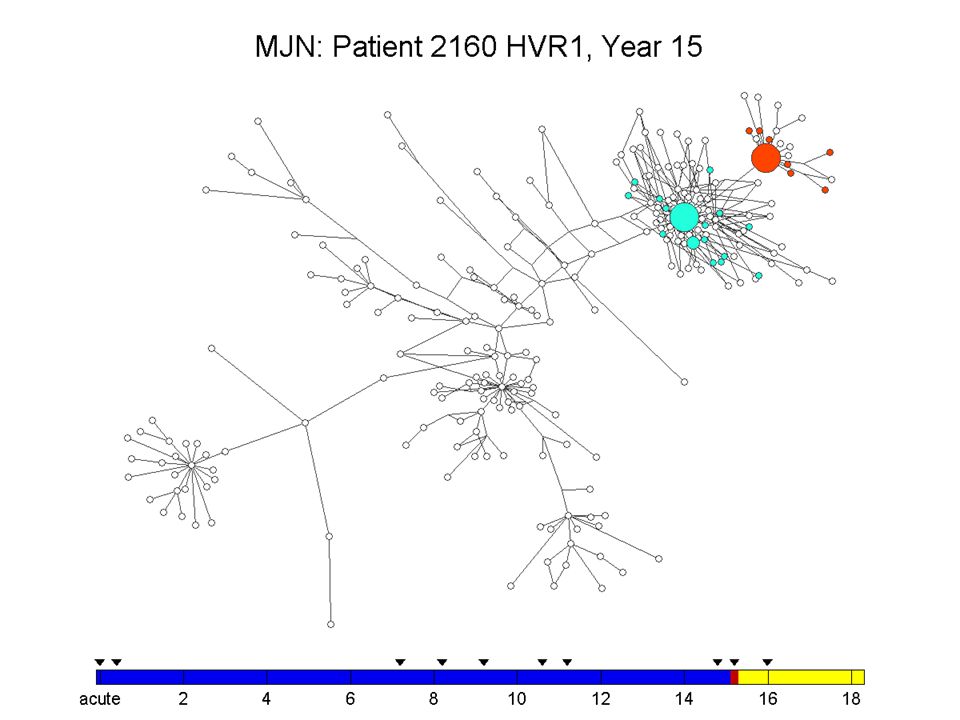
HVR1: patient A Time-pints (Yrs) 0 8.8 2.8 7.9 2.3 0-2.8 yr 7.9-8.8 yr HVR1: patient B 0 17.2 18.2 11.2 15.3 12.2 13.4 10.1 9.0 7.9 3.3 3.0 2.8 16.2 Time-points (Yrs) 0 - 3.3 yr 7.9-13.4 7.9-17.2 15.3-18.2 HVR1: patient D Time-points (Yrs) 0 16.0 1.5 2.5 2.7 4.8 2.3 1.6 2.0 11.6 12.1 14.0 15.0 1.5-2.7 yr 4.8-16.0 yr HVR1: patient C Time-points (Yrs) 0 9.0 16.0 7.1 15.0 8.1 14.6 10.5 0.3 11.1 0-0.3 yr 7.1-8.1 yr 9.0-16.0 yr HVR1 Phylogenetic Trees
 yr yr HVR1: patient B Time-points (Yrs) yr HVR1: patient D Time-points (Yrs) yr yr HVR1: patient C Time-points (Yrs) yr yr yr HVR1 Phylogenetic Trees")
12
DBAC 0.05.010.015.0 0.00 0.50 1.00 1.50 2.00 dN/dS Time Changes in Selection Pressures Over Time dN/dS vs. Time HVR1 – R=-0.58, p=0.0001 NS5A – R=-0.61, p=0.0001 Titer vs. Time R=0.585, p=0.0001 Titer vs. dN/dS R=-0.383, p=0.012 Patients

23
Genetic Linkage to Viral and Host Factors Genomic Structure QS diversity HCV QS SEQUENCE HOST Viral titer dN/dS HCV QS SEQUENCE Factors

24
I.Molecular Epidemiologic Data NHANESIII: 106 patients 1384 HVR1 quasispecies; Genotypes 1 – 6 HVR1: positions 1491 to 1577nt (polyprotein 488 to 516) 5’UTR: positions 127 to 340nt NS5B: positions 8290 to 8589nt (polyprotein 2651 to 2749) II.Quantitative Structure Relationships Probabilistic Graphical Models: Bayesian Networks (BN) III.Predictions Causal models: BN classifiers
 5’UTR: positions 127 to 340nt NS5B: positions 8290 to 8589nt (polyprotein 2651 to 2749) II.Quantitative Structure Relationships Probabilistic Graphical Models: Bayesian Networks (BN) III.Predictions Causal models: BN classifiers")
25
Bayesian Network Model Associating Sequences of HCV HVR1 Quasispecies to Viral and Host Parameters

26
Bayesian Network Model Associating Sequences of HCV HVR1 Quasispecies to Viral and Host Parameters

27
Bayesian Network Model Associating Sequences of HCV HVR1 Quasispecies to Viral and Host Parameters

28
Bayesian Network Model Associating Sequences of 3 HCV Genome Regions to Viral and Host Parameters

29
Target classes10-fold-CV ‡ (%) Acc. randTest † (10-fold-CV ‡ ) TestSet** Genotype99.9%0.3286100% dN/dS ^^ (3-bin) (2-bin) 94.4% 92.2% 0.4020 0.5120 70.3% 82.7% NQSaa-hvr188.0%0.388770.3% NQSnt-hvr187.7%0.397872.4% Viral Titer97.2%0.603152.40% ‡ Avg. accuracies † Random assignment of class labels ** 10 NHANES-3 patients; 5M and 5F; Genotypes 1a and 1b; 185nt/96aa HVR1 QS ^^ Based on dNdS 3 class or 2 class grouping Quantitative Validation of Models Predictions: Classification Modeling
 TestSet** Genotype99.9% % dN/dS ^^ (3-bin) (2-bin) 94.4% 92.2% % 82.7% NQSaa-hvr188.0% % NQSnt-hvr187.7% % Viral Titer97.2% % ‡ Avg. accuracies † Random assignment of class labels ** 10 NHANES-3 patients; 5M and 5F; Genotypes 1a and 1b; 185nt/96aa HVR1 QS ^^ Based on dNdS 3 class or 2 class grouping Quantitative Validation of Models Predictions: Classification Modeling.")
30
Five physicochemical properties (Atchley et al, 2005): Polarity, α-helix, Size, aa frequency, Charge Multiple sequence alignment Euclidean distance between every pair of sequences Visualization of distance matrix Pathfinder network (r = ∞, q = n-1) Methods
: Polarity, α-helix, Size, aa frequency, Charge Multiple sequence alignment Euclidean distance between every pair of sequences Visualization of distance matrix Pathfinder network (r = ∞, q = n-1) Methods")
31
PFNET

32
Inter-genotype convergence Genotype 1

33
Genotype 2 Inter-genotype convergence

34
24.3% of all links are between different genotypes. Genotype convergence

35
We immunized mice with 102 HVR1 peptides covering all high-density regions of the sequence space. We tested the reactivity of each sera against 262 peptides (in yellow), a total of 26724 reactions Cross-reactivity experiment
, a total of reactions Cross-reactivity experiment.")
36
There were 5039 positive reactions (blue links), which correspond to 18.85% of all tested.
, which correspond to 18.85% of all tested.")
37
Three peptides (yellow) were found that collectively reacted with all 262 antigens.
 were found that collectively reacted with all 262 antigens.")
38
Relationship between the reduction of selection pressure and cross-immunoreactivity among HCV intra-host variants PatientCorrelation between DN/DS and ACR p-value Patient B-0.62620.0166 Patient C-0.91010.0003 Patient D-0.4760.1001 60*ACR DN/DS Patient C

39
Public Health: Reduction of morbidity and mortality - Diagnostics - Treatment - Prevention Medicine: Conclusion Many viral phenotypic traits with significant medical and public health implications are convergent rather than ancestral

40
Thank you!

Similar presentations


 Fuad AM Hasan Department Of Medicine Faculty of Medicine Kuwait University.>")

 Teacher: Professor Chao, Kun-Mao Speaker: Ho, Bin-Shenq June 4, 2012.>")


>")


 Science 288, 339-344. Georg Gerber HST.120 December.>")

