Download presentation
Presentation is loading. Please wait.

1
China in the 21 st Century: Customer of Western Growers or Cutthroat Competitor? Scott Rozelle Professor and Chancellor’s Fellow Department of Agricultural and Resource Economics UC Davis rozelle@primal.ucdavis.edu

2
Rapidly Shifting Nature of China’s Food Economy … almost defies description

3
Marketizing

4
More Open [Shenzhen in 1980 and 2000]
![More Open [Shenzhen in 1980 and 2000]](http://images.slideplayer.com/14/4391544/slides/slide_4.jpg "More Open [Shenzhen in 1980 and 2000]")
5
Industrializing

6
Urbanizing

7
Westernizing

8
Complicated Little work done in this area (most on major grains and other staple crops) Horticulture economy is changing as fast as China is … So what does that mean for trade of agricultural commodities, in general, and for trade for fruits and vegetables, in particular? China’s Emergence as a Horticulture Exporter and Impact on Horticulture Supply, Demand and Trade

9
… and: Falling Barriers and Opening to the Outside World

10
Agricultural Trade (million US$)
")
11
Agricultural Trade Balance by Factor Intensity, 1984 to 2002 (mil US$) Rising EXPORTS from China Rising IMPORTS into China Labor intensive crops (e.g., fruits and vegetables) Land intensive crops (e.g., soybeans, cotton and wheat)
 Rising EXPORTS from China Rising IMPORTS into China Labor intensive crops (e.g., fruits and vegetables) Land intensive crops (e.g., soybeans, cotton and wheat)")
12
Soybean Imports in China, 1980 to 2005 Soybeans: land intensive crop … huge rise of imports (1/3 of world’s trade) … Prediction: massive displacement of China’s farmers and falling prices … however ….
 … Prediction: massive displacement of China’s farmers and falling prices … however ….")
13
Rise of Frozen Strawberries Imports into the US from China

14
Apple Exports in China, 1986 to 1999 (Tons) Fresh, Exports Juice, Exports
 Fresh, Exports Juice, Exports")
15
Foreign Direct Investment – Food and Others

16
Horticulture Facts: Supply (Production and Marketing) Demand Trade Relative Competitiveness: China versus US What Can Western Growers / Research Administrators Do? Outline of Presentation

17
Horticulture Facts: Supply/Marketing, Demand and Trade Think of trade as sort of a race between supply and demand

18
China’s Horticulture Supply First the bad news …

19
Increasing Sown Areas of Vegetables in China and California (1000 ha) California China Every 2 years or so, add another CA!
 California China Every 2 years or so, add another CA!")
20
Trends of Cultivated Areas of Fruits and Nuts in China and California (1000 ha) CaliforniaChina Campaign to upgrade quality 2005
 CaliforniaChina Campaign to upgrade quality 2005")
21
China has Higher Share of Land in Orchards than Most Other Countries PRC US

22
California’s Top 20 Ag. Products vs. China

23
Tomatoes and Garlic – China Area Trends, 1985-00 ( 1000 ha)
")
24
Walnut, Grapes and Peaches -- China Area Trends, 1985-00 (1000 ha) peaches walnuts / grapes Growth in early 1990s was for edible oil, but future is not in walnut oil
 peaches walnuts / grapes Growth in early 1990s was for edible oil, but future is not in walnut oil")
25
Production Environment (policy/infrastructure) in China is Changing Rapidly From a policy of grain-first, food self sufficiency … to a policy targeting higher rural incomes and shift towards crops in which China has more an advantage in growing From a policy environment in which farmers were always the lowest priority … to one in which their interests are being considered …
 in China is Changing Rapidly From a policy of grain-first, food self sufficiency … to a policy targeting higher rural incomes and shift towards crops in which China has more an advantage in growing From a policy environment in which farmers were always the lowest priority … to one in which their interests are being considered …")
26
Percent Grain in Sown Area in China: 1950s, 1970s and 2003 1970s 2003 Grain Other Other … including horticultural producers Steady rise in cash crops / fruits / livestock / aquaculture Other Grain 1950s

27
China’s Farm Structure 200,000,000+ million farms Every rural resident (900,000,000 of them) has land Almost all farms are “family farms” Farm size: “1 mu per person” Average size of vegetable operation (about 1/3 of an acre … a big garden!) Historically (since HRS): little cooperation
 has land Almost all farms are family farms Farm size: 1 mu per person Average size of vegetable operation (about 1/3 of an acre … a big garden!) Historically (since HRS): little cooperation")
28
Growth of Cooperatives and Farmer Associations – Targeted mostly at provision of technology and inputs and marketing Index (2003=100)
")
29
But, cooperative movement still small Percent of villages with Cooperatives / FAs Percent of households that belong to Cooperatives / FAs 8 %2 % Most coops include members that produce livestock and horticulture crops

30
Comparing with other nations: Percentage of Households Participating in Coops/FAs

31
Investments into China’s Agriculture Gov’t Investments – show rising trends … Billion yuan (real) FDI in ag: mostly into horticulture sector (may pose biggest threat to US in short run!) … mostly by foreign investors that want to export to Japan and Korea
 FDI in ag: mostly into horticulture sector (may pose biggest threat to US in short run!) … mostly by foreign investors that want to export to Japan and Korea")
32
Agricultural research investment intensity (%) in the late 1990s But in the same way that growers here worry about low labor costs; China’s farmers worry about low investment into technology; extension and services
 in the late 1990s But in the same way that growers here worry about low labor costs; China’s farmers worry about low investment into technology; extension and services")
33
Annual TOTAL Investments into Rural Areas Although comparisons are difficult, main point is that China still has a long way to go in making rural China into a modern economy US dollars per capita

34
Remaining Questions [given the forces that are driving the economy] #2: So who is responsible for the emergence of China’s fruit and vegetable economy? [lots of misperceptions … “why does the ‘government’ in China want to plant so much fruit?”... This is wrong perception … for a few industries OK (e.g., tomato paste) … but, most … let’s see who is producing and procuring]
![Remaining Questions [given the forces that are driving the economy] #2: So who is responsible for the emergence of China’s fruit and vegetable economy.](http://images.slideplayer.com/14/4391544/slides/slide_34.jpg "[lots of misperceptions … why does the ‘government’ in China want to plant so much fruit ... This is wrong perception … for a few industries OK (e.g., tomato paste) … but, most … let’s see who is producing and procuring].")
35
Greater Beijing Area Location of Study’s Sample Sites = other major horticulture sites

36
City Center … Beijing (Forbidden City ) … First Circle is 6 th Ring Road (like beltway in DC) The Sample: Geographical Layout of Sampling Approach for China Horticulture Survey (kilometers) x x x x x x x x x x x x x x x x x x x x x x x x x x x x x 36 o 40 60 80 100 140 x x x x x x x x x x x x x x x x x x x x x Distance from one side of largest circle to the other is about 170 miles (from Sacramento to Fresno / Half Moon Bay to Turlock) 5 circles x 10 towns per circle x 4 villages per town = 200 villages All towns, villages and farmers randomly selected … interviewed farmers / village leaders
 … First Circle is 6 th Ring Road (like beltway in DC) The Sample: Geographical Layout of Sampling Approach for China Horticulture Survey (kilometers) x x x x x x x x x x x x x x x x x x x x x x x x x x x x x 36 o x x x x x x x x x x x x x x x x x x x x x Distance from one side of largest circle to the other is about 170 miles (from Sacramento to Fresno / Half Moon Bay to Turlock) 5 circles x 10 towns per circle x 4 villages per town = 200 villages All towns, villages and farmers randomly selected … interviewed farmers / village leaders")
37
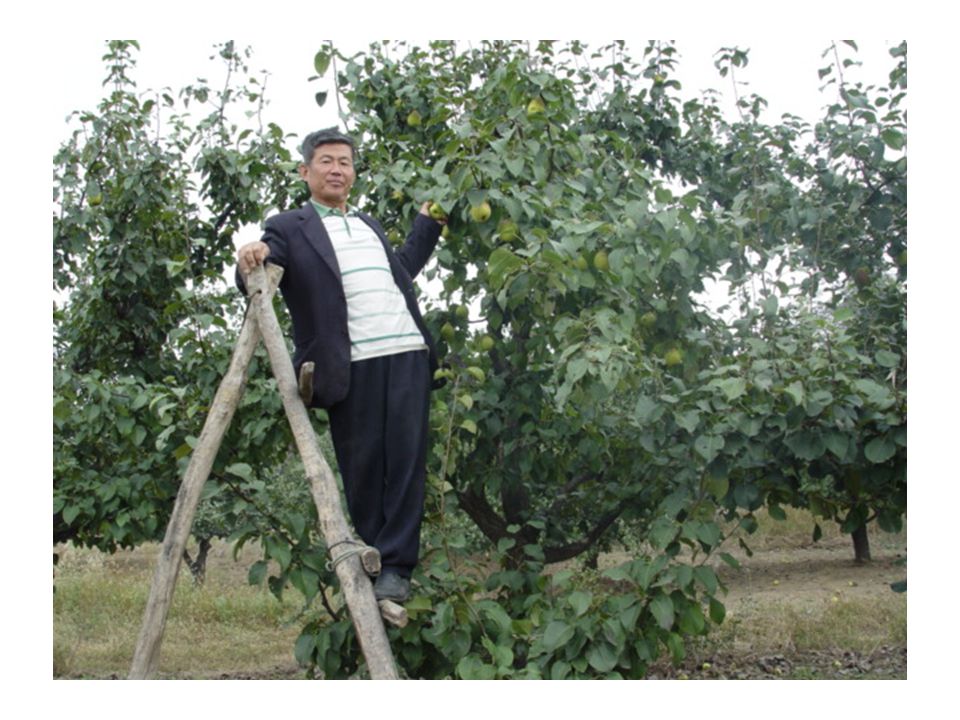
The typical fruit growing household in China, 2005 Household characteristics HH size(person)4.4 Age of HH head(year)42 (male) Education and training Education of HH head(year)7 Share of HH head with ag extension training (%)50 Off-farm job (%) Share of HH head who has off-farm jobs (in factory) (%)20 Share of household head who has off-farm jobs (self employed) (%)25 Assets: Farm equipment (US$)402 Housing (US$)7882
4.4 Age of HH head(year)42 (male) Education and training Education of HH head(year)7 Share of HH head with ag extension training (%)50 Off-farm job (%) Share of HH head who has off-farm jobs (in factory) (%)20 Share of household head who has off-farm jobs (self employed) (%)25 Assets: Farm equipment (US$)402 Housing (US$)7882")
38
The typical fruit growing farm in China, 2005 Farm Characteristic Farm size(acre)1 acre Distinct Plots(number)5 plots Number of crops (diversification) (number)3 crops Ownership and Control Contracted from “collective” (%)96 Rented from other farmer (%)4 Share of area decided by farmer (%)94.2 Labor Own Labor Days / Acre (mandays)312 Hired Day / Acre (mandays)42 Wage (US$/day)3,25
1 acre Distinct Plots(number)5 plots Number of crops (diversification) (number)3 crops Ownership and Control Contracted from collective (%)96 Rented from other farmer (%)4 Share of area decided by farmer (%)94.2 Labor Own Labor Days / Acre (mandays)312 Hired Day / Acre (mandays)42 Wage (US$/day)3,25")
39
Degree of Commercialization of Fruit, Nut and Vegetable Farmers in Greater Beijing Area, 2004 Sales as a Share of Production (97%) Consumed at home (3%) Data Source: authors’ survey
 Consumed at home (3%) Data Source: authors’ survey")
40
Rise over time – Vegetables (greater Beijing area) Share of “cultivated area” (not including orchard area) sown to vegetable crops About 1/3 of this area is in greenhouses … Data source: authors’ survey data Percent
 Share of cultivated area (not including orchard area) sown to vegetable crops About 1/3 of this area is in greenhouses … Data source: authors’ survey data Percent")
41
Rise over time – Fruit (greater Beijing area) Share of “cultivated area” plus “orchard area” planted to fruit orchards Does not include nuts Data source: authors’ survey data Percent
 Share of cultivated area plus orchard area planted to fruit orchards Does not include nuts Data source: authors’ survey data Percent")
42
Where are they being grown? Inside Ring / Outside Ring Share of Fruit and Vegetable Sown Area “Mostly here” 140 40 These figures for vegetables in 2000 / same for F&N’s remote suburbs

43
Who are growing them? Rich or Poor? Per capita income: “Rich” -- $7.28/day Poor -- $1.25/day Fruits / Nuts / Vegetables are being increasing grown by poor farmers in relatively remotes communities! “They do” poor producers “rich” producers Share of Fruit and Vegetable Sown Area

44
Cost of Production of Fresh Tomatoes in China & US, 2000 ( $1=8.3 RMB)
")
45
Cost of Production of Fresh Tomatoes China and US PRC US

46
Cost of Production of Japonica Rice China and California PRC CA

47
Cost of Production of Premium Black Cherries China and Washington PRC WA

48
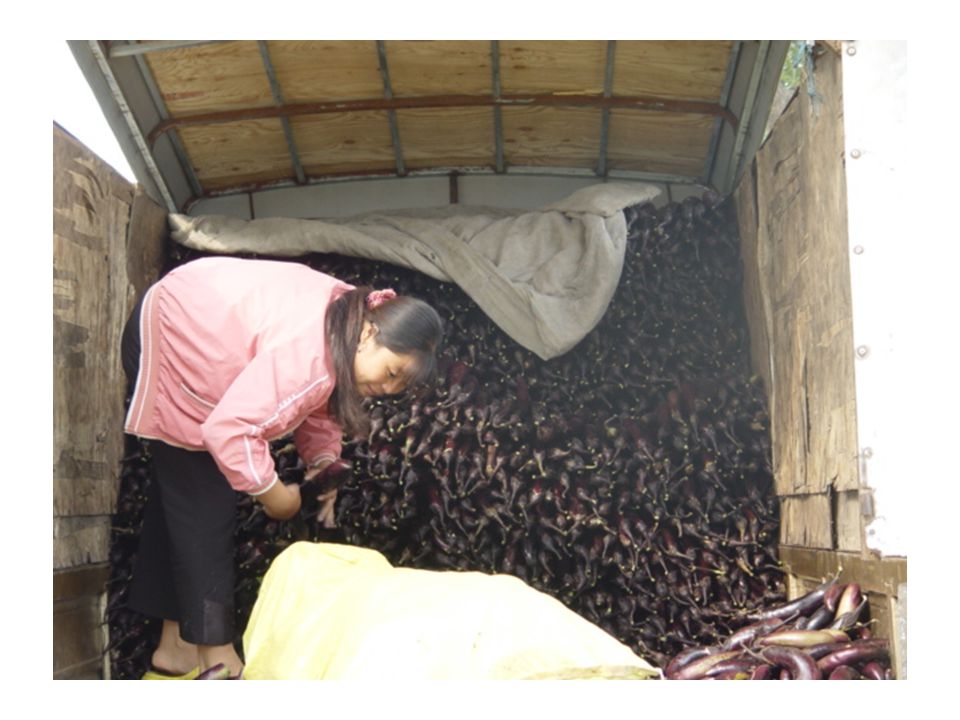
The Buying Landscape: Who might be out procuring the crop? Supermarkets / Coops Processing Firms (e.g., apple juice crushers) Professional Supply Firms (on contract to exporters /supermarkets / hotels / restaurants) Consumers (“u pick ‘em” / bought by companies for distribution to their employees) Small traders [2 to 6 people working together / No warehouse; no office; no license; often no transport / Pay cash on the spot / From Henan; Hubei; Anhui / Poor (will work for $2-3/day) ]
 Professional Supply Firms (on contract to exporters /supermarkets / hotels / restaurants) Consumers ( u pick ‘em / bought by companies for distribution to their employees) Small traders [2 to 6 people working together / No warehouse; no office; no license; often no transport / Pay cash on the spot / From Henan; Hubei; Anhui / Poor (will work for $2-3/day) ].")
49
Small Trader-dominated System (2004) Note; -- Supermarkets did not procure in any villages (ZERO) -- Zero procured by coop Percent of all purchases / coops
 Note; -- Supermarkets did not procure in any villages (ZERO) -- Zero procured by coop Percent of all purchases / coops")
50
“In-home Service” (2004) Note; -- “In the village” = Off the tree + From Home + Road-side -- Share sold in wet markets in cities down over time Percent of all purchases
 Note; -- In the village = Off the tree + From Home + Road-side -- Share sold in wet markets in cities down over time Percent of all purchases")
59
Profile: Typical 6-man Trading “Firm” Farmer’s field Small Trader: Finds seller / contacts trucker / buys with cash Small Trader -- Partner Networks / process inside China’s cities (>90% private) Export networks Partners: in other villages Small Trader -- Partner In the city wholesale mktGoing from village to village Private, “contract” trucker Division I Div II
 Export networks Partners: in other villages Small Trader -- Partner In the city wholesale mktGoing from village to village Private, contract trucker Division I Div II")
60
Summary: Participants in China’s Fruit, Nut and Vegetable Markets FarmerPrivate$2/day 97% own decisions Small TraderPrivate$3/day TruckerPrivate$2.5/day Second buyer>90% private Export business?

61
Summary (supply/marketing) Q: Who is producing and procuring China’s vegetables and fruit and nut commodities: A: poor, small farmers living in remote areas connected to domestic and international markets by an enormous network of poor, small traders … Implications: cheap food … in abundance … but difficult to monitor quality and food safety … Note: where is China’s Communist government? [no where to be seen in markets of most commodities]

62
Demand The good news … Most fundamentally: Domestic demand is LARGE and is GROWING (in many dimensions) 1.3 billion consumers … and growing!
 1.3 billion consumers … and growing!")
63
Rapid economic growth – nearly 10% per year for more than 25 years Index: Size of the economy 1978=100

64
Overall Increase in Off-farm Work In 2000: 45% of rural labor force have jobs off the farm … more than 80% of households have at least 1 person working off the farm In 1980: only 4% worked full time off the farm Increasingly new entrants to the off farm labor force are going to the city to work as a migrant Rural labor force

65
Consumption Consequences of Migration: less grain/more meat & fruit INDEX UUU R R R

66
SUPERMARKET OLYMPICS: Increasing Store Units 20 to 30 percent annual growth between 1998 and 2002 Number of Stores

67
Supermarket Sales Around 40 percent annual growth between 1998 and 2002 $US Billions And growing!

68
Share in National Retail Percent of Total National Retail Sales Nearly 50% of urban food purchases

69
Entry of MNCs Almost “everyone” is in China: –Wal-mart –Carrefour –Ahold –CRE Vanguard –And other chains from Japan; Thailand; Korea; Singapore; Hong Kong; France; Germany; UK; US PLUS many aggressive domestic chains from China So much competition, World Banks calls it the “Retail Olympics”

70
Urban Fruit/Nut Consumption in China Rising faster since 2000!

71
So who is Winning the Race? Supply or Demand?

72
Price of Fruit Relative to All Other Prices, China

73
Rates of Protection (%) Fruit in China NPR has fallen as China has expanded its exports of fruit Protected Market – Large Potential for Imports Export Potential 1990 2001
 Fruit in China NPR has fallen as China has expanded its exports of fruit Protected Market – Large Potential for Imports Export Potential")
74
But in new survey on export market competitiveness Costs are much higher for export oriented crops … Need monitoring … Need contracting … Need large testing, inspection and packing input … Can China bring these costs down? Or, in high quality export markets will costs be similar to those of producers/exporters in other countries (like the US)?
 .")
75
Summary -- Competitiveness When labor can make up a large part of a crop in China, it has a huge cost advantage … these are some of the crops that have grown the fastest … When land (rice) or land and capital (processing tomatoes), costs are more similar … China is investing aggressively in technology and capital-intensive / logistic intensive research and infrastructure
 or land and capital (processing tomatoes), costs are more similar … China is investing aggressively in technology and capital-intensive / logistic intensive research and infrastructure")
76
Conclusions China’s agriculture has been transforming at an incredible rate … more open; more towards comparative advantage; more efficient China has great potential to continue growing in this direction Biggest advantage in low production costs of labor intensive commodities

77
Conclusions US is due for tough competition for many crops Competition: first, in third markets (Japan; Hong Kong; Korea; Taiwan) … later, directly in CA(?) Extent of competition will depend on: -- rate of improvement of quality and marketing (but this is improving fast!) -- growth of China’s domestic demand -- how US and other competitors or collaborators perform
 … later, directly in CA( ) Extent of competition will depend on: -- rate of improvement of quality and marketing (but this is improving fast!) -- growth of China’s domestic demand -- how US and other competitors or collaborators perform")
78
What can Western Growers do? Strategy ONE: “Ignore what is going on” [but can only adopt this strategy if buy into 1 or more of several assumptions] China is not a threat -- today’s presentation should be evidence this is not so on its own, China is developing VERY FAST … but there is time -- China also has several important regulatory advantages (farmers in US have other advantages) China will implode: -- there are severe water problems -- infrastructure is so poor, can not compete
 China will implode: -- there are severe water problems -- infrastructure is so poor, can not compete.")
79
What can Western Growers do? Strategy TWO: “Raise Protection” Because China is entering WTO as a “non-market economy,” it is easy to file and win dumping cases … garlic honey apple juice concentrate But, these are almost surely a function of the way the laws are written … China typically is NOT dumping … in longer run, politics and WTO appeals will probably limit effectiveness of this strategy

80
What can Western Growers do? Strategy THREE: “Compete” -- Research -- Promote and Differentiate Our Products -- Invest and Become Partners

81
Thank you

83
Trade for Horticulture Products

84
Apple Exports and Imports in China, 1986 to 1999 (Tons) Fresh, Exports Juice, Exports Fresh, Imports
 Fresh, Exports Juice, Exports Fresh, Imports")
85
exports imports All imports from California

86
exports imports Most of imports from the US

87
imports exports Almost all imports from California

88
exports imports Almost all imports from California

89
Other good and bad news California wine imports into China … up Broccoli exports from China to Japan … up What is coming: –Export-side … Frozen strawberries / fresh apples / fresh vegetables –Import-side … High quality fruits / foods ingredients for in-country food processing industry GOOD BAD ???

90
SUMMARY Significant percentage of ag. land used in horticultural products (more than US) Rising sown area and production in many (not all) of horticultural products grown in Western US Although demand growing fast (lots of opportunity), production growing faster lower prices falling NPR growing exports What is future hold? –Keep watching the race: Supply vs. Demand!
 Rising sown area and production in many (not all) of horticultural products grown in Western US Although demand growing fast (lots of opportunity), production growing faster lower prices falling NPR growing exports What is future hold. –Keep watching the race: Supply vs. Demand!.")
91
Relative Competitiveness: China versus US (California) Comparing the Level of Cost of Production of Major Agricultural Commodities in China and California
 Comparing the Level of Cost of Production of Major Agricultural Commodities in China and California")
92
Cost of Production of Fresh Tomatoes in China & California, 2000 ( $1=8.3 RMB)
")
93
Cost of Production of Fresh Tomatoes China and California PRC US

94
Cost of Production of Peppers China and California PRC CA

95
Cost of Production of Oranges (Navels and Valencias): China and California PRC CA
: China and California PRC CA")
96
Cost of Production of Japonica Rice China and California PRC CA

97
Cost of Production of Processing Tomatoes China and California PRC CA

Similar presentations


 13 th Symposium on Development and Social Transformation.>")


