Download presentation
Presentation is loading. Please wait.

1
Floods: What We Know, What We Don’t Know, and a Case Study Atmospheric-Science Seminar Colin Raymond October 2014

2
Outline What We Know (IPCC Report) What We Don’t Know [Yet] (Jain & Lall 2001) Case Study (Martius et. al. 2013)
![Outline What We Know (IPCC Report) What We Don’t Know [Yet] (Jain & Lall 2001) Case Study (Martius et.](http://images.slideplayer.com/14/4388649/slides/slide_2.jpg "al. 2013).")
4
What We Know CPT D. MIDAS Ability to simulate floods qualitatively depends on ability to predict extreme precip changes Extremes: circulation probably more important for rarer events C.C.: Insufficient evidence for attribution or even trends in magnitude – GCMs often disagree --nonstationarity in river dynamics? --size of spring melt floods?

5
What We Don’t Know [Yet]: Floods & Climate Change Strong correlations b/w ENSO/PDO indices & Similkameen River annual-max flows (AMF’s) Is this relationship robust over periods longer than obs. record? If so, what are the implications?
![What We Don’t Know [Yet]: Floods & Climate Change Strong correlations b/w ENSO/PDO indices & Similkameen River annual-max flows (AMF’s) Is this relationship robust over periods longer than obs.](http://images.slideplayer.com/14/4388649/slides/slide_5.jpg "record. If so, what are the implications .")
6
What the Record Says

7
--Linear predictability of flood maxima a season in advance from ENSO-related indices

8
ENSO Variability is Concentrated at Certain Frequencies

9
...but there’s longer timescales in there too

10
ENSO Variability is Concentrated at Certain Frequencies...but there’s longer timescales in there too Structured Non-Stationarity in Flood Dist’ns?

11
Non-Stationarity & ‘Snippet Biases’ we’re likely overcounting extreme ENSO events & thus flood variability n-s: no short record can be fully representative selon ZC example (MATLAB) follows
 follows")
15
Same Principle Holds for Extremes

17
Conclusions from Jain & Lall Interannual stationarity in flood potential cannot be assumed even in a constant climate Flood extremes in WA closely correlated with ENSO over multiple timescales Good news: using extremes in the current obs. record as guideposts likely means overpreparation

18
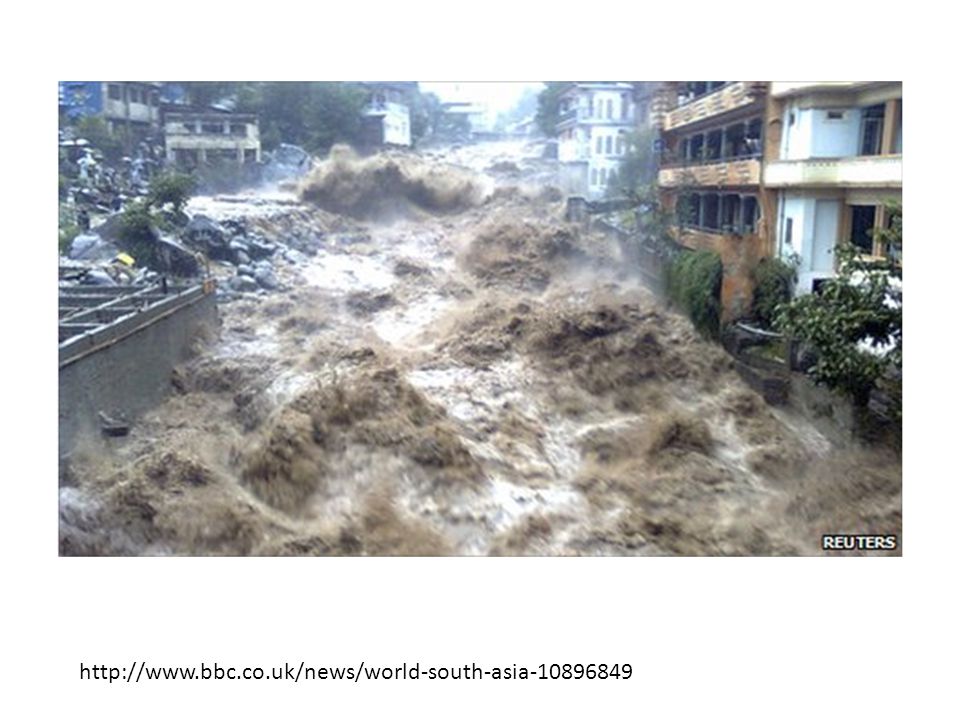
Case Study: 2010 Pakistan Floods http://www.bbc.co.uk/news/world-south-asia-11068259

19
http://www.bbc.co.uk/news/world-south-asia-10896849
20
Magnitudes

21
Related Findings In the Alps, long N-S upper-level troughs trigger heavy precip via: – creating favorable wind dirs for topographic lift – providing a persistent moisture source – reducing static stability & thus ‘activation energy’ – forcing ascent quasi-geostrophically

22
Other Known Extreme Factors ENSO phase – in Pakistan, climatologically higher precip during La Niña Soil-moisture feedbacks Deeply saturated air Warmer temps aloft

24
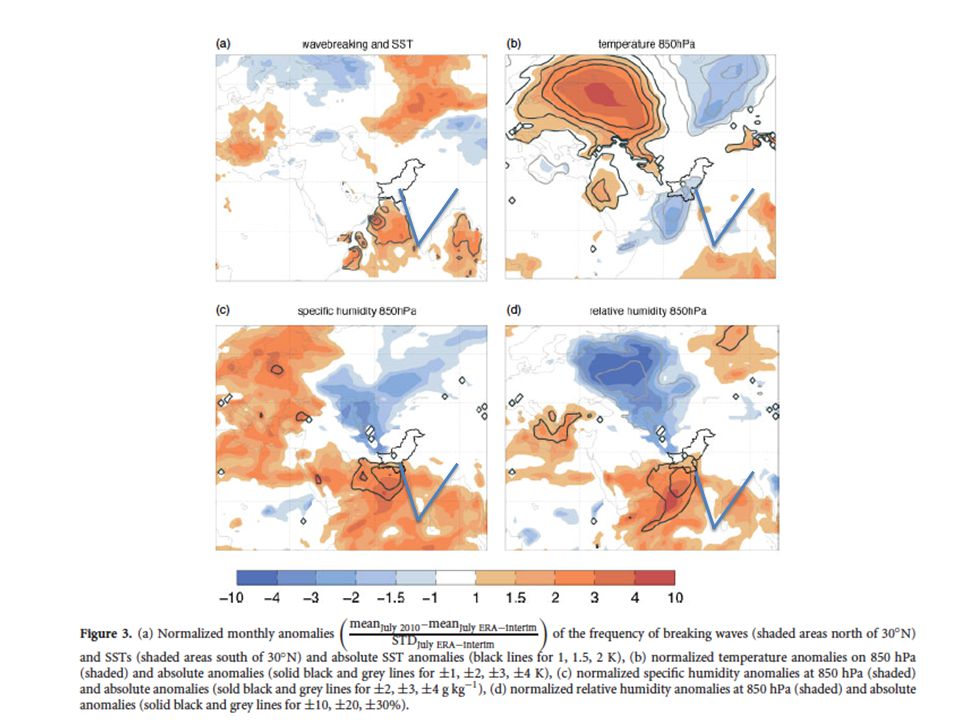
Circulation and SSTs H upper-level wave- breaking zone; +PV anomaly warm SSTs monsoon low Somali jet Himalayan- foothills jet convergence & lifting

25
Low-Level Temperature H cool air (enhanced evap.)
")
26
Moisture very moist air very dry air

27
Methodology back & forward trajectories to determine contributions of moisture-source regions, using potential-vorticity inversions simulation of sensitivity of precip to regional evapotranspiration

28
Potential Vorticity Review http://www.lpc2e.cnrs-orleans.fr/~enriched/images/News/Fullsize/SPIRALE_mimosa.png

29
Potential Vorticity Review PV=-g(ζ g +f)(∂θ/∂p) http://www.eumetrain.org/data/2/28/Content/Images/pv2.jpg
(∂θ/∂p)")
30
PV Inversion Given a distribution of PV in a domain (& some other basic conditions), one can recover the balanced mass & momentum fields that produced it – piecewise technique just divides atmos in layers & independently inverts each – this allows for analysis of the influence of discrete portions of the total PV field on the total flow field
, one can recover the balanced mass & momentum fields that produced it – piecewise technique just divides atmos in layers & independently inverts each – this allows for analysis of the influence of discrete portions of the total PV field on the total flow field")
31
Trajectory Calculations: 2 Approaches Lagrangian (Martius et. al.): Assumes Δq is cumulative sum of parcel’s E-P along route – ultimate sources of moisture appear less important if intermediate precip & evap occur Eulerian: Inserts tagged tracers into model and follows them through the water cycle Winschall, Pfahl, Sodemann, and Wernli, 2014. “Comparison of Eulerian and Lagrangian Moisture Source Diagnostics — the Flood Event in Eastern Europe in May 2010.” Atm. Chem. Phys. 14, 6605:6619.
: Assumes Δq is cumulative sum of parcel’s E-P along route – ultimate sources of moisture appear less important if intermediate precip & evap occur Eulerian: Inserts tagged tracers into model and follows them through the water cycle Winschall, Pfahl, Sodemann, and Wernli, Comparison of Eulerian and Lagrangian Moisture Source Diagnostics — the Flood Event in Eastern Europe in May Atm. Chem. Phys. 14, 6605:")
32
Findings Extreme episode #1 #2

33
Findings Heavy precip assoc. with high PW, low T, low CAPE, deep saturation unusual set of anomalies

34
Findings Dynamics: heavy precip assoc. with high PW, low T, low CAPE, deep saturation (unusual set of anomalies) LL Circulation: heat low over northern Pakistan helped draw in moisture that would usually be near Bangladesh UL Circulation: as in similar Alpine events, forcing organized & intensified precip, and appeared to initiate it in the 2 nd episode Moisture transport: 78% of moisture in 1 st extreme episode originated in Pakistan or SW Asia, vs. 34% in 2 nd episode; contribution of Indian subcontinent & bays incr. from 18% to 56% (but note Lagrangian def’n difficulties)
 LL Circulation: heat low over northern Pakistan helped draw in moisture that would usually be near Bangladesh UL Circulation: as in similar Alpine events, forcing organized & intensified precip, and appeared to initiate it in the 2 nd episode Moisture transport: 78% of moisture in 1 st extreme episode originated in Pakistan or SW Asia, vs. 34% in 2 nd episode; contribution of Indian subcontinent & bays incr. from 18% to 56% (but note Lagrangian def’n difficulties).")
35
Findings Cont. Coupling of precip & ET critical (due to local sourcing of moisture), confirmed by ET sensitivity analysis 80% lower precip in simulation when sfc ET over Pakistan was eliminated, despite just a 15-18% decrease in PW High soil moisture meant higher availability for evap. than normal ECMWF predictions & obs agreed remarkably well in both location & magnitude similar dynamics as floods along Front Range of western US (Grumm and Du, 2013)
, confirmed by ET sensitivity analysis 80% lower precip in simulation when sfc ET over Pakistan was eliminated, despite just a 15-18% decrease in PW High soil moisture meant higher availability for evap. than normal ECMWF predictions & obs agreed remarkably well in both location & magnitude similar dynamics as floods along Front Range of western US (Grumm and Du, 2013).")
36
Discussion Point: What Was the Relative Importance of Human Actions? Syvitski, James, and Robert Brakenridge, 2013. “Causation and Avoidance of Catastrophic Flooding along the Indus River, Pakistan.” GSA Today. 23 (1), 4-10.
,")
37
What Can This Tell Us About Effects Under Climate Change? Depends partly on changes in frequency of blocking highs (c.f. heat-wave discussion) Displacement of moisture vs. overall moisture increase – we think we know extreme precip will increase
 Displacement of moisture vs. overall moisture increase – we think we know extreme precip will increase.")
38
Temperature: Lahore vs. Moscow

Similar presentations


 National.>")


>")


