Download presentation
Presentation is loading. Please wait.

2
Benchmarking: If You Can’t Measure It, You Can’t Manage It. Teri U. Guidi, MBA, FAAMA President and Chief Executive Officer Oncology Management Consulting Group Elaine L. Towle, CMPE Director, Consulting Services Oncology Metrics®, a division of Flatiron Health, Inc.

3
Agenda 2014 National Hospital Oncology Benchmark Study National Practice Benchmark, 2014 Report on 2013 Data

4
National Hospital Oncology Benchmark Study In 2013, and in response to the recurring requests on list serves, from colleagues and from clients, OMC Group solicited volunteers to contribute data for a pilot analysis of productivity in hospital-based infusion and radiation centers. It was a big hit! In 2014, we expanded the number of centers and the number of data points. 4

5
2014 Infusion Data Points Calendar year 2013 data Patients per FTE Encounters per FTE and patient Chairs per FTE Active treatment hours per FTE and patient Drug doses mixed per pharmacy staff Registry cases per registrar FTE categories include: nutritionist, financial counselor, social worker, NPP, LPN/NA, MA, RN, patient navigator, pharmacist, pharmacy tech, heme- onc.

6
2014 Infusion Data Slices Size of infusion center Academic or Community Major disease sites – Breast – Colorectal – Lung – Prostate – Benign Hematology – Non-oncology

7
2014 Data 45 infusion centers 27 radiation departments All billed services for any patient that had activity in the infusion department Unique patient id Date of service and diagnosis CPT/HCPCS code and billed units Tumor registry report Program data – Hours of operation – Budgeted FTE’s – Equipment (chairs, linacs, etc.) – Physicians 7
 – Physicians 7")
8
Caveats All centers are coding and billing services correctly All centers code chief complaint in one of the first 3 ICD-9 positions All centers interpreted survey questions consistently Some patients may be counted more than once in disease-specific data (different diagnosis at different encounters) 8
 8")
9
Infusion Center Profiles SMALL CENTERS MEDIUM CENTERS LARGE CENTERS HID ACADEMIC/ COMMUNITY INFUSION ENCOUNTERS UNIQUE PTS HID ACADEMIC/ COMMUNITY INFUSION ENCOUNTERS UNIQUE PTS HID ACADEMIC/ COMMUNITY INFUSION ENCOUNTERS UNIQUE PTS H66C27 H67C1963322 H27C4607892 H45C1310 H52C2107407 H06C4767714 H47C24472 H50C2156993 H38A49401197 H65C310102 H59C2440637 H07A49651064 H55C393116 H23C2549776 H46C50101360 H48C40088 H58C2954816 H72C55921148 H56C441141 H61A3258265 H62A61241143 H54C453143 H12C3453731 H25A62501162 H53C519232 H49C3518883 H24C66651034 H41A627216 H63C37971161 H22C67671733 H42A841191 H21C38231125 H69C69761265 H08C1049327 H40A3968873 H70C72861080 H68C1469189 H10C4203991 H26C75661700 H36C1575332 H39A4341833 H44C88252179 H57C1832480 H60C45581093 H43C93061075

10
The Most Frequently Asked Question How many chairs per RN? We prefer more specific numbers: – Number of patients per RN – Number of infusion encounters per RN

11
Number of Chairs per RN

12
Number of Patients per RN

13
Number of Encounters per RN

14
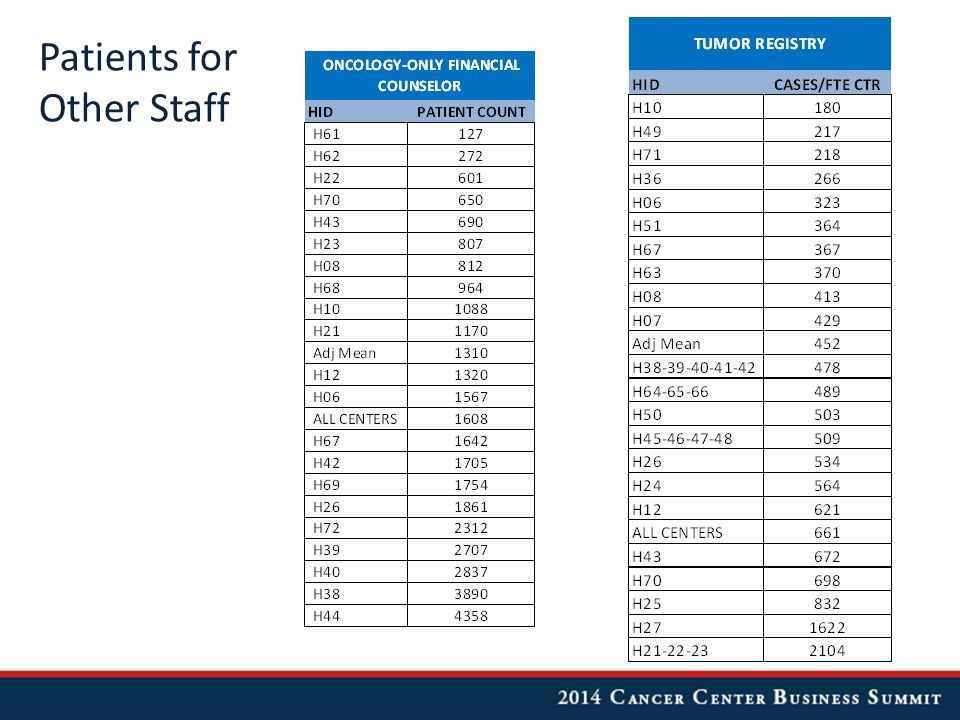
Patients for Other Staff

16
Number of Infusion/Injections Mixed

17
Throughput: # of Encounters per Patient

18
Number of Encounters per Breast Patient

19
Number of Encounters per Benign Heme Patient

20
Number of Active Treatment Hours per Encounter

21
Number of Active Treatment Hours per Encounter – Benign Heme

22
Number of Active Treatment Hours per Encounter - Colorectal

23
Chair Occupancy Rate Active treatment hours / available chair hours

24
Pharmacy Utilization Segregated out all J9 codes as those contain most of the oncology-related drugs Top 10 J9 drugs administered (count of frequency of each code in billing data) Percent of patients who received each drug Average number of times each drug was administered to a patient
 Percent of patients who received each drug Average number of times each drug was administered to a patient")
25
Pharmacy Utilization – Breast Patients

26
Pharmacy Utilization – Colorectal Patients

27
Heme-Oncs Some centers have only “dedicated” heme-oncs Some centers have only “private” heme-oncs Some centers have a mix – These are excluded as it is impossible to match specific patients to specific physicians Only oncology and benign hematology encounters are reported here

28
Number of Encounters per Dedicated Heme-Onc

29
Number of Encounters per Private Heme-Onc

30
What’s New for 2015 NHOBS? Lab data will be added Diagnostic imaging data will be added “Revenue” will be added Goal is to at least double the number of centers Let us know if you would like more information on how to participate and/or how to obtain more of the analysis: nhobs@oncologymgmt.com

31
All rights reserved © July 2014 Do not reproduce without permission 2014 Report on 2013 Data

32
Introduction The National Practice Benchmark™ was developed by Oncology Metrics, a division of Flatiron Health, Inc., a team of professionals with many years of experience in oncology practice, surveys, and benchmarking. Benchmarking is widely recognized as the best, most efficient way to find opportunities to improve your practice and then monitor progress after corrective action is taken. The National Practice Benchmark (NPB) provides important and meaningful data for oncology practices to use for managing in today’s challenging practice environment. This year we instituted eligibility criteria for participation in the NPB. Practices were eligible to participate if the could provide data for calendar year 2013 or their most recently completed 12-month fiscal year for the following: – # of full-time equivalent (FTE) physicians – Total work relative value units (wRVU) – # of new patients – # of patient visits – Cost of goods paid for (COGPF), also known as cost of drugs – Total drug revenue Hospital-based and academic practices without access to cost of goods or drug revenue were given a “pass” and invited to complete the rest of the survey. 32
 provides important and meaningful data for oncology practices to use for managing in today’s challenging practice environment. This year we instituted eligibility criteria for participation in the NPB. Practices were eligible to participate if the could provide data for calendar year 2013 or their most recently completed 12-month fiscal year for the following: – # of full-time equivalent (FTE) physicians – Total work relative value units (wRVU) – # of new patients – # of patient visits – Cost of goods paid for (COGPF), also known as cost of drugs – Total drug revenue Hospital-based and academic practices without access to cost of goods or drug revenue were given a pass and invited to complete the rest of the survey. 32.")
33
Approximately 1,500 medical oncologists, practice administrators, and other key staff members from over 900 practices and institutions across the country were invited to participate in the 2014 National Practice Benchmark. Participants were invited via email and the survey was completed entirely online. Practices were instructed to submit only one survey per practice; multiple results from a practice were deleted. A total of 87 survey responses were submitted from practices in 34 states. The number of practices responding to individual questions varies. The National Practice Benchmark survey instrument collects data for a 12-month period. Practices were required to complete the core elements mentioned previously but not required to answer all questions; data from incomplete surveys is included in the final survey results. Data was submitted by hematology-oncology single specialty practices as well as by multi- specialty practices, hospital-based practices and other institutions. We report the number of responding practices as well as the number of full time equivalent (FTE) physicians for most data points in the survey. Some data are reported on the basis of FTE physician (HemOnc, RadOnc or physician); some are reported on the basis of Standard HemOnc (STD HemOnc) or Standard RadOnc (STD RadOnc). A STD HemOnc is one who generates 7,000 wRVU per year. A STD RadOnc is based on 26 average daily treatments. 33
 physicians for most data points in the survey. Some data are reported on the basis of FTE physician (HemOnc, RadOnc or physician); some are reported on the basis of Standard HemOnc (STD HemOnc) or Standard RadOnc (STD RadOnc). A STD HemOnc is one who generates 7,000 wRVU per year. A STD RadOnc is based on 26 average daily treatments. 33.")
34
Successful NPB survey participants receive a full survey report as well as a practice- specific benchmarking analysis. New this year - we are recognizing successful participants. “Oncology Metrics Certification” will be awarded to individuals who successfully complete the survey and “Oncology Metrics Recognition” will be awarded to their practices and will be recognized nationally in the publication in the fall of 2014. We believe that NPB participants who are able to provide complete and accurate data are among the best managed practices in the country. The ability of these practices to count what counts to keep their practices running efficiently distinguishes them as elite. If you are one of the successful NPB participants, congratulations and keep up the good work! And as you use this data in your practice, remember that “average” in this group is very good indeed. The National Practice Benchmark, 2014 Report on 2013 Data is expected to be published in the November, 2014 issue of the Journal of Oncology Practice. 34

35
Table of Contents Introduction 3 Respondent Demographics 9 Pharmacy Operations 18 Financial Benchmarks HemOnc productivity23 Practice expense32 Revenue & asset management41 Staffing & productivity59 Clinical Data Density 75 Radiation Oncology 82 About Oncology Metrics, a division of Flatiron Health, Inc. 98 About Altos Solutions, Inc., a division of Flatiron Health, Inc. 99 About Flatiron Health, Inc. 100 35

36
New patients Work Relative Value Units (wRVU) Visit counts HemOnc Capacity Ratio HemOnc Productivity 36
 Visit counts HemOnc Capacity Ratio HemOnc Productivity 36")
37
New patients, total New patient volume is an important measure of productivity and an essential tool for strategic planning. Survey respondents reported the number of hematology/oncology new patients that entered the practice in the 12-month period by place of service (office or inpatient hospital). A new patient is defined as “one who has not received any professional services from the physician/qualified health care professional or another physician/qualified health care profession of the exact same specialty and subspecialty who belongs to the same group practice, within the past three years.” (CPT 2014) 37
. A new patient is defined as one who has not received any professional services from the physician/qualified health care professional or another physician/qualified health care profession of the exact same specialty and subspecialty who belongs to the same group practice, within the past three years. (CPT 2014) 37.")
38
New patients, officeNew patients, hospital 38

39
Office established patient visits include CPT codes 99212 – 99215. Hospital established patient visits include CPT codes 99217-99220, 99231-99233, 99234- 99236, 99328-99239. Visit counts 39

40
wRVU The resource-based relative value system (RBRVS) assigns a relative value to each procedure code based on physician work, practice expense and professional liability expense. Relative value units (RVUs) are used by many payers to determine reimbursement for services and are available on the CMS website. wRVU refers to the physician work component assigned to each code and is an important element of physician productivity measurement. This data represents total wRVU attributed to the physician for all services. 40
 are used by many payers to determine reimbursement for services and are available on the CMS website. wRVU refers to the physician work component assigned to each code and is an important element of physician productivity measurement. This data represents total wRVU attributed to the physician for all services. 40.")
41
wRVU, net incident to 41 wRVU is reported here as net “incident to”; that is, any wRVU for services rendered incident to the physician service (not performed directly by the physician) is subtracted from total wRVU.
 is subtracted from total wRVU.")
42
wRVU, E/M & infusion services, office wRVU, E/M services only, office and hospital 42

43
wRVU, E/M services only, hospital 43

44
HemOnc Capacity Ratio The HemOnc Capacity Ratio shows the productivity capacity of the hematology/oncology physicians to see more patients in addition to their current workload, based on the industry standard of 350 new patients per year or 7,000 wRVU per year. Significantly less 1 indicates existing capacity for the hematology/oncology physicians to see more patients. Near 1 means the HemOnc physicians are working near or at full capacity and growth in patient volume will require the addition of more physicians or non- physician practitioners. 44

45
Drug revenue Net drug revenue Revenue mix Revenue 45

46
Drug revenue, infusion pharmacy Drug revenue is defined as total collected revenue for all drugs purchased and administered by the practice (J & Q codes). 46

47
Net drug revenue, infusion pharmacy Net drug revenue is total drug revenue less COGPF (cost of goods paid for). This is a much more realistic way to look at drug revenue for the practice. 47

48
Revenue Mix Hematology/oncology Revenue mix is reported as the adjusted average per STD HemOnc and includes all practices reporting in each category; the number of respondents varies from one category to the next. 48

49
All staff positions are reported as full-time equivalents (FTE). An FTE staff is someone working 40 hours per week or 2,080 hours per year. An FTE is calculated by dividing the number of hours worked per week by 40. Some staff positions may be counted in more than one category but no staff position should be counted as more than 1 FTE. Staff may be reported for all departments/specialties (per FTE physician) or for the hematology/oncology line of business (per FTE HemOnc). Staffing & Productivity 49
 or for the hematology/oncology line of business (per FTE HemOnc). Staffing & Productivity 49.")
50
FTE Staff All includes staff working in all departments/specialties in the practice. Includes all staff; does not include physicians. FTE Staff HemOnc includes all staff working in the hematology/oncology line of business. Includes all staff; does not include physicians. 50

51
Pay Staff AllPay Staff HemOnc Staff pay/physician 51

52
FTE NPPPay/FTE NPP HemOnc Non-physician practitioners (NPP) 52
 52")
53
NPP wRVU/HemOncNPP wRVU/NPP NPP Productivity 53

54
Laboratory 54

55
Research 55

56
Imaging 56

57
FTE chemo admin staff includes all staff responsible for drug purchasing, drug mixing and preparation, delivery to patients, documentation of services provided, and management of these processes. Staff is included in proportion to the amount of time spent on chemotherapy management activities. 57

58
Chemo admin staff productivity Initial infusions is a count of the initial drug administration codes billed by the practice during the period and includes CPT codes 96360, 96365, 96369, 96374, 96409, and 96413. This is a surrogate for the number of patients receiving infusion services and may be used as a measure of productivity in the infusion suite. 58

59
To measure clinical practice and support outcome measurement, it is necessary to capture key clinical data at various points during therapy. Six key clinical indicators (what we call the “Big6”) are essential to any organized data analysis. The Big6 include staging, intent of therapy, toxicity, disease status, performance status and line of therapy. The 2014 NPB survey, for the first time, queried respondents about their ability to report on the Big6. Respondents were asked two questions: – What percentage of patients seen in the 12-month period had the specified element recorded in a defined field in the EMR; and – Whether their response was based on an estimate or an actual measurement. We believe that the ability to measure the degree to which these data are present in defined fields in the EMR is highly correlated with clinical consistency and responsible management of therapy for treated patient populations. Clinical Data Density 59
 are essential to any organized data analysis. The Big6 include staging, intent of therapy, toxicity, disease status, performance status and line of therapy. The 2014 NPB survey, for the first time, queried respondents about their ability to report on the Big6. Respondents were asked two questions: – What percentage of patients seen in the 12-month period had the specified element recorded in a defined field in the EMR; and – Whether their response was based on an estimate or an actual measurement. We believe that the ability to measure the degree to which these data are present in defined fields in the EMR is highly correlated with clinical consistency and responsible management of therapy for treated patient populations. Clinical Data Density 59.")
60
Staging 60 What percentage of patients seen by a physician with a primary cancer diagnosis for which staging is common have staging information recorded in a defined field in the EMR?

61
Intent of therapy 61 What percentage of patients seen by a physician who had therapy initiated or had a change of therapy have the intent of therapy recorded in a defined field in the EMR at least one time?

62
Toxicity assessment 62 What percentage of patients seen by a physician who were on active chemotherapy have a toxicity assessment recorded in a defined field in the EMR at least one time?

63
Disease status 63 What percentage of patients seen by a physician who had therapy initiated or had a change of therapy have disease status recorded in a defined field in the EMR at least one time?

64
Patient performance status (ECOG or Karnofsky) 64 What percentage of patients seen by a physician who were on active chemotherapy had the patient performance status recorded in a defined field in the EMR at least one time?
 64 What percentage of patients seen by a physician who were on active chemotherapy had the patient performance status recorded in a defined field in the EMR at least one time")
65
Line of therapy 65 What percentage of patients seen by a physician who had therapy initiated or had a change of therapy had the line of therapy recorded in a defined field in the EMR at least one time?

66
Thank You! Teri U. Guidi, MBA, FAAMA Oncology Management Consulting Group tguidi@oncologymgmt.com nhobs@oncologymgmt.com Elaine L. Towle, CMPE Oncology Metrics, a division of Flatiron Health, Inc. etowle@oncomet.com

Similar presentations


>")
 Texas Rules for ESRD Facilities What They Mean for the Renal Dietitian.>")


