Download presentation
Presentation is loading. Please wait.

1
Mark E. Nunnally, MD, FCCM Co-Director, Critical Care Fellowship and Associate Professor in the Department of Anesthesia and Critical Care University of Chicago Medical Center Chicago, Illinois GRADE Methodology Expert Contributing Author, “Surviving Sepsis Campaign: International Guidelines for Management of Sepsis and Septic Shock: 2012”

2
Making GRADE work: a how-to for guidelines authors
Mark E. Nunnally, MD, FCCM Associate Professor Department of Anesthesia & Critical Care The University of Chicago

3
Course objectives I Translate evidence into graded recommendations.
Identify the features that reduce or increase the quality of evidence.

4
Course objectives II Appraise clinical data to determine quality of evidence. Integrate quality of evidence for an intervention with costs, the balance between desirable and undesirable effects and values to determine the strength of a recommendation.

5
Contents GRADE- why? Transparency and Certainty
The Guidelines process: a methodologist’s perspective GRADE- components Summary

6
Conflict of interest. I am a GRADE advisor for the Surviving Sepsis Campaign

7
Conflict of interest. I am also only a consultant. YOU are the experts.

8
Why GRADE?

9
Many guidelines, little standardization
Some inform… Some restrict… All claim to be evidence-based… …how can we be certain a guideline is supported by the evidence? …how can we be certain its recommendations will hold over time? …how relevant is the recommendation to the things that matter to me? American Healthcare is undergoing a transition to a new era of control

10
Should we rate evidence?
‘Quality’ is a diluted term Quality is a continuum Decisions are always somewhat arbitrary ‘Experts’ and clinicians don’t always share the same view This is one reason evidence and recommendations should be separate.

11
Should we rate evidence?
You need some reference Simplicity Transparency Vividness

12
Grading of Recommendations Assessment, Development and Evaluation
International consensus document Template for systematic reviews, recommendations You could mention the webinars done and recorded recently, I think I was sending you a link

14
Transparency and certainty

15
QOE- definition For Guidelines Authors “Extent to which confidence in an estimate of the effect is adequate to support recommendations.” Guyatt G, BMJ 336, 2008 I find it a difficult concept. For reviews we look at QoE as certainty that we know the true effect. Here the idea goes further – the same level of certainty in effects may lead to different level of cerainty in recommendation (for example, inexpesive versus expensive intervention, availibility of alternatives)
")
16
QOE- Philosophical Bent
We are going to make recommendations that we (or others) will subsequently change. GRADE lets us: try to define how likely that is communicate our certainty in any effect translate findings to clinical realities, by accounting for the costs, tradeoffs and effort behind following a recommendation
 will subsequently change. GRADE lets us: try to define how likely that is. communicate our certainty in any effect. translate findings to clinical realities, by accounting for the costs, tradeoffs and effort behind following a recommendation.")
17
Example- Glycemic Control
2001: Van den Berghe publishes sentinel article: NEJM 2001, 345 : Guidelines, protocols, quality metrics proposed 2009: NICE SUGAR 2009-present: Re-write or retire

18
Be Explicit What are the data? What are their limitations?
How easy is it to do something? How confident are you in recommending?

19
The guidelines process: a methodologist’s perspective

20
Getting from evidence to guidelines
Evidence Hierarchy Guidelines Hierarchy Experience Reports Observational Studies RCTs Meta-analyses Clinical biases Experience-based tendencies Cost analyses Decision analyses Formal Guidelines Not all guidelines are created equal

21
(outcomes across studies) Evidence Profile (GRADEpro) 1
Formulate question Select outcomes Rate importance of outcomes Systematic Review (outcomes across studies) Evidence Profile (GRADEpro) 1 Pooled estimate of effect for each outcome 2 Quality of evidence for each outcome High Moderate Low Very low High | Moderate | Low | Very low Outcome1 Critical action PICO start RCT observational high low Outcome2 Critical risk of bias inconsistency indirectness imprecision publication bias Outcome3 Important Outcome4 Not rate down important large effect dose-response antagonistic bias rate up systematic review of evidence Guideline panel recommendation PICO – P: transfusions; I vs C: NA (versus dopamine); 4-6 vs 10-12; 110 vs 180; vs flat; O: bleeding vs mortality vs VAP; symtomatic vs. asymptomatic DVT Formulate recommendations For or against an action Strong or weak (strength) Strong or weak: Quality of evidence Balance benefits/downsides Values and preferences Resource use (cost) Rate overall quality of evidence across outcomes Wording “We recommend…” | “Clinicians should…” “We suggest…” | “Clinicians might…” unambiguous clear implications for action transparent (values & preferences statement)
 Evidence Profile (GRADEpro) 1. Pooled estimate of effect for each outcome. 2. Quality of evidence for each outcome. High Moderate Low Very low. High | Moderate | Low | Very low. Outcome1. Critical. action. PICO. start. RCT. observational. high. low. Outcome2. Critical. risk of bias. inconsistency. indirectness. imprecision. publication bias. Outcome3. Important. Outcome4. Not. rate down. important. large effect. dose-response. antagonistic bias. rate up. systematic review of evidence. Guideline panel. recommendation. PICO – P: transfusions; I vs C: NA (versus dopamine); 4-6 vs 10-12; 110 vs 180; vs flat; O: bleeding vs mortality vs VAP; symtomatic vs. asymptomatic DVT. Formulate recommendations. For or against an action. Strong or weak (strength) Strong or weak: Quality of evidence. Balance benefits/downsides. Values and preferences. Resource use (cost) Rate overall quality of evidence. across outcomes. Wording. We recommend… | Clinicians should… We suggest… | Clinicians might… unambiguous. clear implications for action. transparent (values & preferences statement)")
22
Question PICO Evidence Summarize Judge QOE SOR

23
The Question

24
PICO Population Intervention Comparison Outcome
Ventilated patients, APACHE scores Intervention Medicine, therapy, education, systems intervention Comparison High(how high) versus low (how low) tidal volume Outcome FBI: mortality (at what follow-up), LOS, VAP
 versus low (how low) tidal volume. Outcome. FBI: mortality (at what follow-up), LOS, VAP.")
25
Overall quality of evidence
Most systems just use evidence about primary benefit outcome But what about others (harms)? Options ignore all but primary any outcome blended approach crucial (critical) outcomes (SUP and pneumonia)
 Options. ignore all but primary. any outcome. blended approach. crucial (critical) outcomes (SUP and pneumonia)")
26
Rating outcomes 7-9: critical [death, disability or both]
4-6: important [skin breakdown, sepsis] 1-3: limited [ileus, ICU stay] The importance may be arbitrary – sepsis may be critical, so may be LOS
![Rating outcomes 7-9: critical [death, disability or both]](http://slideplayer.com/slide/4383176/14/images/26/Rating+outcomes+7-9%3A+critical+%5Bdeath%2C+disability+or+both%5D.jpg "4-6: important [skin breakdown, sepsis] 1-3: limited [ileus, ICU stay] The importance may be arbitrary – sepsis may be critical, so may be LOS.")
27
The evidence

28
Collect evidence Be thorough Use explicit search strategies
Decide on published v unpublished data Consider gray literature in some cases Proceedings papers Abstracts Clinicaltrials.gov ALWAYS consider comparator Sometimes, when faced with 50 questions, you may need to be pragmatic

29
Assembling Evidence is Hard
Data have to be summarized to inform

30
GRADE pragmatic approach
Get a good meta-analysis (MA) If no MA, identify main studies If possible, do your own MA If no MA, describe main studies/results Be explicit (inclusion/exclusion, flaws) Keep the link between recommendation and evidence
 If no MA, identify main studies. If possible, do your own MA. If no MA, describe main studies/results. Be explicit (inclusion/exclusion, flaws) Keep the link between recommendation and evidence.")
31
Meta Analysis- the Good and the Bad
One-stop synthesis Important detail lost Exploration of variability Heterogeneity Improve power N-omegalic significance Ideally- data shown as sum and parts A stew is the sum of its ingredients

32
Don’t GRADE everything
No plausible alternative Surveying for infection, resuscitating shock, practicing quality improvement Recommend to consider As opposed to not considering? Statements lacking specificity Intervention, Comparison, relevant Outcomes (good and bad)
")
33
judging

34
Judge Evidence and Recommendation
Unique to GRADE Related, but distinct Recommendation must take clinical realities into account Costs Burdens Benefits/risks Values

35
Recommendations Have 2 Components: Strength Direction

36
Grade components

37
Entering the GRADE meat-grinder
RCT- High quality Observational study- Low quality Expert report- Very Low quality

38
Entering the GRADE meat-grinder
RCT- High quality Observational study- Low quality Expert report- Very Low quality

39
Grade Down Study limitations Inconsistency Indirectness Imprecision
Publication Bias

40
Grade Down Study limitations Allocation concealment Inconsistency
Blinding Indirectness Loss to follow-up Imprecision No intent-to-treat Stopping early Publication Bias Failure to report outcomes Remember that you are looking at ‘number of studies’ at once

41
Study Limitations/Risk of Bias
Bias definition: 1. Unequal distribution of risk factors (confounders) across study groups. 2. Factors that systematically change study effects to result in a directional change in the signal.
 across study groups. 2. Factors that systematically change study effects to result in a directional change in the signal.")
42
Risk of Bias GRADE treats bias by individual outcomes
Pain scores- strong effect if unblinded Mortality- effect of blinding less clear Loss to follow-up for different outcome windows With multiple studies and different risks of bias, quality should be judged by the relative contribution of studies to the confidence in the effect.

43
Risk of Bias Blinding Concealment of allocation
Patient, clinician, data assessor Concealment of allocation Intention-to-treat principle Absence negates the balance from randomization

44
Risk of Bias Stopping Early for Benefit, especially if trials have < 500 events Brassler D, et al. JAMA, 2010;303(12):1180-7 Selective outcome reporting Only positive outcomes, composite results only, or lack of pre-specified outcomes Loss to follow-up Significance relates to # of events

45
Risk of bias- Observational Studies
Prognosis can differ Groups can have multiple differences: Time Place Population Co-morbidity This is why observational studies typically enter as “Low” quality of evidence

46
Grade Down Study limitations
Widely differing estimates of treatment effect Inconsistency Heterogeneity not explained Indirectness Differences: Imprecision Populations, interventions, outcomes Publication Bias

47
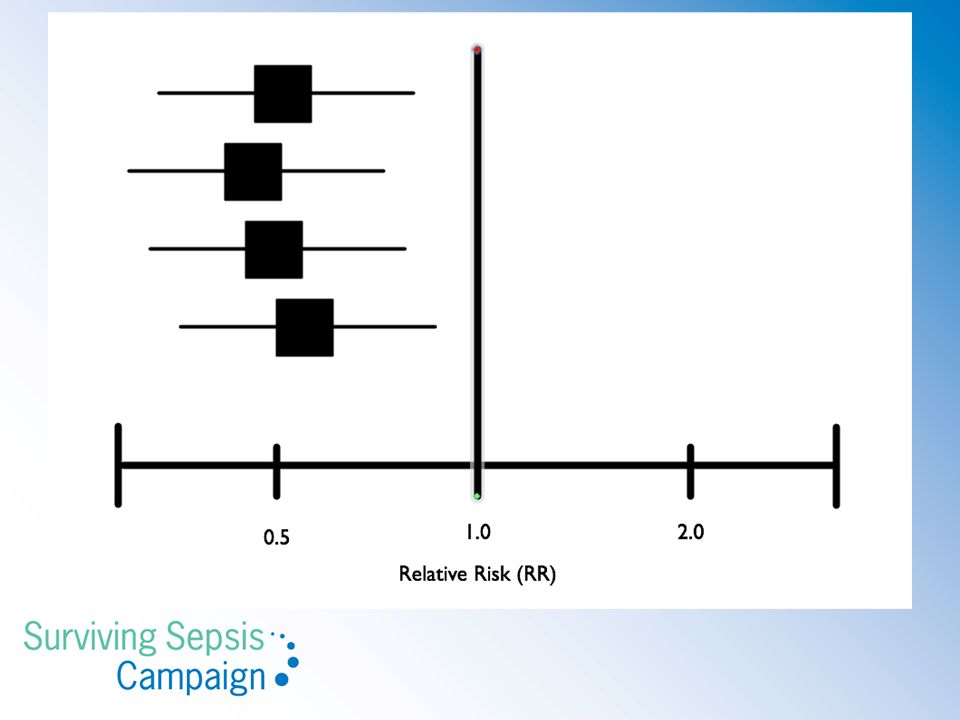
Inconsistency Definition: 1. Heterogeneity. 2. Lack of similarity of point estimates or confidence intervals. 3. Variable findings unexplained by a priori hypotheses. 4. Subgroup effects that cannot be sufficiently explained.

48
Inconsistency Generally, effects are looked at in relative terms, rather than absolute Subgroups may have different baseline rates, but similar relative effects

49
Inconsistency Inconsistency can come from study diversity:
Populations Interventions Outcomes Study methods Credible inconsistency may lead to split recommendations

50
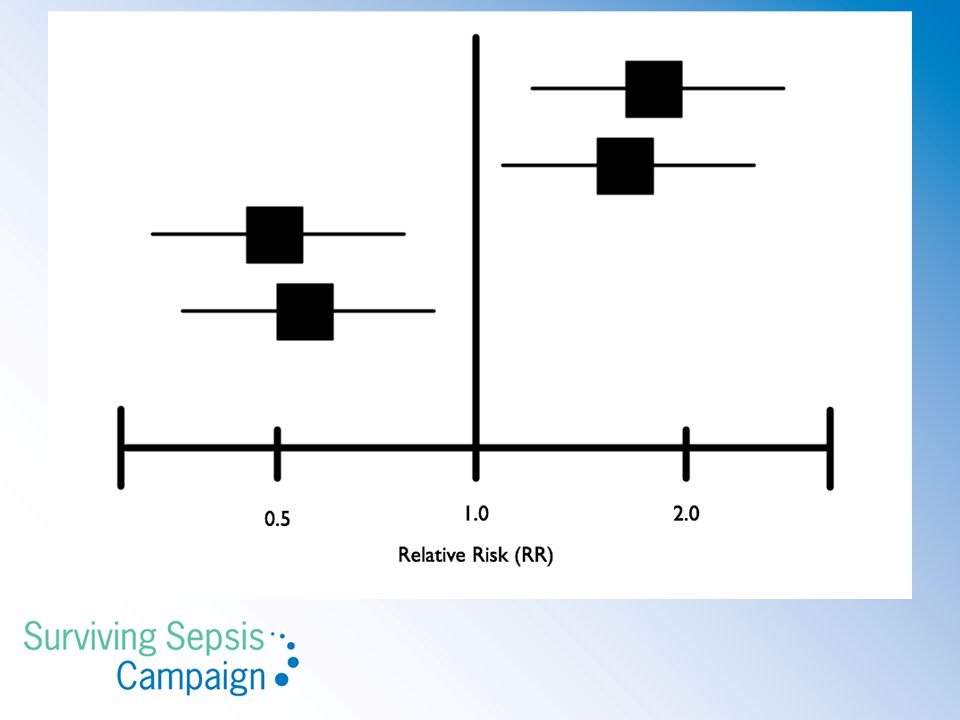
Basic assessments of inconsistency
Point estimates vary widely Little or no CI overlap Test of heterogeneity shows a low p value 𝛘2 I2 is large: (P ≤ 0.10 may be sufficient) -<40%: low -50-90%: substantial -30-60%: moderate %: considerable
 -<40%: low %: substantial %: moderate %: considerable.")
55
Context It is only significant inconsistency if the variability would influence a clinical decision If point estimates and CIs favor treatment over costs/burdens/side effects, no need to downgrade

56
Inconsistency Example: Low-dose steroids in sepsis:
6 studies, 3 high baseline mortality, 3 low, with difference in effect: Patel GP. Am J Respir Crit Care Med 2012;185: Placebo mortality: 30-63%

57
Grade Down Study limitations If a>>b and c>b, is a>c?
Inconsistency Differences from intervention and outcome of interest: Indirectness Imprecision population, intervention, comparator Publication Bias

58
Indirectness Definition: 1. Evidence does not directly compare to the clinical question of interest Differing patients, interventions, comparisons or outcomes in available studies necessitate extrapolation of evidence to question being addressed.

59
Indirectness Examples:
Animal studies: downgrade 1 or 2 levels, in general, but consider the relevance of the data (toxicity v therapeutic benefit) If drug A>B and B>C, is A>C? Low-fat diet: US versus French population Setting, co-”interventions,” genetics Surrogate outcomes: Blood pressure control versus cardiovascular events Vegetarians often have lifestyle differences from general population
 If drug A>B and B>C, is A>C Low-fat diet: US versus French population. Setting, co- interventions, genetics. Surrogate outcomes: Blood pressure control versus cardiovascular events. Vegetarians often have lifestyle differences from general population.")
60
Indirectness Example:
H2RA and PPI: C. Difficile infection: observational study not direct to critically ill patients, but with interesting effect: Very Low QOE Leonard J et al. Am J Gastroenterol 2007;102: 2047 Case-control study of inpatients and outpatients. Risk of GIB probably not the same.

61
Grade Down Study limitations Few patients, outcomes Inconsistency
Wide confidence intervals Indirectness Imprecision Publication Bias

62
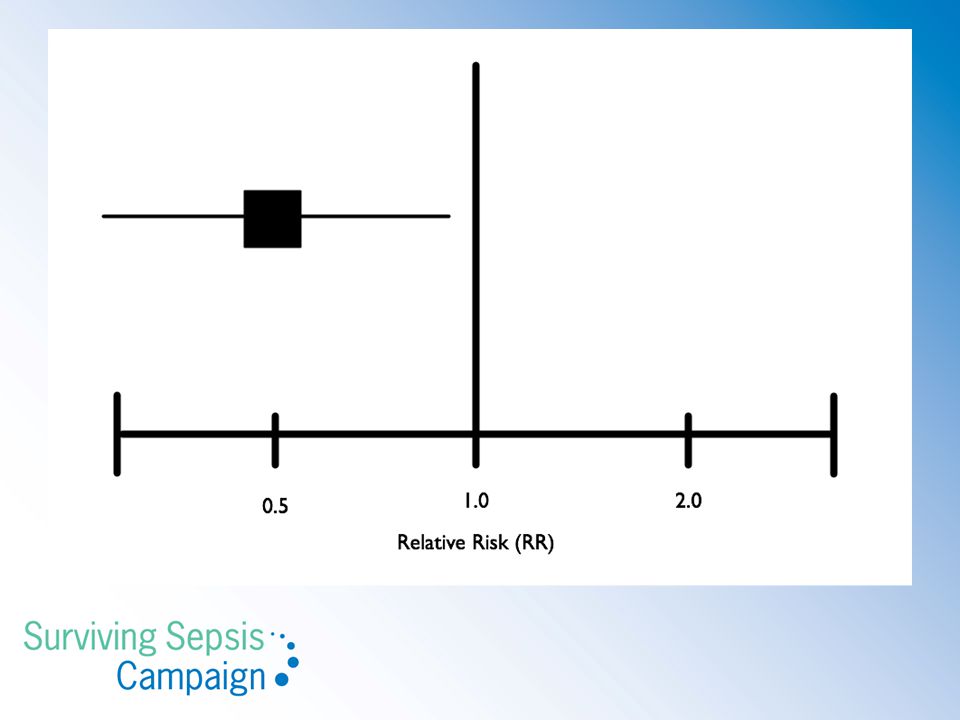
Imprecision Definition: 1. High impact of random error on evidence quality. 2. Wide range of results to be expected from repetitive study Wide range in which the truth likely lies.

63
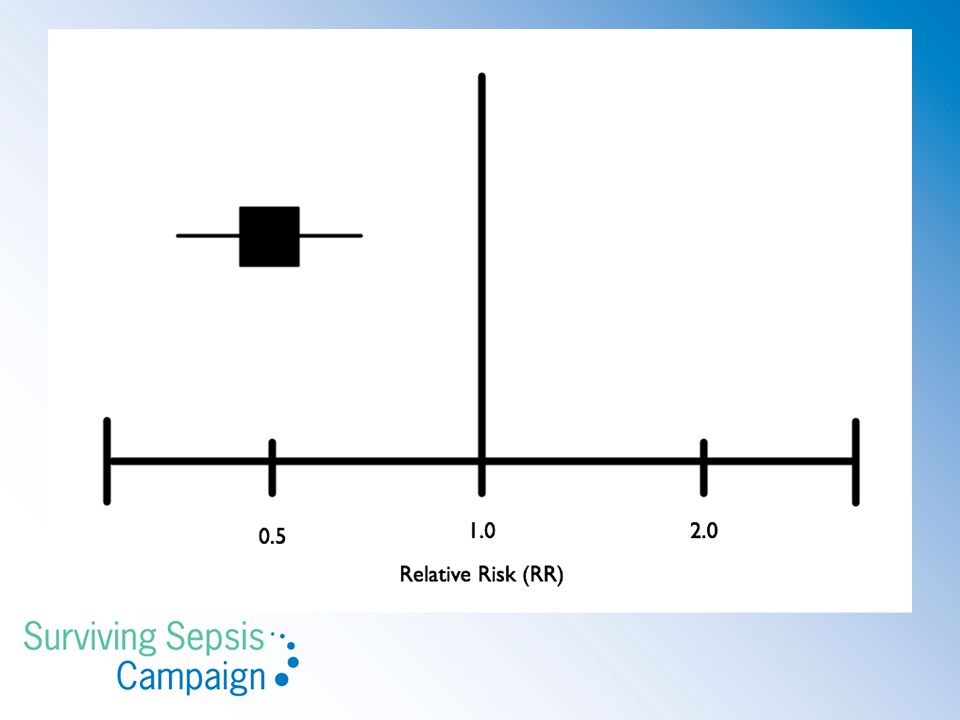
Imprecision Driven by # of events and by degree of effect
95% confidence intervals may encompass harm and benefit Taken in the context of the recommendation More important: 95% CIs embrace absolute values that reduce our confidence in a recommendation

64
With rare event, relative CIs can be broad, but absolute differences can be negligible, even when the intervals cross RR=1. Ex: 16/1482 v 19/1465 (RR 0.85(o.43, 1.66) for stroke with angioplasty v CEA. Absolute difference: (-0.5%, 1.0%): not clinically significant. Use absolute effects
: not clinically significant. Use absolute effects.")
65
You mean the difference not significant at either end of CI for Absolute
With rare event, relative CIs can be broad, but absolute differences can be negligible, even when the intervals cross RR=1. Ex: 16/1482 v 19/1465 (RR 0.85(o.43, 1.66) for stroke with angioplasty v CEA. Absolute difference: (-0.5%, 1.0%): not clinically significant.
 for stroke with angioplasty v CEA. Absolute difference: (-0.5%, 1.0%): not clinically significant.")
68
Toxicity

69
Imprecision Example: NE v Vasopressin: Mortality CI wide, spanned RR = 1. for ventricular arrhythmias, RR 0.47 (0.38, 0.58), but 21 events FRAGILE H2RA and pneumonia: unable to exclude harm Negative factors may require tighter CIs: Side effects/toxicity Burdens/costs
, but 21 events FRAGILE. H2RA and pneumonia: unable to exclude harm. Negative factors may require tighter CIs: Side effects/toxicity. Burdens/costs.")
70
Grade Down Study limitations Few trials Inconsistency Industry funding
Asymmetric Funnel plot Indirectness Imprecision Publication Bias

71
Publication Bias Definition: 1. Studies with statistically significant results more likely to be counted than negative studies. 2. Smaller, high-effect studies disproportionately impact published literature Published commercially-funded studies are more likely to be positive.

72
Publication Bias – Studies: delayed, obscure publication
Publication: + Studies > – Studies (RR 1.78) Hopewell S, The Cochrane Database of Systematic Reviews, 2007. – Studies: delayed, obscure publication + studies: duplicate publication Small studies, industry sponsor ⇒ ↑publication bias
 Hopewell S, The Cochrane Database of Systematic Reviews, – Studies: delayed, obscure publication. + studies: duplicate publication. Small studies, industry sponsor ⇒ ↑publication bias.")
73
Publication Bias How to detect? It’s more difficult than one might think. Look for: Small trials Conflicts in authors/study sponsors Duplications Abstracts, grey literature with negative findings Unpublished data Ideally, we would trend MAs over time

74
Publication Bias Pooled Estimate

75
Publication Bias Selective Publication Greater Study Limitations
More Restrictive/Responsive Population

76
Publication Bias

77
Publication Bias- Testing
Tests of asymmetry Imputing missing information Repeated MA over time

78
Publication Bias- Addressing the Problem
Thorough research Gray Literature FDA submissions Abstracts, proceedings Author Contact Clinicaltrials.gov N.B: only for RCTs, not observational studies

79
Grade Up Large magnitude of effect Dose response gradient
Bias likely to blunt results

80
Grade Up Large magnitude of effect
Stronger signals signal stronger evidence Dose response gradient Bias likely to blunt results

81
Grade Up Large magnitude of effect
Signal pattern consistent with physiologic model Dose response gradient Bias likely to blunt results

82
Grade Up Large magnitude of effect
Some studies run up against mitigating factors that work against them. Dose response gradient Bias likely to blunt results

83
Moving Up- Examples Very strong, consistent association; no plausible confounders, up 2 grades insulin in diabetic ketoacidosis antibiotics in septic shock Strong, consistent association with no plausible confounders up 1 grade

85
How to get GRADEpro on your computer?
Cochrane IMS website cc-ims.net/revman/gradepro/download Google ‘gradepro’

87
GRADE output: Summary of Findings

88
GRADE output: Evidence Profile
Question: Should longer term (7 day) low dose (up to 300 mg/day of hydrocortisone) glucocorticosteroids be used in severe sepsis and septic shock? Settings: ICU Bibliography: Annane 2009 Quality assessment Summary of findings Importance No of patients Effect Quality No of studies Design Limitations Inconsistency Indirectness Imprecision Other considerations longer term (7 day) low dose (up to 300 mg/day of hydrocortisone) glucocorticosteroi ds control Relative (95% CI) Absolute Mortality, 28 days 12 randomised trials no serious limitations serious1 no serious indirectness no serious imprecision none 236/629 (37.5%) 264/599 (44.1%) RR 0.84 (0.72 to 0.97) 71 fewer per (from 13 fewer to 123 fewer) ÅÅÅO MODERATE CRITICAL2 GI bleeding 3 no serious inconsistenc y3 serious4 65/827 (7.9%) 56/767 (7.3%) RR 1.12 (0.81 to 1.53) 9 more per (from 14 fewer to 39 more) IMPORTANT Superinfections 45 no serious inconsistenc y6 no serious imprecision7 184/983 (18.7%) 170/934 (18.2%) RR 1.01 (0.82 to 1.25) 2 more per (from 33 fewer to 46 more) ÅÅÅÅ HIGH Please notcie that these two slides use fdifferent body of evidence – one looks at 6 studies, one at 12. People may get confused. 1 Meta-regression examining the effect of severity of illness (baseline mortality) on efficacy suggested an effect - p value 0.04 using fixed effect and 0.06 using random effect model. JAMA 2009; 302: Reported for all trials 3 I2=0 4 RR up to need to check 6 I2=8%
 low dose (up to 300 mg/day of hydrocortisone) glucocorticosteroids be used in severe sepsis and septic shock Settings: ICU Bibliography: Annane Quality assessment. Summary of findings. Importance. No of patients. Effect. Quality. No of studies. Design. Limitations. Inconsistency. Indirectness. Imprecision. Other considerations. longer term (7 day) low dose (up to 300 mg/day of hydrocortisone) glucocorticosteroi ds. control. Relative (95% CI) Absolute. Mortality, 28 days. 12. randomised trials. no serious limitations. serious1. no serious indirectness. no serious imprecision. none. 236/629 (37.5%) 264/599 (44.1%) RR 0.84 (0.72 to 0.97) 71 fewer per 1000 (from 13 fewer to 123 fewer) ÅÅÅO MODERATE. CRITICAL2. GI bleeding. 3. no serious inconsistenc y3. serious4. 65/827 (7.9%) 56/767 (7.3%) RR 1.12 (0.81 to 1.53) 9 more per 1000 (from 14 fewer to 39 more) IMPORTANT. Superinfections. 45. no serious inconsistenc y6. no serious imprecision7. 184/983 (18.7%) 170/934 (18.2%) RR 1.01 (0.82 to 1.25) 2 more per 1000 (from 33 fewer to 46 more) ÅÅÅÅ HIGH. Please notcie that these two slides use fdifferent body of evidence – one looks at 6 studies, one at 12. People may get confused. 1 Meta-regression examining the effect of severity of illness (baseline mortality) on efficacy suggested an effect - p value 0.04 using fixed effect and 0.06 using random effect model. JAMA 2009; 302: Reported for all trials 3 I2=0 4 RR up to need to check 6 I2=8%")
89
Final QOE High: A , ++++, ↑↑↑↑ Medium: B, +++-, ↑↑↑ Low: C, ++--, ↑↑
Very Low: D, +---, ↑

90
Alternate QOE interpretation
High- Further research very unlikely to change confidence Moderate- likely to have an important impact Low- very likely to impact Very Low- uncertain

91
Separate QOE and Strength of Recommendation
GRADE’s defining feature Evidence: high or low quality? likelihood estimates are true and adequate Recommendation: weak or strong? confidence that following recommendation will cause more good than harm You see, this definition is for ‘systematic review’ = confidence in estimates, not that estimates support recommendation

92
Factors- STRONG vs WEAK
Balance good & bad QOE Uncertainty values preferences Cost

93
Factors- STRONG vs WEAK
Balance good & bad GI Bleed v C. Dificile QOE Uncertainty Early antibiotics v inappropriate antibiotics values preferences Cost

94
Factors- STRONG vs WEAK
Balance good & bad A or B can support STRONG QOE Uncertainty C or D should usually be WEAK values preferences Cost

95
Factors- STRONG vs WEAK
Balance good & bad Cancer remission v quality of life QOE Uncertainty Delirium v pain control values preferences Cost

96
Factors- STRONG vs WEAK
Balance good & bad $/QALY QOE Uncertainty Allocating limited resources values preferences Cost Burdens for patients and providers

97
STRONG to stakeholders
Patient: most people would want it Clinician: most should receive, uniform behavior Policymaker: adopt as policy, use as quality indicator

98
WEAK to stakeholders Patient: many people would not want it
Clinician: help patient make a balanced decision decision aid might be needed Policymaker: debate

99
Final Strength of Recommendations
STRONG: WEAK: do it, or don’t do it probably do it, or probably don’t “We recommend” “We suggest” GRADE 1 GRADE 2

100
(outcomes across studies) Evidence Profile (GRADEpro) 1
Formulate question Select outcomes Rate importance of outcomes Systematic Review (outcomes across studies) Evidence Profile (GRADEpro) 1 Pooled estimate of effect for each outcome 2 Quality of evidence for each outcome High Moderate Low Very low High | Moderate | Low | Very low Outcome1 Critical action PICO start RCT observational high low Outcome2 Critical risk of bias inconsistency indirectness imprecision publication bias Outcome3 Important Outcome4 Not rate down important large effect dose-response antagonistic bias rate up systematic review of evidence Guideline panel recommendation PICO – P: transfusions; I vs C: NA (versus dopamine); 4-6 vs 10-12; 110 vs 180; vs flat; O: bleeding vs mortality vs VAP; symtomatic vs. asymptomatic DVT Formulate recommendations For or against an action Strong or weak (strength) Strong or weak: Quality of evidence Balance benefits/downsides Values and preferences Resource use (cost) Rate overall quality of evidence across outcomes Wording “We recommend…” | “Clinicians should…” “We suggest…” | “Clinicians might…” unambiguous clear implications for action transparent (values & preferences statement)
 Evidence Profile (GRADEpro) 1. Pooled estimate of effect for each outcome. 2. Quality of evidence for each outcome. High Moderate Low Very low. High | Moderate | Low | Very low. Outcome1. Critical. action. PICO. start. RCT. observational. high. low. Outcome2. Critical. risk of bias. inconsistency. indirectness. imprecision. publication bias. Outcome3. Important. Outcome4. Not. rate down. important. large effect. dose-response. antagonistic bias. rate up. systematic review of evidence. Guideline panel. recommendation. PICO – P: transfusions; I vs C: NA (versus dopamine); 4-6 vs 10-12; 110 vs 180; vs flat; O: bleeding vs mortality vs VAP; symtomatic vs. asymptomatic DVT. Formulate recommendations. For or against an action. Strong or weak (strength) Strong or weak: Quality of evidence. Balance benefits/downsides. Values and preferences. Resource use (cost) Rate overall quality of evidence. across outcomes. Wording. We recommend… | Clinicians should… We suggest… | Clinicians might… unambiguous. clear implications for action. transparent (values & preferences statement)")
101
Useful Resources BMJ: GRADE series GRADE Introduction:
Overview of Quality of Evidence: BMJ 2008;336; Translating Evidence to Recommendations: BMJ 2008;336; How to handle disagreements in guidelines panels: BMJ 2008;337:a744

102
Useful Resources II Journal of Clinical Epidemiology
GRADE Guidelines Series: April, 2011 (64(4)): 1-4 Intro, framing the question and outcomes, rating quality of evidence, risk of bias December, 2011 (64(12)): 5-9 Publication bias, imprecision, inconsistency, indirectness, rating up
): 1-4. Intro, framing the question and outcomes, rating quality of evidence, risk of bias. December, 2011 (64(12)): 5-9. Publication bias, imprecision, inconsistency, indirectness, rating up.")
103
Useful Resources II Journal of Clinical Epidemiology
GRADE Guidelines Series: April, 2011 (64(4)): 1-4 Intro, framing the question and outcomes, rating quality of evidence, risk of bias December, 2011 (64(12)): 5-9 Publication bias, imprecision, inconsistency, indirectness, rating up
): 1-4. Intro, framing the question and outcomes, rating quality of evidence, risk of bias. December, 2011 (64(12)): 5-9. Publication bias, imprecision, inconsistency, indirectness, rating up.")
Similar presentations


 Director of Evidence-Based Practice, Quality Management Assistant.>")


 Methodology.>")
 - Surrogate end points - Quality of the performed.>")


 Nancy Santesso McMaster University.>")
 Working Group www.gradeworkinggroup.org.>")

