Download presentation
Presentation is loading. Please wait.

3
Table of contents M. McKenzie Guidelines on the selection of innovative techniques for the rehabilitation of concrete highway structures3 A. ŽnidaričOptimised assessment of bridges31 E. Denarié Ultra High Performance Fibre Reinforced Concretes (UHPFRC) for rehabilitation – 1. Motivation and Background69 M. Richardson Guidance on use of surface-applied corrosion inhibitors Context and Framework of Guidance97 A. Žnidarič Optimised assessment of bridges Case study 1 - Medno bridge - Soft Load Testing 135 A. O’ConnorOptimised assessment of bridges Case study 2 – Danish examples149 JC. PutallazUltra High Performance Fibre Reinforced Composites (UHPFRC) for rehabilitation - 2. Case study – first application165 M. Richardson Guidance on use of surface-applied corrosion inhibitors Workshop on detailed guidance and Case Studies 197 E. BrühwilerAdvances in rehabilitation of highway structures Discussion, Summary and Perspectives 233
 for rehabilitation – 1. Motivation and Background69 M. Richardson Guidance on use of surface-applied corrosion inhibitors Context and Framework of Guidance97 A. Žnidarič Optimised assessment of bridges Case study 1 - Medno bridge - Soft Load Testing 135 A. O’ConnorOptimised assessment of bridges Case study 2 – Danish examples149 JC. PutallazUltra High Performance Fibre Reinforced Composites (UHPFRC) for rehabilitation - 2. Case study – first application165 M. Richardson Guidance on use of surface-applied corrosion inhibitors Workshop on detailed guidance and Case Studies 197 E. BrühwilerAdvances in rehabilitation of highway structures Discussion, Summary and Perspectives 233.")
5
Guidelines on the selection of innovative techniques for the rehabilitation of concrete highway structures Malcolm McKenzie TRL Ltd, UK

6
Development Team Richard Woodward, TRL Ltd Team: Ales ŽnidaričZAG Mark RichardsonUCD Emmanuel DenariéEPFL Tomasz WierzbickiIBDIM Alan O’ConnorTCD Professor Joan CasasUPC Ciaran McNallyUCD Malcolm McKenzie TRL Bill McMahon TRL

7
Overview Guidelines and innovation Deteriorating concrete structures Selecting the ‘best’ rehabilitation option for a structure Special procedures for innovative techniques Ranking projects when budgets are limited GUIDELINES NOT RULES

8
Guidelines and innovation Innovation is an essential part of engineering development Materials and techniques are always being improved There are acknowledged problems with existing rehabilitation techniques Cautious approach aimed at controlling risks and developing experience Yesterday’s innovation is today’s tradition

9
Concrete bridge deterioration

10
Some deterioration mechanisms Reinforcement corrosion Alkali silica reaction Freeze/thaw effects Sulfate attack Cracking (settlement, thermal) Overloading Impact damage
 Overloading Impact damage")
11
Identification of problem Cause Extent Importance based on Inspection Structural Assessment

12
MAINTENANCE OPTIONS Do nothing Monitor further deterioration Carry out remedial treatment Carry out strengthening Replace element or structure

13
Procedure Is option innovative Identify need Select & rank rehabilitation option Control risks Y Apply Technique N Options Available

14
Innovative techniques: additional risk Lack of a long established track record Uncertainties in: Conditions under which they will be effective Side effects Long term durability Implications for future maintenance Monitoring effectiveness

15
Balance conflicting Issues Technical aspects need to be considered along with other relevant factors to meet the needs of current and future customers. COSTTIMEENVIRONMENT

16
Wallet Cost of repairs Running costs Impact on local economy Cost of delays Affordability Renewal costs

17
Watch Time of works User delays When Life of repair

18
World User delays Raw materials Energy usage Transport of materials Noise Pollution Aesthetics

19
Rigorous Engineering Judgement Decision making - WWW

20
Rigorous approach Methodology Convert everything to financial value Minimise cost over life of structure Problems Conversion to money Lack of data Not practicable

21
Engineering Judgement Advantages Simple to use Allows engineer to take all factors into consideration Problems Subjective Decisions could vary

22
Structured Engineering Judgement Formalise the decision making process Justification of decisions at each stage Best option for a structure Rank individual projects Independent review eg via a Workshop

23
Decision criteria Define objectives of the rehabilitation Define factors to be considered Define decision criteria Basis of comparison eg whole life cost Relative importance of each factor Subjective or numerical approach

24
Select rehabilitation options Identify potential options Implications of using an innovative technique Assessment of options in relation to decision criteria taking account of any additional actions resulting from innovative procedure Recommend option(s)
")
25
Assessing innovative techniques Desk study of structure and environmental conditions relevant to technique Laboratory testing Feasibility trials Cost/time implications

26
Select technique - 1 Example: Reinforcement corrosion Early Stages Few visible defects Low levels of chloride Half-cell potentials mainly passive Low corrosion currents Preventative maintenance Slow down chloride ingress eg surface treatment Corrosion inhibitors to prevent corrosion?

27
Select technique - 2 Example Reinforced concrete Visible defects Higher chloride levels More negative half cell potentials Higher corrosion currents Concrete repairs Electrochemical techniques Corrosion inhibitors to reduce corrosion rates??

28
Prioritise competing projects Risk associated with not carrying out maintenance What is the consequence of this occurring? Safety Functionality Sustainability Environment What is the likelihood of this occurring?

29
Prioritisation – Scoring This comprises three parts: Risks averted Added value Timing All ranked on a numerical basis

30
Procedure Is option innovative Identify need Select & rank rehabilitation option Control risks Y Apply Technique N Options Available Inspection Assessment Innovative techniques Decision User Experience

31
Guidelines and innovation It is wise to be cautious in the use of innovative techniques It is foolish to be over-cautious Engineers need to take controlled risks to grow confidence in new techniques Today’s innovation is tomorrow’s tradition

32
THANK YOU FOR YOUR ATTENTION

33
Optimised assessment of bridges Aleš Žnidarič Slovenian National Building and Civil Engineering Institute

34
Contents General about bridge assessment Load testing Traffic loading Static Dynamic Conclusions

35
Why optimised assessment?

36
Design vs. assessment new bridges are designed conservatively: uncertainty about increased loading inexpensive to add capacity assessment should be less conservative: expensive to strengthen/replace or post a bridge capacity and loading can be measured / monitored

37
Design vs. Assessment New bridges : high uncertaint ies : conservative capacity design loading schemes design methods high safety factors unnecessary: costly rehabilitation load limits Existing bridges : better defined inputs: realistic capacity realistic loading assessment methods lower safety factors savings : cheaper rehabilitation posting of bridges

38
Why optimised assessment? to select optimal rehabilitation measures: do nothing protect repair strengthen replace

39
Assessment of existing bridges Important factors : condition, level of damage structural safety: carrying capacity loading (dead, traffic, dynamic loading) reliability of data serviceability (clearances, traffic, obsoleteness) service life, importance 1.What is the carrying capacity? age, condition, drawings… 2.What is the real behaviour? influence lines load distributions 3.What is the real loading? in a country, type of road, on specific bridge dynamic amplification 5-level assessment

40
Condition assessment Objectives: Detect possible deterioration processes Indication of the condition of: structure its elements highway structure stock Ranking the structures Optimisation of budget allocation

41
Condition assessment Influencing factors affecting deterioration: Design stage: Detailing Durability Materials Construction stage Loadings Maintenance

42
Condition assessment D19. Report on assessment of structures in selected countries: condition rating: Cumulative Highest value 4 factors: 1.Type of damage and its affect on the safety, serviceability and/or durability 2.Maximum intensity 3.Influence of the affected structural member on safety, serviceability and durability of the whole structure or its component 4.Extent and expected propagation

43
Condition assessment Handbook of damages: http://defects.zag.si/ http://defects.zag.si/ 10 types of damages descriptions: affected bridge component influencing factor: design, material, construction, overloading, environment and maintenance specific influencing factor additional data or explanations photos Living application

44
Safety assessment to verify that a structure has adequate capacity to safely carry or resist specific loading levels: R>S Load testing Live load assessment (static and dynamic) How to relate condition and capacity?
 How to relate condition and capacity")
45
Load testing on bridges that seem to carry out normal traffic satisfactorily, but fail to pass the assessment calculation the available model of the bridge does not perfectly match with the real bridge itself to supplement and check the assumptions and simplifications made in the theoretical assessment To optimise bridge assessment by finding reserves in load carrying capacity

46
Load testing benefits: less severe rehabilitation measures less traffic delays tremendous savings drawbacks: very costly danger of damaging the structure best candidates: difficult structural modelling lack of documentation (drawings, calculations,…) when savings are greater than the cost of load test
 when savings are greater than the cost of load test")
47
Load testing Types of load test: proof diagnostic soft

48
Soft load testing - advantages the lowest level of load application uses bridge WIM to provide: “normal” traffic data information about structural behaviour of the bridge: influence lines statistical load distribution impact factors from normal traffic. “quick&cheap”: no need for pre-weighed vehicles no need to close the traffic no risk of overloading and damaging of the structure

49
BWIM shema Strain measurements Axle detection

50
Soft load testing Theoretical vs. measured influence line

51
Soft load testing – limitations not intended to predict the ultimate state behaviour validity of bridge assessment is often short-term and depends on the level of safety if higher traffic loading is expected, measurements should be extended or replaced by a normal diagnostic load test the soft load testing procedure has only been tested and used on bridges shorter than 40 m requires an experienced engineer who can realistically evaluate situation

52
Traffic load modelling calibrated notional load models (loading schemes) for: design assessment (rating loading schemes) site specific modelling based on traffic data: Monte Carlo simulation simplified models (convolution)
 for: design assessment (rating loading schemes) site specific modelling based on traffic data: Monte Carlo simulation simplified models (convolution)")
53
Truck histograms from Europe

54
There is an urgent need for effective overload enforcement – better compliance with legal limits will greatly reduce traffic loading on bridges.

55
Comparison of sites in NL and SI

56
Dynamic Amplification Factor problem: combining the extremes of dead load and dynamic effects => very high DAF options: codes – conservative modelling – time-consuming and difficult due to many unknowns measurements – promising, but only possible since recent development of bridge WIM systems

57
Dynamic Amplification Factor Case Study Calculating dynamic amplification for 1000-year extreme loading event: Mura River Bridge, Slovenia 2 lanes, opposing directions extensive Monte Carlo static load simulation – 10 years identified 100 max-per- month static loading events

58
Dynamic Amplification Factor Case Study FE model of bridge and 5-axle articulated vehicles Calibrated by site measurement Considered edge beam Found total effect for each max-per-month event

59
Dynamic Amplification Factor Case Study Max-per-month Data of static vs. total Fit to bivariate extreme value distribution Extrapolated the trend to the 1000-year situation Dynamics was very small – less than 6%

60
Dynamic Amplification Factor SAMARIS experiment: 31-m long span to assess influence of pavement unevenness to evaluate DAF for 1000’s of vehicles upgraded SiWIM system

62
Dynamic Amplification Factor

64
Before resurfacing

65
Dynamic Amplification Factor After resurfacing

66
Dynamic Amplification Factor Average valueCoefficient of variation

67
Conclusions (1/2) Design conservatively, assess optimally Proper assessment (with monitoring) can: prove that many existing bridges are safe in their current condition for their current loading: factors from Eurocodes are too high for assessment of existing bridges traffic patterns in EU, EEA and CEC are different carrying capacity is higher than expected justify optimal rehabilitation measures save a lot of money
 Design conservatively, assess optimally Proper assessment (with monitoring) can: prove that many existing bridges are safe in their current condition for their current loading: factors from Eurocodes are too high for assessment of existing bridges traffic patterns in EU, EEA and CEC are different carrying capacity is higher than expected justify optimal rehabilitation measures save a lot of money")
68
Conclusions (2/2) soft load testing is proposed as a simpler way of defining real bridge behaviour dynamic amplification factors for the extreme load cases are considerably lower than specified in the design codes additional topics in the D30: factors required for efficient bridge inspection specifications for diagnostic load test several case studies
 soft load testing is proposed as a simpler way of defining real bridge behaviour dynamic amplification factors for the extreme load cases are considerably lower than specified in the design codes additional topics in the D30: factors required for efficient bridge inspection specifications for diagnostic load test several case studies")
69
Acknowledgment WP 15 team: ZAG Ljubljana: Igor Lavrič, Jan Kalin UCD Dublin: Prof. Eugene O’Brien, Colin Caprani, Gavin OConnell, Abraham Getachew TCD Dublin (now Rambøll): Alan O’Connor UPC Barcelona: Prof. Joan Casas IBDiM Warsaw: Tomasz Wierzbicki
: Alan O’Connor UPC Barcelona: Prof. Joan Casas IBDiM Warsaw: Tomasz Wierzbicki.")
71
Ultra High Performance Fibre Reinforced Concretes (UHPFRC) for rehabilitation – 1. Motivation and Background Emmanuel Denarié Laboratory for Maintenance and Safety of Structures (MCS)
.")
72
OUTLINE 1.Introduction 2.UHPFRC materials 3.What is proposed? 4.Why? 5.Validation 6.Conclusions 7.Acknowledgements

73
1. Introduction Road networks = variety of structures, with a variety of sizes, geometries, local conditions, and …common weak zones

74
Exposures to environmental loads Most severe = contact with liquid water - XD2, XD3, XA2,3 Reinforced concrete cannot withstand it for a long time !

75
2. UHPFRC materials Ultra compact cementitious matrix Multilevel fibrous reinforcement Outstanding mechanical and protective properties CEMTEC multiscale ® developed by Rossi et al. (2002) “Selfcompacting” “Ductile as steel”
 Selfcompacting Ductile as steel .")
76
UHPFRC composition Silica fume - SF/C = 0.26 (mass) Superplasticizer – SP/C = 1 % (mass, dry extract) Water/Binder = 0.125 to 0.140 Cement: 1051 to 1434 kg/m 3 Microsilica Cement CEM I 52.5 Fine sand D max =0.5 mm Matrix
 Superplasticizer – SP/C = 1 % (mass, dry extract) Water/Binder = to Cement: 1051 to 1434 kg/m 3 Microsilica Cement CEM I 52.5 Fine sand D max =0.5 mm Matrix")
77
UHPFRC composition Steel wool + 10 mm/0.2 mm straight fibres Total dosage 468 - 706 kg/m 3 (6 to 9 % Vol.) Fibrous reinforcement Microfibres Steel wool Macrofibres L=10 mm, D=0.2 mm CEMTEC multiscale ® developed by Rossi et al. (2002)
.")
78
Fractured surface of UHPFRC with pulled-out steel fibres 10 mm

79
3. What is proposed ? Long-lasting, targeted « hardening » of critical zones subjected to severe mechanical and environmental loads « Apply an everlasting winter coat on bridges »

80
Concept of application Cast in place waterproof UHPFRC overlay No thermal treatment, moist curing 8 days Pavement applied without waterproofing membrane « An everlasting wintercoat for bridges »

81
Concept of application Combine UHPFRC and rebars to reinforce structures « An everlasting wintercoat for bridges »

82
3. Why ? Rehabilitation works are becoming the dominant activity in road construction Consider impact on a network and society ! Rehabilitations are too often short lived ! Increase load carrying capacity without increasing deadweight Limit duration and number of interventions during service life simplify and shorten ! Combine materials in efficient structures !

83
4. Validation Method of concrete replacement Study composite UHPFRC-concrete construction Consider local conditions Application on inclined substrates « New material » Test on a wide range of scales of time and dimensions Provide guidelines for design and use Validate use with existing facilities and tools

84
Replacement of existing concrete Successful « Structural rehabilitations » are a major challenge Major issues: Processing Monolithic behaviour Protective function Mechanical performance Durability

85
Restrained shrinkage Silfwerbrand (1997) Stress = stiffness × free strain × degree of restraint Stiffness: f(E mod, creep/relaxation) material property, Free strain: material property Degree of restraint: structural property Typical values: -New layer on bridge deck slab: 0.4 to 0.6 -New layer on stiff beams: 0.6 to 0.8 -New kerb cast on bridge deck: 0.75 -Full restraint: 1.00 Study structural configurations with various degrees of restraint
 Stress = stiffness × free strain × degree of restraint Stiffness: f(E mod, creep/relaxation) material property, Free strain: material property Degree of restraint: structural property Typical values: -New layer on bridge deck slab: 0.4 to 0.6 -New layer on stiff beams: 0.6 to 0.8 -New kerb cast on bridge deck: Full restraint: 1.00 Study structural configurations with various degrees of restraint")
86
Summary of R & D works Ongoing studies at MCS-EPFL since 1999. Early age and long term behaviour of composite members with UHPFRC Composite structural members with UHPFRC, with various geometries: beams, slabs, walls Fatigue of composite members with UHPFRC Tensile behaviour of UHPFRC Effect of damage on permeability of UHPFRC Time-dependent behaviour of UHPFRC (creep, shrinkage) Combination of UHPFRC with reinforcement bars Rheological behaviour at fresh state Numerical modelling and design tools
 Combination of UHPFRC with reinforcement bars Rheological behaviour at fresh state Numerical modelling and design tools.")
87
Range of studies Creep, shrinkage, permeability Structural response Resistance

88
Uniaxial tensile response – strain hardening Modulus of elasticity 30 % higher than normal concretes Tensile strength of matrix 3 to 4 x higher than normal concrete Finely distributed multiple cracking during hardening phase Similarity with yielding of metals (Luders strips) CEMTEC multiscale ® Mechanical properties Denarié et al. (2006) UHPFRCNC Compressive strength [MPa]160-250 ~ 40 E modulus[GPa]48-60 ~ 35 Tensile strength [MPa]9-20 ~ 3 Strain hardening [%]0.05 - 0.2 0 First crack strength [MPa]7-16 ~ 3 NC: Normal Concrete General overview
 UHPFRCNC Compressive strength [MPa] ~ 40 E modulus[GPa]48-60 ~ 35 Tensile strength [MPa]9-20 ~ 3 Strain hardening [%] First crack strength [MPa]7-16 ~ 3 NC: Normal Concrete General overview.")
89
Structural response Flexural tests on composite beams with UHPFRC, Habel (2004) Effect of new UHPFRC layer thickness (h u ) Effect of combination of UHPFRC with rebars
 Effect of new UHPFRC layer thickness (h u ) Effect of combination of UHPFRC with rebars")
90
Flexural tests on composite beams with UHPFRC, Habel (2004) UHPFRC alone = significant stiffening UHPFRC + rebars = stiffening + increase of load carrying capacity Structural response NL: 10 cm NL: 5 cm New layer: UHPFRC New layer: UHPFRC + rebars
 UHPFRC alone = significant stiffening UHPFRC + rebars = stiffening + increase of load carrying capacity Structural response NL: 10 cm NL: 5 cm New layer: UHPFRC New layer: UHPFRC + rebars")
91
Analytical modelling Composite UHPFRC-Concrete structures = multi-layer systems Tensile behaviour of UHPFRC can be taken into consideration Take eigenstresses into consideration for design ! Tensile response of UHPFRC Habel (2004) Compression - UHPFRC Tension – UHPFRC UHPFRC Reinforced Concrete
 Compression - UHPFRC Tension – UHPFRC UHPFRC Reinforced Concrete.")
92
Main results of R & D works - 1 UHPFRC and concrete behave monolithically in composite members, up tp ULS, Habel (2004). Interface roughness of 5 mm with wavelength 15 mm is sufficient for monolithic behaviour, Wuest et al. (2005), Herwig et al. (2005) UHPFRC exhibit moderate shrinkage (0.6 ‰ after 3 month), and significant viscoelasticity, (creep coeff ~ 0.8) Habel (2004), Kamen et al. (2005), AFGC (2002).
, Herwig et al. (2005) UHPFRC exhibit moderate shrinkage (0.6 ‰ after 3 month), and significant viscoelasticity, (creep coeff ~ 0.8) Habel (2004), Kamen et al. (2005), AFGC (2002)..")
93
Main results of R & D works - 2 Under full restraint (worst case), eigenstresses under shrinkage remain moderate ( ~ 50 % of tensile strength), Kamen et al. (2005) Eigenstresses decrease the apparent tensile strength of UHPFRC in composite members, Habel (2004), Clevi (2005), Sadouki et al. (2005) consider for design Anisotropic orientation of fibres, function of application consider impact on properties
 Eigenstresses decrease the apparent tensile strength of UHPFRC in composite members, Habel (2004), Clevi (2005), Sadouki et al. (2005) consider for design Anisotropic orientation of fibres, function of application consider impact on properties.")
94
Main results of R & D works - 3 Very low transport properties for liquids (sorptivity) and gases, Charron et al. (2004). Up to equivalent crack openings of 0.1 mm (strain of 0.1 %) permeability remains very low, Charron et al. (2004), and behaviour under fatigue loading is controlled, Herwig (2005). Self-healing capacity for microcracks Promissing combination of UHPFRC with rebars, for reinforcement of structures, with no increase of dead weight, Brühwiler et al. (2005), Habel (2004), Wuest et al. (2005).
. Up to equivalent crack openings of 0.1 mm (strain of 0.1 %) permeability remains very low, Charron et al. (2004), and behaviour under fatigue loading is controlled, Herwig (2005). Self-healing capacity for microcracks Promissing combination of UHPFRC with rebars, for reinforcement of structures, with no increase of dead weight, Brühwiler et al. (2005), Habel (2004), Wuest et al. (2005)..")
95
Geometries of application P: UHPFRC h u = 15 to 30 mm = Protection PR: UHPFRC + replacement of corroded rebars (h u ~ 50 mm) = Reinforcement R: UHPFRC + additional rebars (h u >=50 mm) = Reinforcement Habel et al. (2004)
.")
96
Recommandation : UHPFRC Apply UHPFRC where it is worth it! For zones of severe exposure classes (XD2,3, evt. XA2,3)! To improve existing or new structures!
. To improve existing or new structures!.")
97
7. Conclusions «Targeted local hardening» of highway structures, in most critical zones, by using UHPFRC. Simplification of the construction process. Reduction of the dead loads (superstructure and pavement). Increase of the performance of existing and new structures (protection and reinforcement). Dramatic decrease of the number and severity of interventions during service life. Concept has been technically validated on a wide range of scales and duration
. Increase of the performance of existing and new structures (protection and reinforcement). Dramatic decrease of the number and severity of interventions during service life. Concept has been technically validated on a wide range of scales and duration.")
98
Acknowledgements UHPFRC team of MCS-EPFL: Prof. Eugen Brühwiler, John Wuest, Aicha Kamen, Andrin Herwig, Dr. Katrin Habel*, Prof. J.P. Charron*, Roland Gysler, Sylvain Demierre, * Former collaborators of MCS-EPFL Partners in Project SAMARIS Dr. P. Rossi Dr. R. Woodward

99
Guidance on use of surface-applied corrosion inhibitors Context and Framework of Guidance Mark Richardson University College Dublin

100
Work Package Team UCD M. Richardson (Team Leader), C. McNally, T. A. Soylev. E. Grimes ZAG A. Legat TRL M. McKenzie Sika P. Mulligan, B. Marazzani, M. Donadio Cardiff University B. Lark C-Probe Systems Limited / Structural Healthcare Associates G. Jones

101
Outline Background – Methodology, Concept, Motivation Objectives of SACI in a Maintenance Strategy – Reactive and Proactive Context Primary Factors Influencing Effectiveness Framework of Guidance for Specifiers of SACI

102
Background to SACI Methodology Concept Motivation

103
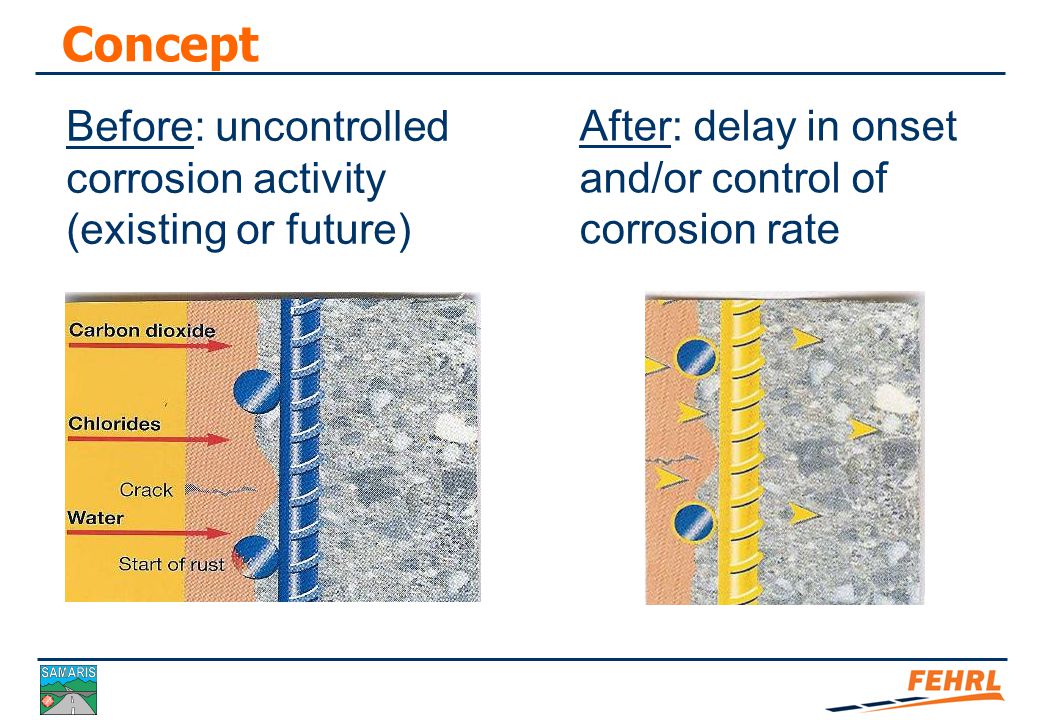
Methodology SACI are applied to mature concrete surfaces where they are absorbed. Penetrate through the cover concrete by capillary action and diffusion. Form a protective layer on the reinforcement.

105
Concept Before: uncontrolled corrosion activity (existing or future) After: delay in onset and/or control of corrosion rate
 After: delay in onset and/or control of corrosion rate")
106
Evans Diagram Potential (E) anodic reaction cathodic reaction Current (I)
 anodic reaction cathodic reaction Current (I)")
107
Potential (E) E corr I corr I corr Current (I)
 E corr I corr I corr Current (I)")
108
After inhibitor application Potential (E) Current (I)
 Current (I)")
109
After inhibitor application Potential (E) E corr I corr I corr Current (I)
 E corr I corr I corr Current (I)")
110
Motivation Benefit of SACI compared to ‘traditional’ repair option Reduce disruption to road users during rehabilitation of structure by time and access efficiency Sustainability aspect in preventative maintenance Arrest deterioration before it becomes significant and costly to repair

111
Objectives of SACI in Maintenance Strategy Objectives related to overall maintenance strategy Specifically consider objectives in ‘Reactive’ and ‘Proactive’ strategies

112
Reactive Maintenance Strategy Inhibitor may be used to reduce (or at least prevent an increase) in the rate of corrosion, thus extending residual service life, unless extent of corrosion is too advanced.
 in the rate of corrosion, thus extending residual service life, unless extent of corrosion is too advanced.")
114
However in a more general context note that: Repair occurs when deterioration is apparent and possibly significant Residual capacity of existing structure may be significantly diminished at time of intervention

115
Proactive Maintenance Strategy Inhibitor may be used to delay the onset of depassivation and thereafter positively influence the rate of corrosion, thus extending residual service life.

117
Also in a more general context note that: Measures for performance monitoring of the structure could be included at time of repair. Inhibitor may be subsequently reapplied (e.g. a decade later) if performance monitoring indicates it is warranted, before deterioration becomes significant.
 if performance monitoring indicates it is warranted, before deterioration becomes significant..")
118
Parameter Time Resistance Rp, Corrosion rate, µm/yr Inhibitor applied Inhibitor re-applied

119
Primary Factors Influencing Effectiveness Effectiveness is influenced by: Ability of surface to ‘take up’ the inhibitor Ability of inhibitor to penetrate the cover concrete Ability of inhibitor to form a layer on the reinforcement Ability of inhibitor to sustain the protective layer

120
Appropriateness of SACI Appropriateness of SACI therefore depends on the following primary factors: Degree of saturation of concrete Permeability characteristics of concrete Corroded state of reinforcement at time of repair Chloride levels

121
Degree of saturation of concrete State of surface at time of application (initial take-up) Surface condition immediately after application (wash out) Influence on permeability
 Surface condition immediately after application (wash out) Influence on permeability")
122
Permeability characteristics of concrete Ease with which inhibitor may penetrate depends on intrinsic permeability characteristics and degree of saturation Permeability also influences ease which other contaminants may enter post-repair (additional protection from suitable coating may be required)
")
123
Corroded state of reinforcement Inhibitor must form mono- molecular layer on reinforcement Ease of formation depends on surface state at time of repair Clean or lightly corroded – optimal state Heavily corroded – outside inhibitor’s effectiveness window

124
Chloride levels Critical consideration is the relative inhibitor to chloride concentration Inhibitor must form a mono-molecular protective layer and displace chloride ions from the reinforcement Competitive surface adsorption reaction between inhibitors and chloride ions Inhibitors most effective if applied before significant build up of chloride concentration

125
Framework of Guidance for Specifiers Specifiers evaluating or developing a repair strategy based on surface applied corrosion inhibitors are encouraged to view it in the context of a structured approach to deciding on an optimum repair strategy. Such a structured approach is presented in SAMARIS Report D31.

126
Context for Guidance: SAMARIS D31 Determine condition Rank maintenance option (Value Management) Control risks Apply technique Select maintenance option (Value Engineering) Options available No Yes Innovative? Objectives of maintenance Identify need

127
Determine Rank option Control risks Apply technique Select option Options N Y Innov? Objectives Identify SAMARIS D31 Guidance SAMARIS D25a Guidance

128
Framework of Guidance: D25a Reference: SAMARIS Report D25a Summary Flowchart

129
Yes Apply technique No Initial desk study assessment Inhibitor potentially appropriate? Control of risk to specifier’s satisfaction? Re-examine alternative ranked options No Yes Overview of guidance flowchart

130
Conduct preview and analyse results No Yes Control of risk to specifier’s satisfaction? Define performance criteria for preview Finalise proposed rehabilitation strategy

131
Overview of guidance flowchart If resources permit conduct post repair monitoring as part of a proactive maintenance strategy and reapply technique if required during residual service life Control of risk to specifier’s satisfaction? Apply technique Finalise proposed rehabilitation strategy Re-examine alternative ranked options Yes No

132
Summary Initial Assessment: Consider findings, Balance constraints (funding, time, urgency, traffic disruption etc.) against control of risk to specifier’s satisfaction, Decide: Go? No go? Go to preview study?

133
Summary Preview Study Assessment (if used): Consider findings, Modify proposed strategy if necessary (e.g. inhibitor + coating rather than inhibitor only), Balance constraints (funding, time, urgency, traffic disruption etc.) against control of risk to specifier’s satisfaction, Decide: Go? No go?
, Balance constraints (funding, time, urgency, traffic disruption etc.) against control of risk to specifier’s satisfaction, Decide: Go. No go .")
134
Post-repair monitoring If ‘Go’ consider also follow up monitoring as part of a proactive maintenance strategy

135
Further Information Follow up presentation (Guidance on use of surface-applied corrosion inhibitors: Detailed Guidance and Case Studies) SAMARIS Report D25a
 SAMARIS Report D25a")
137
Optimised assessment of bridges Case study 1 - Medno bridge Soft Load Testing Aleš Žnidarič Slovenian National Building and Civil Engineering Institute

138
Assessment of existing bridges Important factors: condition, level of damage structural safety: carrying capacity loading (dead, traffic, dynamic loading) reliability of data serviceability (clearances, traffic, obsoleteness) service life, importance 1.What is the carrying capacity? age, condition, drawings… 2.What is the real behaviour? influence lines load distributions 3.What is the real loading? in a country, type of road, on specific bridge dynamic amplification 5-level (step-by-step) assessment
 assessment.")
139
Safety assessment to verify that a structure has adequate capacity to safely carry or resist specific loading levels: R>S Rating factor:

140
Case study – Medno bridge Structure from 1937: no drawings refurbished in 1997 in very good condition 11.95 m long span total width 8.5 m 5 RC beams 1.35 m apart cross beams above abutments, at ¼, ½ and ¾ of the span unknown fixity of supports located on a road with 1150 heavy vehicles ADT posted to 30 tonnes GVW

141
Carrying capacity Assumed characteristics of concrete: f c = 20 MPa no information about steel reinforcement: 8 bars from profometer test likely 25 or 28 mm, assumed 8 22 mm bars of 240/360 MPa steel R M = 867.4 kNm

142
Soft load testing to check the assumptions made in the model bridge WIM used to provide: normal traffic data (not in this case) information about structural behaviour: influence lines statistical load distribution impact factors from normal traffic (not in this case) only 1 pre-weighed vehicle for BWIM calibration the bridge need not be closed to traffic
 information about structural behaviour: influence lines statistical load distribution impact factors from normal traffic (not in this case) only 1 pre-weighed vehicle for BWIM calibration the bridge need not be closed to traffic")
143
BWIM shema Strain measurements Axle detection

144
Soft Load Testing Soft load testing Simply supported RF << 1.0

145
Soft Load Testing Soft load testing Simply supported RF << 1.0 Measured RF >> 1.0 Message: Check, how bridges really behave.

146
Soft Load Testing Load distribution: normally guestimation bridge WIM evaluates it statistically

147
Selection of capacity reduction factor Capacity reduction factor: Φ = B R × e - .βc.V SI procedure accounts for: condition of the structure reliability of data redundancy of structure method of calculation Medno bridge: Φ = 0.86

148
Selection of safety factors Dimensions taken on site: Safety factor for traffic loading: Q = 1.6 G = 1.2 Q = 1.7 Q = 1.9

149
Structural safety of Medno bridge Calibrated structural model: 1.Loading scheme with 2 4-axle rigid 38-ton trucks, one in each lane: 2.Loading scheme with 81-ton 8-axle vehicle in one lane and rigid 38-ton truck in the other: Room for further optimisation of analysis

150
Conclusions on Medno bridge soft load testing proved beneficial 2004 assessments for special transports for the Slovene Road Administration: 13 posted bridges assessed 11 proved safe even for a 165-tonnes special vehicle with 12 axles for the rest missing data on carrying capacity on shorter bridges normal traffic worse than special transports

151
Optimised assessment of bridges Case study 2 – Danish examples Alan O’Connor Rambøll

152
Problem: 1) Lack of load carrying capacity or exceedance of structural/performance limit state due to –weak bridges –deteriorated/(ing) bridges –Increasing loads 2)Low budgets for strengthening and/or rehabilitation where required Idea:1)Demonstration of higher capacity through Probabilistic safety assessments incorporating better calculation/response models Principal Motivation: Cost saving through Budget Optimisation Problem, idea and motivation
 Lack of load carrying capacity or exceedance of structural/performance limit state due to –weak bridges –deteriorated/(ing) bridges –Increasing loads 2)Low budgets for strengthening and/or rehabilitation where required Idea:1)Demonstration of higher capacity through Probabilistic safety assessments incorporating better calculation/response models Principal Motivation: Cost saving through Budget Optimisation Problem, idea and motivation")
153
The general approach: Assessments based upon deterministic codes for both (a) New bridges and (b) Existing bridges Generalisation Partial safety factor format Deterministic Load specification Many types of bridges Benefit Efficient and easy to use Drawback Costly in case of lack of capacity may result in unnecessary repair/rehabilitation Safety approaches for assessment of existing bridges
 New bridges and (b) Existing bridges Generalisation Partial safety factor format Deterministic Load specification Many types of bridges Benefit Efficient and easy to use Drawback Costly in case of lack of capacity may result in unnecessary repair/rehabilitation Safety approaches for assessment of existing bridges")
154
Concept: Not necessarily have to fulfill the requirements of a general code rather the Overall requirement for the safety level must be satisfied on a individual basis Purpose: Cut strengthening or rehabilitation costs without compromising safety level Method: Probabilistic-based assessment Site specific modelling of specific conditions/structure: Traffic load Capacities Response Models Bridge specific “code” is obtained The individual approach

155
Decision Process Yes Yes No Yes Assessment from traditional evaluation OK ? Implement traditional strengthening project Yes Assessment from traditional evaluation OK ? Implement traditional strengthening project Refined assessment beneficial? No Refined strengthening project Traditional decision process New decision process considering refined assessment Refined assessment OK ?

156
Case Studies Practical experience: The Danish Road Directorate has saved more than $50 million USD

157
Case Studies - Savings Savings > $ 4 mio. Savings > $ 15 ml. Savings > $ 20 ml. Savings > $ 0.5 ml. Savings > $ 2 ml.

158
Case Studies - Savings Savings > $ 0.3 ml. Savings > $ 0.5 ml. Savings > $ 1.0 ml. Savings > $ 2.0 ml.

159
Probability based Maintenance Management

160
0. Fact-finding 1. Formulation of problem 2. Safety requirements 3. Deterministic models for failure 4. Probability-based safety-model for critical failure modes. 5. Stochastic variables 6. Safety of the non-deteriorated bridge 7. Safety of deteriorated bridge 8. Analysis of repair and rehabilitation options 9. Requirements for the visual appearance of the bridge 10. Cost-optimal management plan using decision analysis to determine optimal rehabilitation options SAFETY MANAGEMENT Practical 10-phase procedure

161
West Bridge East Bridge Post tensioned concrete box-girder bridges 12 spans, 220 m long Carries a 4-lane highway Skovdiget Bridges: Location / Overview SAVING €20ml.

162
History West Bridge East bridge 1965-1967 ConstructionConstruction 1978 Major rehabilitation 1978-1999Inspection 4 timesPrincipal Inspection a year. Load testing every 5 years. every 5 years.Normal M & R procedure. Bridge in bad Bridge in good condition.condition. 1998-2000Implementation of probabilistic-based management plan.

163
Design, Deterioration & Assessment Poor workmanship during construction: un-injected or poorly injected post- tensioned cable ducts insufficient and poor drainage area around gulley poorly made bad waterproofing Fast Slow Service Emergency Bicycle lane & lane lane lane lane footway Gulley Main girder 3 Main girder 4 Deterministic analysis of bridge & failure modes Main girders, moment and shear failure Shear failure of transverse girders (above columns) Transverse ribs between main girders 3 and 4 East and west cantilever wing Identifying areas with most severe deterioration Identifying critical combinations Modelling of stochastic variables Modelling of strengths concrete, reinforcement steel, cables Modelling of loads total traffic load dynamic amplification factors transverse distribution of vehicles Model uncertainties Prediction of the deterioration
 Transverse ribs between main girders 3 and 4 East and west cantilever wing Identifying areas with most severe deterioration Identifying critical combinations Modelling of stochastic variables Modelling of strengths concrete, reinforcement steel, cables Modelling of loads total traffic load dynamic amplification factors transverse distribution of vehicles Model uncertainties Prediction of the deterioration")
164
Calculation of safety allowing for deterioration Development of the safety index Maintenance Management Options Traffic, repair and information options: Traffic options - Weight restrictions Repair/strengthening - or replacement - options - Minor / major repair - or - strengthening - Preventive actions - Replacement Improvement of Information level - Inspections to update estimate of current deterioration - Test loading - Determine actual weight the bridge - Monitoring system - More advanced analysis and response models - Extended routine and special inspections A Safety-based management plan is established and implemented for Skovdiget West Extended lifetime > 15 years & Cost savings > €20 million The Danish Road Directorate is now using the methodology for other bridges The safety level is not compromised A rational methodology is implemented for practical application Probabilistic-based assessment of bridges cuts strengthening or rehabilitation costs. The cost savings can be significant www.vd.dk

165
Conclusions Reliability based assessment of bridges and Probability Based Maintenance Management cuts strengthening or rehabilitation costs The safety level is not compromised A well established methodology is implemented for practical application The cost saving can be millions of € per year

167
Ultra High Performance Fibre Reinforced Composites (UHPFRC) for rehabilitation - 2. Case study – first application Jean-Christophe Putallaz SRCE/VS MCS/EPFL Emmanuel Denarié – MCS/EPFL

168
OUTLINE 1.Rehabilitation strategy 2.First application 3.Conclusions 4.Acknowledgements

169
Rehabilitation strategy Limit costs (construction and life-cycle) Decrease number and duration of interventions Provide sufficient durability … Promote STRATEGY A
 Decrease number and duration of interventions Provide sufficient durability … Promote STRATEGY A")
170
2. First application Creep, shrinkage, permeability Site application 1 - 2004 Structural response Resistance

171
First application Rehabilitation and widening of the Bridge over river La Morge - Switzerland Execution: October – November 2004

172
GEOGRAPHICAL LOCATION Swiss alps, Valley nearby Sion, 480 m above s.l Secondary road with sustained traffic Heavy salt spraying in winter

173
Prior to rehabilitation Downstream kerb Upstream kerb No waterproofing membrane, Kerbs severely damaged by chloride induced corrosion

174
Concept of the intervention Span 10 m No waterproofing membrane Protective function provided by UHPFRC Widening of the bridge Prefabricated UHPFRC kerb downstream Thin UHPFRC overlay (3 cm) applied on deck UHPFRC rehab. kerb usptream Span 10 m

175
Construction joint for UHPFRC

176
Prefabricated downstream kerb

177
Prefabricated kerb in UHPFRC - joint

178
UHPFRC materials Cement CEM I 52.5 (low C 3 A) Fine quarz sand (D max < 0.5 mm) Silica fume - SF/C = 0.26 Superplasticizer = 1 % dry extract Steel wool + 10/0.2 mm steel fibres Total fibres = 9 % Vol. or 706 kg/m 3 ) Basis: CEMTEC multiscale ® - Rossi et al. (2002) No thermal curing Protection with plastic sheet + 8 days moist curing
 Basis: CEMTEC multiscale ® - Rossi et al. (2002) No thermal curing Protection with plastic sheet + 8 days moist curing.")
179
UHPFRC materials RecipeCement [kg/m 3 ] W/B [--] W/C [--] Application CM2214100.1310.165Rehabilitation Upstream kerb CM2314340.1250.155Downstream kerb + overlays CM 23: tolerates slope up to 2.5 % Both recipes are selfcompacting Slump flow ~ 400 mm
![UHPFRC materials RecipeCement [kg/m 3 ] W/B [--] W/C [--] Application CM Rehabilitation Upstream kerb CM Downstream kerb + overlays CM 23: tolerates slope up to 2.5 % Both recipes are selfcompacting Slump flow ~ 400 mm](http://images.slideplayer.com/14/4379740/slides/slide_179.jpg "UHPFRC materials RecipeCement [kg/m 3 ] W/B [--] W/C [--] Application CM Rehabilitation Upstream kerb CM Downstream kerb + overlays CM 23: tolerates slope up to 2.5 % Both recipes are selfcompacting Slump flow ~ 400 mm")
180
Preparation of the UHPFRC Concrete plant mixer with 500 to 750 litres capacity 300 litres UHPFRC pro batch 3 batches = 900 litres in 45 minutes 900 litres pro truck - 635 kg steel fibres per truck !

181
Application on ½ road downstream – october 22, 2004 On the site

182
Processing of the UHPFRC The thixotropic, selfcompacting UHPFRC, is handled using simple tools (Photo A. Herzog)
.")
183
In-situ air permeability testing Air permeability tests after Torrent et al. (1995) Extremely low kT values measured on bridge
 Extremely low kT values measured on bridge.")
184
Comparative uniaxial tensile behaviour Denarié et al. (2006)
")
185
Uniaxial tensile tests on UHPFRC Test results on 5 specimens, at 28 days f ct = 13.5 MPa (mean) hardening = 1.5 ‰ (mean) Denarié et al. (2006)
.")
186
Cost analysis Comparison of three alternatives A.Executed project with UHPFRC and no waterproofing membrane B.Similar case with rehabilitation mortar and waterproofing membrane C.Similar case with cheaper (- 30 %) UHPFRC and no waterproofing membrane CaseRelative construction costs A112 % B100 % C107 % Realized
 UHPFRC and no waterproofing membrane CaseRelative construction costs A112 % B100 % C107 % Realized")
187
The bridge, after first winter

188
Detail of UHPFRC, after first winter View of the surface of the prefabricated kerb with UHPFRC, with superficial corrosion of steel fibres tips near to the surface. UHPFRC cast on site Prefabricated

189
Conclusions of first application UHPFRC CEMTEC multiscale ® was easy to produce and cast on site with standard equipments. Quality of the UHPFRC was verified in-situ and in the laboratory. Excellent properties were achieved. Waterproofing membrane not necessary with UHPFRC. Bituminous layer can be applied after 8 days on UHPFRC, instead of several weeks for normal concrete. Superficial corrosion of steel fibres on UHPFRC skin, is linked to processing. Although a purely superficial concern, has to be mitigated by adapted processing techniques.

190
Owner’s point of view « The main advantages of this technique are: Shortening of duration of works, quicker reopening of traffic lanes, and longer durability. Significant savings in terms of reduced traffic disturbances and associated indirect costs. Reduction of rehabilitation layer thickness and capacity to reinforce without increasing deadweight. Prevent costly reinforcement of main parts of the structure. Application by local contractors, with standard equipments. » SRCE - DTEE CANTON DU VALAIS

191
7. Conclusions «Targeted local hardening» of highway structures, in most critical zones, by using UHPFRC. Simplification of the construction process. Reduction of the dead loads (superstructure and pavement). Increase of the performance of existing and new structures (protection and reinforcement). Dramatic decrease of the number and severity of interventions during service life. Concept has successfully demonstrated its technical maturity and economical feasibility in a first full scale application.
. Increase of the performance of existing and new structures (protection and reinforcement). Dramatic decrease of the number and severity of interventions during service life. Concept has successfully demonstrated its technical maturity and economical feasibility in a first full scale application..")
192
What is the future ? Creep, shrinkage, permeability Site application 2 - 2007 Site application 1 - 2004 Structural response Resistance Why not you ?

193
Partners of the project Owner: Département des Travaux Publics du canton du Valais, Sion, Suisse, Service des routes et Cours d'eau, Section du Valais central/Sion, Switzerland. Concept and supervision: Laboratory for Maintenance and Safety of Structures, Ecole Polytechnique Fédérale de Lausanne (EPFL), Switzerland Advice for the UHPFRC recipes and processing: Dr. P. Rossi, Laboratoire Central des Ponts et Chaussées (LCPC), Paris, France. Execution plans and local direction of works: PRA ingénieurs conseil SA, rue de la Majorie 9, CH-1950 Sion, Switzerland, Production of UHPFRC, realisation of prefabricated UHPFRC kerb and reinforced concrete beam: Proz Frères SA, matériaux de construction, CH-1908 Riddes, Switzerland, Contractor: Evéquoz SA, rue des Peupliers 16, CH-1964 Conthey, Switzerland,
, Switzerland Advice for the UHPFRC recipes and processing: Dr. P. Rossi, Laboratoire Central des Ponts et Chaussées (LCPC), Paris, France. Execution plans and local direction of works: PRA ingénieurs conseil SA, rue de la Majorie 9, CH-1950 Sion, Switzerland, Production of UHPFRC, realisation of prefabricated UHPFRC kerb and reinforced concrete beam: Proz Frères SA, matériaux de construction, CH-1908 Riddes, Switzerland, Contractor: Evéquoz SA, rue des Peupliers 16, CH-1964 Conthey, Switzerland,.")
194
Acknowledgements UHPFRC team of MCS-EPFL: Prof. Eugen Brühwiler, John Wuest, Aicha Kamen, Andrin Herwig, Dr. Katrin Habel*, Prof. J.P. Charron*, Roland Gysler, Sylvain Demierre, *Former collaborators of MCS-EPFL Partners in Project SAMARIS Dr. P. Rossi Dr. R. Woodward Service des Routes et Cours d’Eau – DTEE SRCE – Canton du Valais

195
Guidance on use of surface- applied corrosion inhibitors Workshop on detailed guidance and Case Studies M. Richardson UCD

196
Outline Initial Assessment Preview Study option Post-repair Monitoring option Case Study: Assessment and Monitoring – Kingsway Bridge Case Study: Post-repair monitoring – Fleet Flood Span Bridge

197
Initial Assessment

198
Yes Apply technique No Initial desk study assessment Inhibitor potentially appropriate ? Control of risk to specifier’s satisfaction? Re-examine alternative ranked options No Yes Summary of Guidance - 1

199
Issues in Initial Assessment Extremes of in-service environmental conditions Degree of saturation of concrete Chloride levels Permeability and carbonation Corroded state of reinforcement at time of repair Ecological constraints

200
Issues in Initial Assessment Extremes of in-service environmental conditions Degree of saturation of concrete Chloride levels Permeability characteristics of concrete Corroded state of reinforcement at time of repair Ecological constraints

201
Issues in Initial Assessment Extremes of in-service environmental conditions Degree of saturation of concrete Chloride levels Permeability characteristics of concrete Corroded state of reinforcement at time of repair Ecological constraints

202
Extremes of environmental conditions Environmen t Indicative Temperatur e Potential Consequence Sustained low temperatures ≤ -5 o CAlteration in the physical nature of the inhibitor, with implications for its mobility in concrete. Temperature limit of – 5°C is only applicable for the storage condition. Application to be carried out above +5°C. Frequent high temperatures ≥ 40 o CPotential loss of volatile material to the atmosphere. Coating the concrete surface may be an option to reduce evaporation loss.

203
Degree of saturation of concrete Moisture State Indicative Example Possible Consequence Permanently saturated Elements of highway structures predominantly below the water level of a lake Inhibitor take up by absorption would be low. Subsequent penetration would not be assisted by capillary action. Note: corrosion would be low in these areas if oxygen access is equally restricted. Frequent and regular wetting cycles Elements of coastal highway structures within the tidal zone Potential washout of inhibitor immediately after application. Inadequate concentration at the reinforcement.

204
Chloride levels Chloride State Indicative Free Chloride Ion at Level at Reinforcement Possible Consequence Low≤ 0.5 % Chloride ion by mass of cement Corrosion inhibitor potentially viable as a preventive maintenance strategy before any significant active corrosion takes place. Moderate≤ 1 % Chloride ion by mass of cement Corrosion inhibitor may be effective if a satisfactory inhibitor to chloride ion concentration ratio is achieved – much depends on existing degree of corrosion. Protective measures to prevent further chloride build up are recommended in chloride-rich environments. continued …

205
Chloride levels continued … Chloride State Indicative Free Chloride Ion at Level at Reinforcement Possible Consequence High1 – 2 % Chloride ion by mass of cement Corrosion inhibitor dosage level may have to be increased beyond typical manufacturer ’ s recommendation and additional protective measures required. May take the technique beyond its recommended effectiveness window, introducing higher risk. Very high> 2 % Chloride ion by mass of cement Corrosion inhibitor unlikely to be a successful component of the repair strategy.

206
Permeability and carbonation Carbonatio n State Concrete Permeability Possible Consequence Cover fully carbonated ModerateInhibitor potentially effective. HighInhibitor potentially effective initially but reservoir may not be retained in concrete reducing effectiveness over time. May need additional measures such as a suitable coating.

207
Corroded state of reinforcement continued … Existing Corrosion Rate Indicative Corrosion Rate over a sustained period Possible Consequence Low to Moderate < 0.5 µ A/cm 2 < 5 μm/year Best scenario possible with inhibitor used as part of a proactive preventive maintenance strategy. Moderate to High 0.5 – 1.0 μA/cm 2 5 - 10 μm/year State of reinforcement is potentially suitable for consideration of corrosion inhibitor treatment.

208
Corroded state of reinforcement continued … Existing Corrosion Rate Indicative Corrosion Rate over a sustained period Possible Consequence High1.0 - 10 μA/cm 2 10 - 100 μm/year State of reinforcement will depend on corrosion rate lies - effectiveness of the inhibitor correspondingly influenced. Higher risk at higher corrosion rate. Corrosion monitoring recommended in case of higher corrosion rates. Very High> 10 μA/cm 2 > 100 μm/year Reinforcement may be heavily corroded - corrosion inhibitor is unlikely to be a successful component of the repair strategy.

209
Ecological constraints Local environmental or health and safety constraints? Example: work near drinking water supply source

210
Preview Study option

211
Conduct preview and analyse results No Yes Control of risk to specifier’s satisfaction? Define performance criteria for preview Finalise proposed rehabilitation strategy Summary of Guidance - 2

212
Preview Study – Indicative Criteria ObjectiveIndicative Performance Criteria Defer the initial time to depassivation < 5 μm/year loss of steel (or < 0.5 µ A/cm 2 ) Reduce the rate of corrosion 65% reduction from pre-treated levels over a defined time period or …………… < 5 μm/year loss of steel (or < 0.5 µ A/cm 2 ) Retard incipient action (ring anode) No increase in loss of steel prefer ………… Decrease to < 5 μm/year loss of steel (or < 0.5 µ A/cm 2 )
 Reduce the rate of corrosion 65% reduction from pre-treated levels over a defined time period or …………… < 5 μm/year loss of steel (or < 0.5 µ A/cm 2 ) Retard incipient action (ring anode) No increase in loss of steel prefer ………… Decrease to < 5 μm/year loss of steel (or < 0.5 µ A/cm 2 )")
213
Post-repair monitoring option

214
If resources permit conduct post repair monitoring as part of a proactive maintenance strategy and reapply technique if required during residual service life Control of risk to specifier’s satisfaction? Apply technique Finalise proposed rehabilitation strategy Re-examine alternative ranked options Yes No Summary of Guidance - 3

215
If resources permit conduct post repair monitoring as part of a proactive maintenance strategy and reapply technique if required during residual service life Control of risk to specifier’s satisfaction? Apply technique Finalise proposed rehabilitation strategy Re-examine alternative ranked options Yes No Summary of Guidance - 3 If resources permit conduct post repair monitoring as part of a proactive maintenance strategy and reapply technique if required during residual service life

216
Case Study of assessment and monitoring Kingsway Bridge Case Study 1

217
Kingsway Bridge, Warrington, U.K. Acknowledgement: Warrington Borough Council Reinforced concrete multi-span arch, 1932

218
Main spans, 2 x 26.21m Reinforced concrete arches Thickness: 450mm (arch) 1300mm (springings), Sagging and hogging bending moments Drainage route along top curved surface of arch Subject to chloride run-off
 1300mm (springings), Sagging and hogging bending moments Drainage route along top curved surface of arch Subject to chloride run-off")
219
Environmental conditionsNot significant Degree of saturationNot significant Chloride levelsTypically 0.3% Max. 0.6 – 1.2% Carbonation 2mm State of reinforcement Light surface rust Some pitting Ecological constraintsOver water

221
Findings from Initial Assessment Threat from chloride-induced corrosion. Chloride-entrained rain and deicing salts passing through deck and accumulating at crown of arch and later behind springings. Surface applied corrosion inhibitors identified as a candidate strategy for rehabilitation.

222
Agreement from Warrington Borough Council to allow further investigation including a form of ‘preview’ study of corrosion inhibitors within SAMARIS Areas selected:Crown of Arch Under Arch Corrosion inhibitor applied after base measurements Monitoring locations established

225
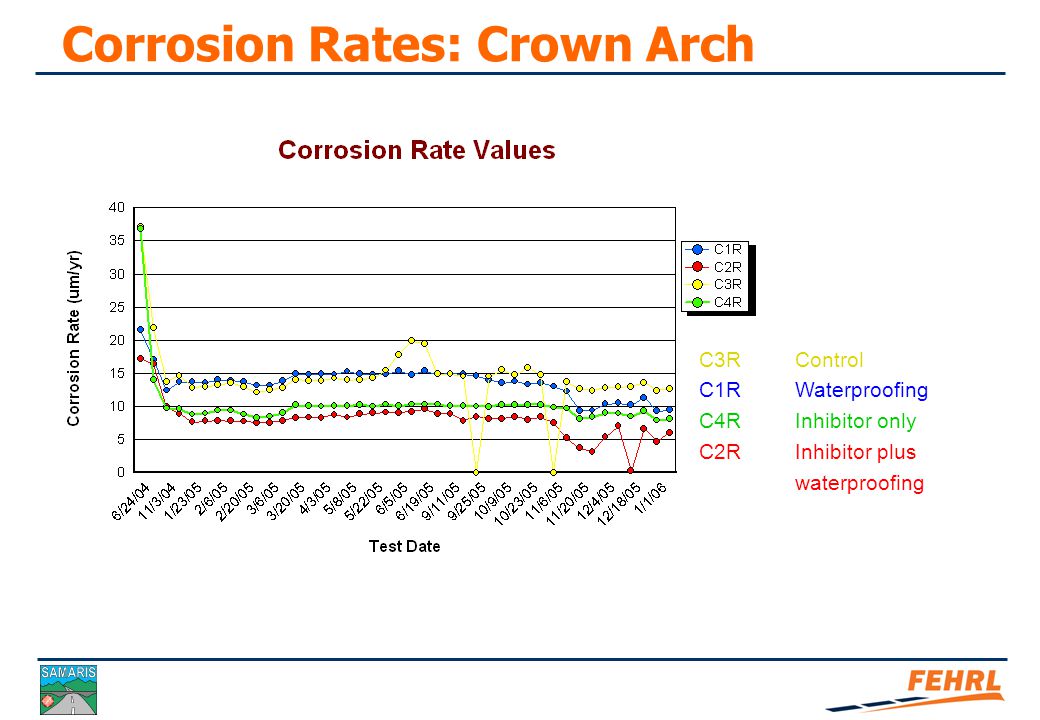
Corrosion Rates: Crown Arch C3RControl C1RWaterproofing C4RInhibitor only C2RInhibitor plus waterproofing

226
Corrrosion Rates: Under Arch

227
Case Study: Post-repair monitoring – Fleet Flood Span Bridge Case Study 2

228
Concrete repair and corrosion inhibitor treatment to trestles and abutments. Monitored previously from 2000 to 2002, reactivated 2005. Fleet Flood Span Bridge

229
Trestle 1

230
Trestle 2

231
North Abutment

232
South Abutment

233
Summary Inhibitor effectiveness is very influenced by the state of the reinforcement at time of treatment and the hostility of the chloride environment. This inter-relationship makes it difficult to specify precise limits on the effectiveness window but qualitative guidance is proposed. Optimal use of inhibitors may be as part of a proactive maintenance strategy and the earlier they are applied the better. The use of corrosion monitoring is invaluable in managing such repair strategies

234
Further Information SAMARIS Report D21 Field Studies SAMARIS Report D25a Guidance on use of surface-applied corrosion inhibitors

235
Advances in rehabilitation of highway structures Discussion, Summary and Perspectives Prof. Eugen Brühwiler MCS/EPFL

236
… improving the performance ! apply advanced structural assessment to limit interventions improve the structure (not just repair it) reduce the duration of interventions reduce life-cycle costs (without increasing the cost of intervention)
 reduce the duration of interventions reduce life-cycle costs (without increasing the cost of intervention).")
237
Achieving improved performance … through: education motivation applications demonstration guidelines regulation

Similar presentations


 Awtar Jandu Safe Roads, Reliable Journeys, Informed Travellers Bridge Owners Forum – Leeds -14 June 2005.>")


