Download presentation
Presentation is loading. Please wait.

1
Traffic Stop Data Analysis and Findings State of Connecticut April 2015 Report

2
AUTHORS Matthew B. Ross Economist, Research Department Connecticut Economic Resource Center, Inc. James Fazzalaro Project Manager, Connecticut Racial Profiling Prohibition Project Research and Policy Analyst Institute for Municipal and Regional Policy Central Connecticut State University Ken Barone Project Staff, Connecticut Racial Profiling Prohibition Project Research and Policy Specialist Institute for Municipal and Regional Policy Central Connecticut State University Jesse Kalinowski Economic Consultant, Research Department Connecticut Economic Resource Center, Inc. This report was written by the Institute for Municipal and Regional Policy (IMRP) at Central Connecticut State University with the help of the Connecticut Economic Resource Center, Inc. (CERC). The authors from CERC applied the statistical tests known as the “Veil of Darkness,” and “KPT Hit Rate.” In addition to these statistical tests, CERC developed the descriptive statistics using the peer group methodology.
 at Central Connecticut State University with the help of the Connecticut Economic Resource Center, Inc. (CERC). The authors from CERC applied the statistical tests known as the Veil of Darkness, and KPT Hit Rate. In addition to these statistical tests, CERC developed the descriptive statistics using the peer group methodology..")
3
Connecticut Racial Profiling Advisory Board William R. Dyson, Co-Chairman Glenn Cassis, African American Affairs Commission Under Secretary Mike Lawlor, Office of Policy Management Chief Douglas Fuchs, Connecticut Police Chiefs Association Commissioner Dora Schriro, Department of Emergency Services and Public Protection Captain George Battle, Connecticut State Police Michael Gailor, Chief State’s Attorney Office Deborah Del Prete Sullivan, Office of the Chief Public Defender Werner Oyanadel, Latino and Puerto Rican Affairs Commission Orlando Rodriguez, Latino and Puerto Rican Affairs Commission Tanya Hughes, Commission on Human Rights and Opportunities Tamara Lanier, Connecticut National Association for the Advancement of Colored People, CT Judicial Branch Sean Thakkar, Criminal Justice Information Systems Mui Mui Hin-McCormick, Asian Pacific American Affairs Commission Chris Sedelmaier, University of New Haven Thomas Maziarz, Department of Transportation Stephen Cox, Central Connecticut State University Gabriel Cano, National Highway Traffic Safety Administration Aaron Swanson, Department of Transportation Joseph Cristalli, Department of Transportation Andrew Clark, Central Connecticut State University Cheryl Sharp, Commission on Human Rights and Opportunities Senator Gary Winfield, Connecticut General Assembly Representative Joe Verrengia, Connecticut General Assembly David McGuire, American Civil Liberties Union of Connecticut Lynn Blackwell, Department of Motor Vehicle Chief Dean Esserman, New Haven Police Department Captain Nick Boulter, Simsbury Police Department Cato T. Laurencin, M.D., Ph.D., Van Dusen Distinguished Professor of Orthopaedic Surgery, UCONN, Community Member Jeff Matchett, AFSCME Council 15 Stacey Manware, Judicial Branch

4
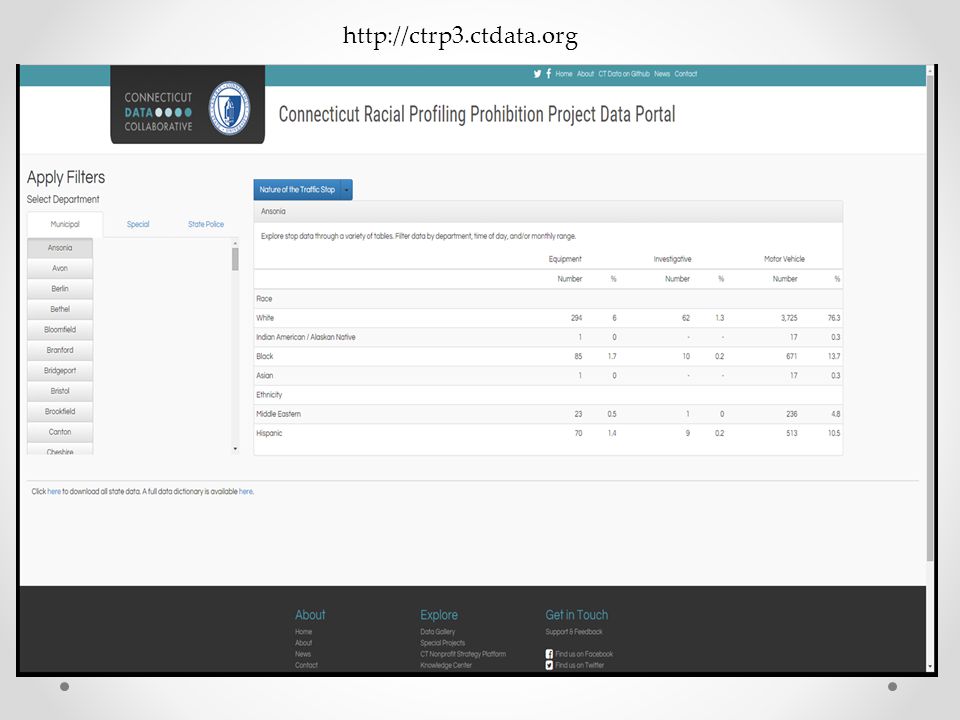
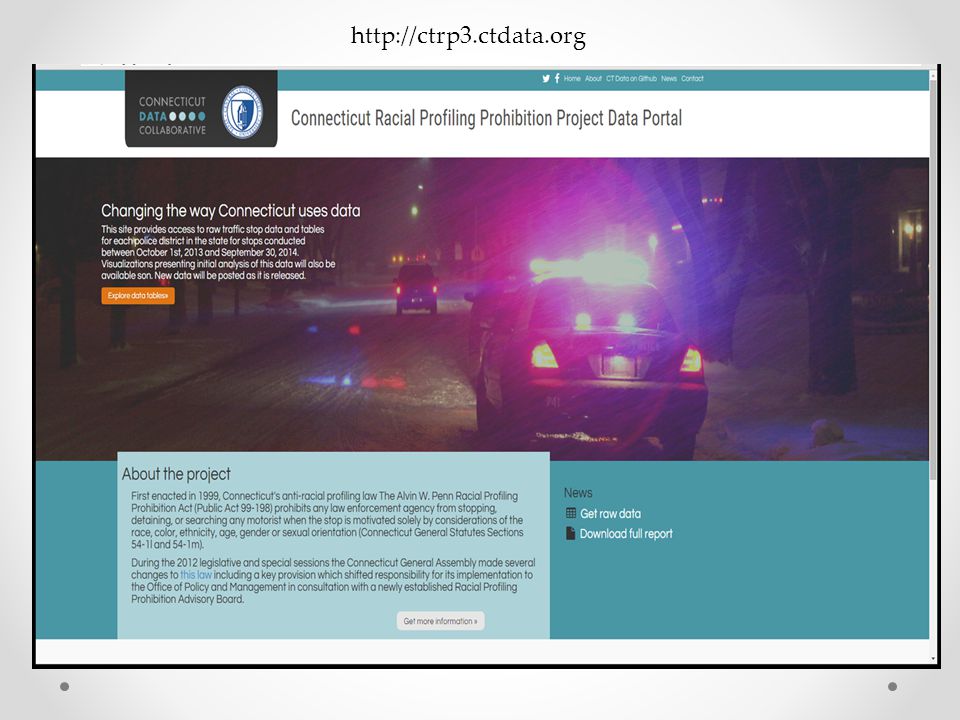
http://ctrp3.ctdata.org
6
Outline of Report Sections I and II provide general background and the methodological approach used in the study. Section III: The analysis begins by first presenting the stop characteristics from the Connecticut policing data. Section IV: This section leads the reader through four descriptive measures that evaluate racial and ethnic disparities. There were seven distinct analytical tools used to evaluate whether racial and ethnic disparities exist in the policing data. The four techniques contained in Section IV are descriptive in nature and should be viewed with a degree of caution. These intuitive measures are less stringent than more sophisticated statistical tests, but provide a useful context from which to view the data.

7
Outline of Report (Cont.) Section V: This section analyzes racial and ethnic disparities in the rate of motor vehicle stops by applying a well-respected methodology known as the Veil of Darkness. The Veil of Darkness is a statistical technique that was developed by Jeffery Grogger and Greg Ridgeway (2006) and published in the Journal of the American Statistical Association. The analysis described in this section is considered to be the most rigorous and broadly applicable of all the tests presented in this analysis.
 and published in the Journal of the American Statistical Association. The analysis described in this section is considered to be the most rigorous and broadly applicable of all the tests presented in this analysis..")
8
Outline of Report (Cont.) Section VI: This section assesses post-stop behavior, particularly the incidence of vehicular searches, by applying two estimation strategies. This section illustrates the application of an analysis of hit rates using the classic approach developed by Knowles, Persico and Todd (2001). In addition to this technique, a more recent contribution by Joseph Ritter (2013) that assesses the relative frequency of search rates across racial and ethnic groups is applied.
. In addition to this technique, a more recent contribution by Joseph Ritter (2013) that assesses the relative frequency of search rates across racial and ethnic groups is applied..")
9
Guiding Principles for Statistical Analysis Principle 1: Acknowledge that statistical evaluation is limited to finding racial and ethnic disparities that are indicative of racial and ethnic bias but that, in the absence of a formal procedural investigation, cannot be considered comprehensive evidence. Principle 2: Apply a holistic approach for assessing racial and ethnic disparities in Connecticut policing data by using a variety of approaches that rely on well- respected techniques from existing literature. Principle 3: Outline the assumptions and limitations of each approach transparently so that the public and policy makers can use their judgment in drawing conclusions from the analysis.

10
Characteristics of Traffic Stop Data Traffic Stop Data was analyzed from October 1, 2013 to September 30, 2014. More than 620,000 traffic stops were conducted by 102 law enforcement agencies during the 12 month study period. o 92 Municipal Police Agencies* o State Police o 9 Special Police Agencies *Stamford Police Department was excluded from the study period. Limited data was collected from New London, Suffield and West Haven.

11
Characteristics of Traffic Stop Data Aggregate Traffic Stops by Month of the Year

12
Characteristics of Traffic Stop Data Aggregate Traffic Stops by Time of Day

13
Characteristics of Traffic Stop Data Average Number of Traffic Stops by Month for Police Agencies

14
Characteristics of Traffic Stop Data Volume of traffic stops vary across departments. For every 1,000 CT residents, 211 are stopped. Newtown (452) and Berlin (413) stop the highest number of residents per 1,000. Shelton (19) and Waterbury (21) stop the lowest number of residents per 1,000.
 and Berlin (413) stop the highest number of residents per 1,000. Shelton (19) and Waterbury (21) stop the lowest number of residents per 1,000..")
15
Characteristics of Traffic Stop Data Race and EthnicityGenderResidencyAge White73.1% Male63.9%Connecticut Resident87.2% 16 to 208% 21 to 3030% Black13.5%31 to 4019% All Other Races1.8% Female36.1%Nonresident12.8% 41 to 5019% 51 to 6014% Hispanic11.7% Older than 618% Statewide Driver Characteristics

16
Characteristics of Traffic Stop Data Classification of StopBasis for Stop Motor Vehicle Violation88.0%Speeding26.9% Equipment Violation9.8%Registration9.4% Investigatory2.2%Cell Phone9.0% Outcome of StopDefective Lights8.9% Uniform Arrest Report0.9%Misc. Moving Violation7.5% Misdemeanor Summons5.5%Traffic Control Signal6.7% Infraction Ticket47.7%Stop Sign5.8% Written Warning17.9%Seatbelt4.1% Verbal Warning26.4%Display of Plates2.9% No Disposition1.6%Suspended License1.3% Vehicles Searched2.9%All Other17.4% Statewide Stop Characteristics

17
Characteristics of Traffic Stop Data Department NameTotal StopsSpeed Related New Milford4,04963.0% Suffield55662.9% Portland16062.5% Southington5,39552.9% Newtown9,40249.9% Ridgefield7,36647.4% Guilford2,71146.3% Weston41045.4% Wolcott79744.8% Simsbury3,28142.7% Highest Speeding Stop Rates Across All Departments

18
Characteristics of Traffic Stop Data Department NameTotal StopsRegistration Violations Branford6,89124.6% North Branford1,34023.7% Trumbull2,97423.1% Watertown1,78420.5% Stratford2,95619.6% Greenwich8,04119.6% West Hartford8,22119.2% Wilton3,89318.5% Hamden5,44217.6% Troop L13,79017.51% Highest Registration Violation Rates across All Departments

19
Characteristics of Traffic Stop Data Stops for defective lights, excessive window tint, or a display of plate violation are considered to have more Officer discretion. o Statewide average of 12.9% for these violations o 62 departments exceeded the statewide average. Wethersfield (33%) South Windsor (31.7%) Clinton (31.6%) Newington (31%) Torrington (30.8%)
 South Windsor (31.7%) Clinton (31.6%) Newington (31%) Torrington (30.8%).")
20
Characteristics of Traffic Stop Data 47.7% of all stops result in an infraction ticket Department NameTotal StopsInfraction Ticket Highest Municipal Departments Danbury6,18282.3% Meriden3,20970.2% Derby3,72568.6% Department of Motor Vehicle2,31766.5% Trumbull2,97464.2% Hartford8,25461.9% Branford6,89159.1% Bridgeport4,71759.1% Greenwich8,04158.4% Norwalk7,90056.4% Highest State Police Troops Non-Troop State Police15,63685.9% Troop F25,61777.7% Troop G27,50677.1% Troop H18,79073.2% Troop C27,82670.7%

21
Characteristics of Traffic Stop Data 44.3% of all stops result in a warning Department NameTotal StopsResulted in Warning Highest Municipal Departments Putnam2,30892.9% Middlebury26692.9% Suffield55687.2% Portland16086.9% Plainfield1,24084.0% West Haven3,86582.6% Plymouth2,61082.2% Thomaston94282.0% Guilford2,71181.9% Redding2,53781.0% Highest State Police Troops Troop B6,15942.3% Troop L13,79040.0% Troop D16,66233.0% Troop A23,66728.6% Troop K21,78727.4%

22
Characteristics of Traffic Stop Data Less than 1% of all traffic stops result in an arrest Department NameTotal StopsArrests New London1,5247.3% West Hartford8,2215.9% Waterbury1,7425.3% Canton1,7514.3% Wallingford9,1783.7% Hartford8,2543.4% Plainfield1,2402.6% Groton Town6,2522.5% New Haven11,1592.4% Farmington4,5252.1%

23
Characteristics of Traffic Stop Data 2.9% of all traffic stops result in a vehicle search Department NameTotal StopsResulted in Search Highest Municipal Departments Waterbury1,74228.8% Bridgeport4,71711.1% Milford4,3589.7% New London1,5248.5% West Hartford8,2218.2% Derby3,7258.2% Middletown3,7008.1% Norwalk7,9008.0% Yale University1,0507.5% New Haven11,1597.5% Highest State Police Troops Troop A23,6672.3% Troop H18,7902.2% Troop L13,7902.1% Troop I13,6701.7% Troop G27,5061.6%

24
Descriptive Statistics and Intuitive Measures 4 Intuitive Measures were used: Statewide Average Comparison Estimated Driving Population Resident Stops Peer Groups

25
Descriptive Statistics and Intuitive Measures All measures were analyzed in 3 categories: 1. Minority (all non-white) 2. Black (non-Hispanic) 3. Hispanic
 2. Black (non-Hispanic) 3. Hispanic.")
26
Descriptive Statistics and Intuitive Measures Statewide Average o The method chosen to make the statewide average comparison is as follows: The towns’ that exceeded the statewide average for the three racial categories being compared to the state average were selected. The amount that each town’s stop percentage exceeded the state average stop percentage was determined. The amount that each town’s resident driving age population exceeded the state average for the racial group being measured was determined. The net differences in these two measures was determined and used to assess orders of magnitude differences in these factors.

27
Descriptive Statistics and Intuitive Measures Statewide Average: Illustration of the Relative Difference between Stops and Residents

28
Descriptive Statistics and Intuitive Measures Statewide Average Continued o We only identified those departments that had a relative difference of 10 or more points. o Identified towns that border the target town that have a resident population that exceeds the statewide average. o Identified the percent of nonresident stops.

29
Estimated Driving Population o For each town, LODES data was used to identify all those employed in the town, but residing in some other location regardless of how far away they lived from the target community. o ACS five-year average estimated data was used to adjust for individuals commuting by some means other than driving, such as those using public transportation. o For all Connecticut towns contributing commuters, racial and ethnic characteristics of the commuting population were determined by using the jurisdictions’ 2010 census demographics. o For communities contributing fewer than 10 commuters who live outside of Connecticut, racial and ethnic characteristics of the commuting population were determined using the demographic data for the county in which they live. o The numbers for all commuters from the contributing towns were totaled and represent the nonresident portion of the given town’s EDP. This was combined with the town’s resident driving age population. The combined nonresident and resident numbers form the town’s complete EDP. Descriptive Statistics and Intuitive Measures

30
Estimated Driving Population o Identified all stops conducted Monday – Friday during peak commuting hours (6:00am – 10:00am and 3:00pm – 7:00pm). o Compared stops conducted during peak commuting hours to the EDP. o Only identified those departments that exceeded their EDP by 10 or more percentage points. Descriptive Statistics and Intuitive Measures

31
Resident Only Stop Comparison o Identified all drivers stopped that were residents of the town that stopped them. o Compared resident drivers stopped to the 16+ resident population. o Only identified those departments that exceeded their resident population by 10 or more percentage points. Descriptive Statistics and Intuitive Measures

32
Peer Group o Create a benchmark that is based on data from the five most similar departments (Peer towns) and estimate the proportion of stops across several minority definitions. Peer towns were selected by applying a matching function used by the US Census Variables used to evaluate similarity were from a variety of sources including the US Census Bureau, Department of Labor, and CT Department of Public Safety A very intuitive measure that has a statistical foundation o Only identified the 10 towns with the largest disparities (Over 10 percentage points)
.")
33
Descriptive Statistics and Intuitive Measures These 4 measures became the descriptive statistic matrix that was used to screen departments. o 33 departments were identified in the descriptive analysis with benchmark disparities greater than 10% points in any of the 4 measures. o 12 departments were identified as exceeding the benchmarks by 10 or more percentage points in 3 of the 4 measures.

34
Descriptive Statistics and Intuitive Measures Department Name Statewide Average Estimated Driving Population Resident Population Peer Group Total MBHMBHMBHMBH Tier 1 WethersfieldXXXXXXX X X9 HamdenXX XX XX XX 8 ManchesterXX XX XX XX 8 New BritainX XX XX XX X8 StratfordXX XX XX XX 8 WaterburyX XX XX XXX8 East Hartford XX XX XXX7 Tier 2 MeridenX X X XX X6 New Haven XX XX XX 6 NewingtonX XX X X X6 Norwich XX XX XX 6 Windsor XX XX XX 6

35
Veil of Darkness If racial bias is driven by the ability of officers to observe the race of drivers before making a stop, then we should observe a statistical disparity between the rate of minority stops occurring in daylight vs. darkness. o Developed by Jeffery Grogger (U. Chicago) and Greg Ridgeway (U. Penn and NIJ) in 2006 o Restricts sample to intertwilight window o Control statistically for a number of factors that could change risk-set Time of the day, day of the week, state traffic volume, police department, time of day*department fixed effects, day of the week*department fixed effects, and volume*department o Estimates are for several minority definitions o Considered by CERC/IMRP to be the strongest and most accurate test
 and Greg Ridgeway (U. Penn and NIJ) in 2006 o Restricts sample to intertwilight window o Control statistically for a number of factors that could change risk-set Time of the day, day of the week, state traffic volume, police department, time of day*department fixed effects, day of the week*department fixed effects, and volume*department o Estimates are for several minority definitions o Considered by CERC/IMRP to be the strongest and most accurate test.")
36
Veil of Darkness (Continued) (1)(2)(3)(4)(5) Non-Caucasian Non-Caucasian or Hispanic BlackHispanicBlack or Hispanic Darkness -0.131***-0.138***-0.078**-0.094***-0.102*** (0.047)(0.042)(0.033)(0.03)(0.033) Psuedo-R20.10.110.120.080.12 N158,473162,542156,078157,260162,044 State Level Results
 (1)(2)(3)(4)(5) Non-Caucasian Non-Caucasian or Hispanic BlackHispanicBlack or Hispanic Darkness ***-0.138***-0.078**-0.094***-0.102*** (0.047)(0.042)(0.033)(0.03)(0.033) Psuedo-R N158,473162,542156,078157,260162,044 State Level Results")
37
Veil of Darkness (Continued) Department Level Results (1)(2)(3)(4)(5) Non-Caucasian Non-Caucasian or Hispanic BlackHispanic Black or Hispanic GranbyDarkness -1.352*-1.088*-1.352*-0.514-1.088* (0.754)(0.58)(0.754)(0.874)(0.58) Groton TownDarkness -0.665***-0.516***-0.706***-0.179-0.504*** (0.218)(0.178)(0.234)(0.25)(0.183) WaterburyDarkness -0.588-0.532-0.5610.094-0.497 (0.392)(0.372)(0.392)(0.373)(0.368) State Police- Troop C Darkness -0.624***-0.569***-0.408***-0.395**-0.418*** (0.122)(0.0995)(0.137)(0.154)(0.106) State Police- Troop H Darkness -0.495***-0.406***-0.420***-0.065-0.340*** (0.134)(0.115)(0.138)(0.158)(0.116)
 Department Level Results (1)(2)(3)(4)(5) Non-Caucasian Non-Caucasian or Hispanic BlackHispanic Black or Hispanic GranbyDarkness *-1.088*-1.352* * (0.754)(0.58)(0.754)(0.874)(0.58) Groton TownDarkness ***-0.516***-0.706*** *** (0.218)(0.178)(0.234)(0.25)(0.183) WaterburyDarkness (0.392)(0.372)(0.392)(0.373)(0.368) State Police- Troop C Darkness ***-0.569***-0.408***-0.395**-0.418*** (0.122)(0.0995)(0.137)(0.154)(0.106) State Police- Troop H Darkness ***-0.406***-0.420*** *** (0.134)(0.115)(0.138)(0.158)(0.116)")
38
KPT Hit Rate Analysis If drivers and motorists behave rationally and optimize behavior, in equilibrium they are expected to have equal hit rates across races i.e. guilt/searches. o Developed by Knowles (IZA) Persico (NYU) and Todd (U. Penn) in 2001 o Utilizes only post stop data and restricts sample to discretionary searches o Estimated across several minority definitions and compared to control group o Has known shortcomings but can be used to confirm other tests
 Persico (NYU) and Todd (U. Penn) in 2001 o Utilizes only post stop data and restricts sample to discretionary searches o Estimated across several minority definitions and compared to control group o Has known shortcomings but can be used to confirm other tests.")
39
KPT Hit Rate Analysis (Continued) (1)(2)(3)(4)(5) VariableNon-Caucasian Non-Caucasian or Hispanic BlackHispanicBlack or Hispanic Chi2 P-Value0.000*** N5,0266,2704,9884,5416,233 Differential-0.0180.006-0.0170.0250.007 State Level Results
 (1)(2)(3)(4)(5) VariableNon-Caucasian Non-Caucasian or Hispanic BlackHispanicBlack or Hispanic Chi2 P-Value0.000*** N5,0266,2704,9884,5416,233 Differential State Level Results")
40
KPT Hit Rate Analysis (Continued) Department Level Results (1)(2)(3)(4)(5) Non-Caucasian Non-Caucasian or Hispanic BlackHispanic Black or Hispanic West Hartford Chi2 P-Value0.3790.002***0.3790.001***0.002*** Differential 0.120.2020.120.2080.202 State Police- Troop C Chi2 P-Value0.013**0.002***0.017**0.042**0.003*** Differential 0.2060.2010.1990.1040.194 State Police- Troop F Chi2 P-Value0.012**0.002***0.012**0.033**0.002*** Differential 0.1990.2380.1990.2080.238 State Police- Troop I Chi2 P-Value0.003***0.005*** 0.2330.007*** Differential 0.0330.0680.0290.0640.065 Waterbury Chi2 P-Value0.004*** 0.007***0*** Hit Rate0.0180.1120.0140.1140.146
 Department Level Results (1)(2)(3)(4)(5) Non-Caucasian Non-Caucasian or Hispanic BlackHispanic Black or Hispanic West Hartford Chi2 P-Value *** ***0.002*** Differential State Police- Troop C Chi2 P-Value0.013**0.002***0.017**0.042**0.003*** Differential State Police- Troop F Chi2 P-Value0.012**0.002***0.012**0.033**0.002*** Differential State Police- Troop I Chi2 P-Value0.003***0.005*** *** Differential Waterbury Chi2 P-Value0.004*** 0.007***0*** Hit Rate")
41
Solar-Powered Search Rates If racial bias is driven by the ability of officers to observe the race of drivers before making a stop, then we should observe a statistical disparity between the search-rate of minority stops occurring in daylight vs. darkness. o Developed by Ritter (U. Minnesota) in 2013 o Utilizes pre and post-stop data to develop a second-stage test o Restricts sample to intertwilight window o Control statistically for a number of factors that could change risk-set Time of the day, day of the week, state traffic volume, police department, time of day*department fixed effects, day of the week*department fixed effects, and volume*department o Estimates are for several minority definitions o Sample size is very small for many departments
 in 2013 o Utilizes pre and post-stop data to develop a second-stage test o Restricts sample to intertwilight window o Control statistically for a number of factors that could change risk-set Time of the day, day of the week, state traffic volume, police department, time of day*department fixed effects, day of the week*department fixed effects, and volume*department o Estimates are for several minority definitions o Sample size is very small for many departments.")
42
Solar-Powered Search Rates (Continued) (1)(2)(3)(4)(5) Non-Caucasian Non-Caucasian or Hispanic BlackHispanic Black or Hispanic Darkness -0.217-0.233-0.362-0.316-0.281 (0.289)(0.215)(0.311)(0.275)(0.214) R20.1770.1320.1780.1670.126 State Level Results
 (1)(2)(3)(4)(5) Non-Caucasian Non-Caucasian or Hispanic BlackHispanic Black or Hispanic Darkness (0.289)(0.215)(0.311)(0.275)(0.214) R State Level Results")
43
Solar-Powered Search Rates (Continued) Department Level Results (1)(2)(3)(4)(5) Non-Caucasian Non-Caucasian or Hispanic BlackHispanic Black or Hispanic GlastonburyDarkness -33.291.965 4.511*2.342 (6212.0)(1.296) (2.624)(1.465) WaterburyDarkness 2.177* 2.858*2.151* (1.202) (1.602)(1.199) State Police- Troop A Darkness 1.307*1.037*1.348*0.7581.048* (0.694)(0.537)(0.708)(1.007)(0.537) State Police- Troop C Darkness 3.047**1.0242.692**-0.5120.948 (1.340)(0.729)(1.274)(1.295)(0.716)
 Department Level Results (1)(2)(3)(4)(5) Non-Caucasian Non-Caucasian or Hispanic BlackHispanic Black or Hispanic GlastonburyDarkness *2.342 (6212.0)(1.296) (2.624)(1.465) WaterburyDarkness 2.177* 2.858*2.151* (1.202) (1.602)(1.199) State Police- Troop A Darkness 1.307*1.037*1.348* * (0.694)(0.537)(0.708)(1.007)(0.537) State Police- Troop C Darkness 3.047** ** (1.340)(0.729)(1.274)(1.295)(0.716)")
44
Summary of Findings Statewide Results o A total of 13.5 % of motorists stopped during the analysis period were observed to be Black. A comparable 11.7 % of stops were of motorists from a Hispanic descent. The results from the Veil of Darkness analysis indicated that minority stops were more likely to have occurred during daylight hours than at night. The statistical disparity provides evidence in support of the claim that certain officers in the state are engaged in racial profiling during daylight hours when motorist race and ethnicity is visible. o The results from the post-stop analysis confirm that the disparity carries through to post-stop behavior for Hispanics. It is important to note that it is specific officers and departments that are driving these statewide trends

45
Summary of Findings Departmental Results The results from the Veil of Darkness indicated that minority motorists, across all racial and ethnic categories, were more likely to have been stopped during daylight as opposed to darkness hours. The analysis using the Veil of Darkness produced sufficiently strong results to make a determination that these results indicate the presence of a significant racial and ethnic disparity for: o Groton Town o Granby o Waterbury o State Police Troop C o State Police Troop H

46
Summary of Findings Departmental Results The results from the post-stop analysis indicated that minority motorists, as compared to their Caucasian counterparts, were being searched more frequently relative to the rate at which they were found with contraband. The results of the post-stop analysis produced sufficiently strong results to make a determination that these results indicate the presence of a significant racial and ethnic disparity for: o Waterbury o State Police Troop C

47
Summary of Findings 12 Departments were identified using 4 the descriptive measures. o 7 Departments exceeded the disparity threshold levels in at least 3 of the 4 benchmarks as well as a majority of the 12 possible measures. These departments will be reviewed further by the project staff. Wethersfield Hamden Manchester New Britain Stratford Waterbury East Hartford o 5 Departments exceeded the disparity threshold levels in at least 2 of the 4 benchmarks as well as 6 of 12 measures. These departments will be monitored to determine if changes relative to the benchmarks indicate the need for further analysis. Meriden New Haven Newington Norwich Windsor

48
Next Steps Further analysis will be conducted on the 10 municipal police departments and 2 state police troops. A more robust report will be conducted with the collection of additional data. In the coming weeks the project staff will publish a detailed guide of steps that can be taken by all law enforcement agencies to address disparities in their communities. o Fair and Impartial Policing training will be offered to the above mentioned departments. o We will work with law enforcement and local officials to host community dialogues.

Similar presentations