Download presentation
Presentation is loading. Please wait.

1
Population Dynamics

2
Population Dynamics Outline
Characteristics of a Population Population Dynamics and Carrying Capacity Reproductive Strategies Conservation Biology Human Impacts Working with Nature

3
Characteristics of a Population
Population - individuals inhabiting the same area at the same time Population Dynamics: Population change due to Population Size - number of individuals Population Density - population size in a certain space at a given time Population Dispersion - spatial pattern in habitat Age Structure - proportion of individuals in each age group in population

4
Population Size Natality Mortality
Number of individuals added through reproduction Crude Birth Rate - Births per 1000 CBR= (Births/Population)*1000 Total Fertility Rate – Average number of children born alive per woman in her lifetime Mortality Number of individuals removed through death Crude Death Rate Deaths per 1000
*1000. Total Fertility Rate – Average number of children born alive per woman in her lifetime. Mortality. Number of individuals removed through death. Crude Death Rate Deaths per")
5
Population Density Population Density (or ecological population density) is the amount of individuals in a population per unit habitat area Some species exist in high densities - Mice Some species exist in low densities - Mountain lions Density depends upon social/population structure mating relationships time of year

6
Population Dispersion
Population dispersion is the spatial pattern of distribution There are three main classifications Clumped: individuals are lumped into groups ex. Flocking birds or herbivore herds due to resources that are clumped or social interactions most common

7
Population Dispersion
Uniform: Individuals are regularly spaced in the environment - ex. Creosote bush due to antagonism between individuals, or do to regular spacing of resources rare because resources are rarely evenly spaced tips/2002/clover611.htm Random: Individuals are randomly dispersed in the environment ex. Dandelions due to random distribution of resources in the environment, and neither positive nor negative interaction between individuals rare because these conditions are rarely met

8
Population Histogram A population histogram shows the age structure of a population and is usually shown graphically The population is usually divided up into prereproductives, reproductives and postreproductives The age structure of a population dictates whether is will grow, shrink, or stay the same size

9
Population Histograms
Positive Growth Zero Growth Negative Growth (ZPG) Pyramid Shape Vertical Edges Inverted Pyramid
 Pyramid Shape Vertical Edges Inverted Pyramid.")
10
Population Dynamics Outline
Characteristics of a Population Population Dynamics Carrying Capacity Reproductive Strategies Conservation Biology Human Impacts Working with Nature

11
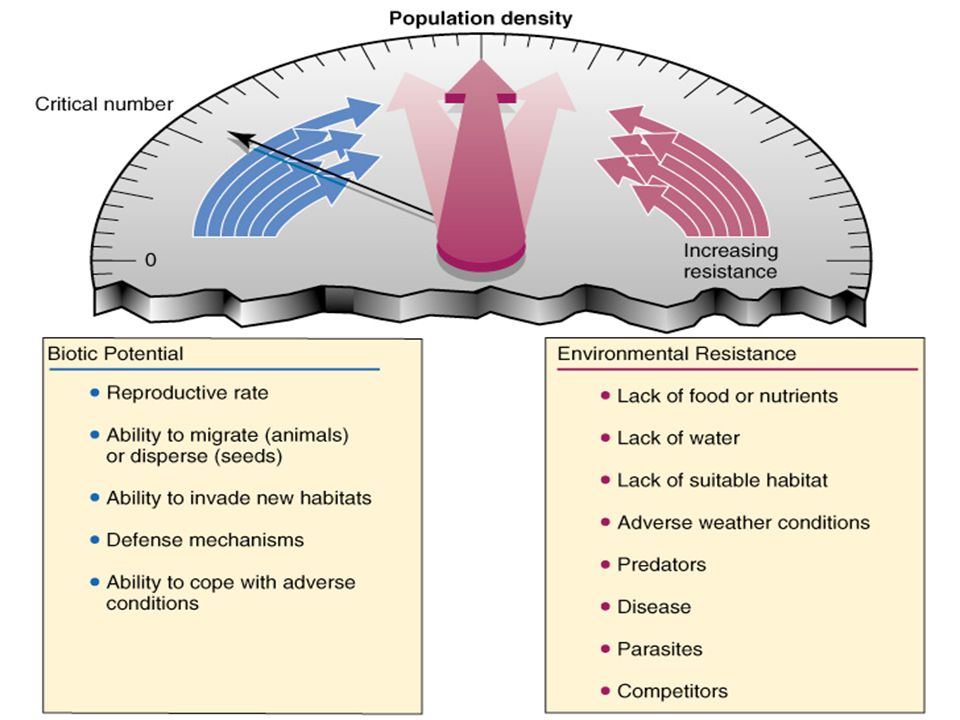
Biotic Potential Ability of populations of a given species to increase in size Abiotic Contributing Factors: Favorable light Favorable Temperatures Favorable chemical environment - nutrients Biotic Contributing Factors: Reproductive rate Generalized niche Ability to migrate or disperse Adequate defense mechanisms Ability to cope with adverse conditions

12
Environmental Resistance
Ability of populations of a given species to decrease in size (limiting factors) Abiotic Contributing Factors: Unfavorable light Unfavorable Temperatures Unfavorable chemical environment - nutrients Biotic Contributing Factors: Low reproductive rate Specialized niche Inability to migrate or disperse Inadequate defense mechanisms Inability to cope with adverse conditions
 Abiotic Contributing Factors: Unfavorable light. Unfavorable Temperatures. Unfavorable chemical environment - nutrients. Biotic Contributing Factors: Low reproductive rate. Specialized niche. Inability to migrate or disperse. Inadequate defense mechanisms. Inability to cope with adverse conditions.")
13
Environmental Resistance
Biotic Potential factors allow a population to increase under ideal conditions, potentially leading to exponential growth Environmental Resistance affect the young more than the elderly in a population, thereby affecting survival to reproductive age

15
Population Growth Population growth depends upon birth rates
death rates immigration rates (into area) emigration rates (exit area)
 emigration rates (exit area)")
16
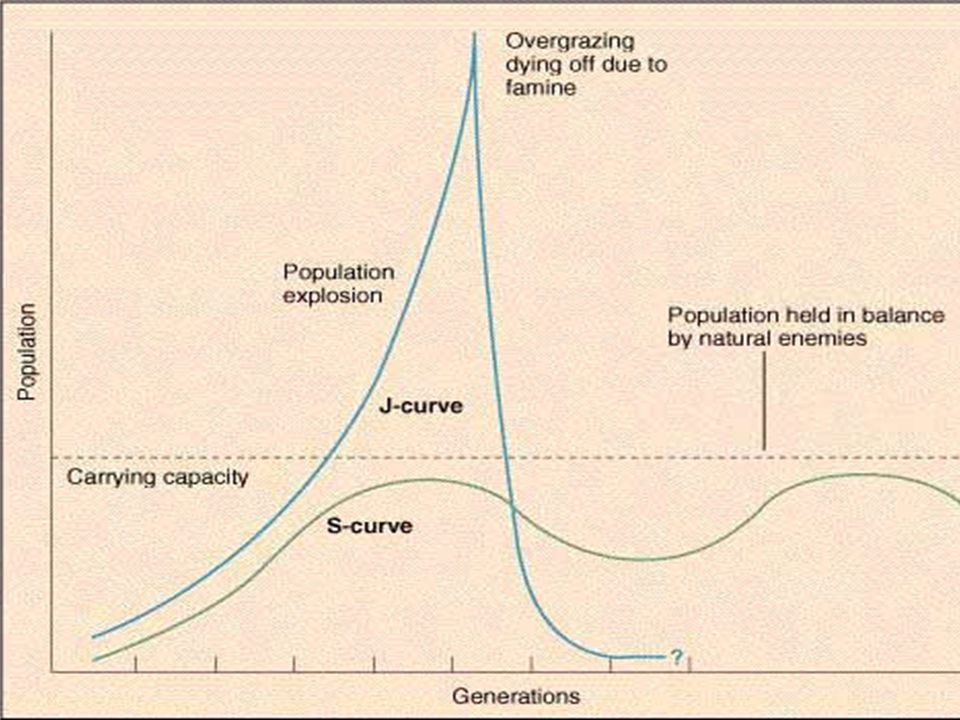
Population Growth Populations show two types of growth Exponential
J-shaped curve Growth is independent of population density Logistic S-shaped curve Growth is not independent of population density

17
Exponential Growth As early as Darwin, scientists have realized that populations have the ability to grow exponentially All populations have this ability, although not all populations realized this type of growth Darwin pondered the question of exponential growth. He knew that all species had the potential to grow exponentially He used elephants as an example because elephants are one of the slowest breeders on the planet

18
Exponential Growth 19,000,000 elephants!!!
One female will produce 6 young over her 100 year life span. In a population, this amounts to a growth rate of 2% Darwin wondered, how many elephants could result from one male and one female in 750 years? 19,000,000 elephants!!!

19
Exponential Growth Graph

20
Population Dynamics and Carrying Capacity
Basic Concept: Over a long period of time, populations of species in an ecosystem are usually in a state of equilibrium (balance between births and deaths) There is a dynamic balance between biotic potential and environmental resistance
 There is a dynamic balance between biotic potential and environmental resistance.")
21
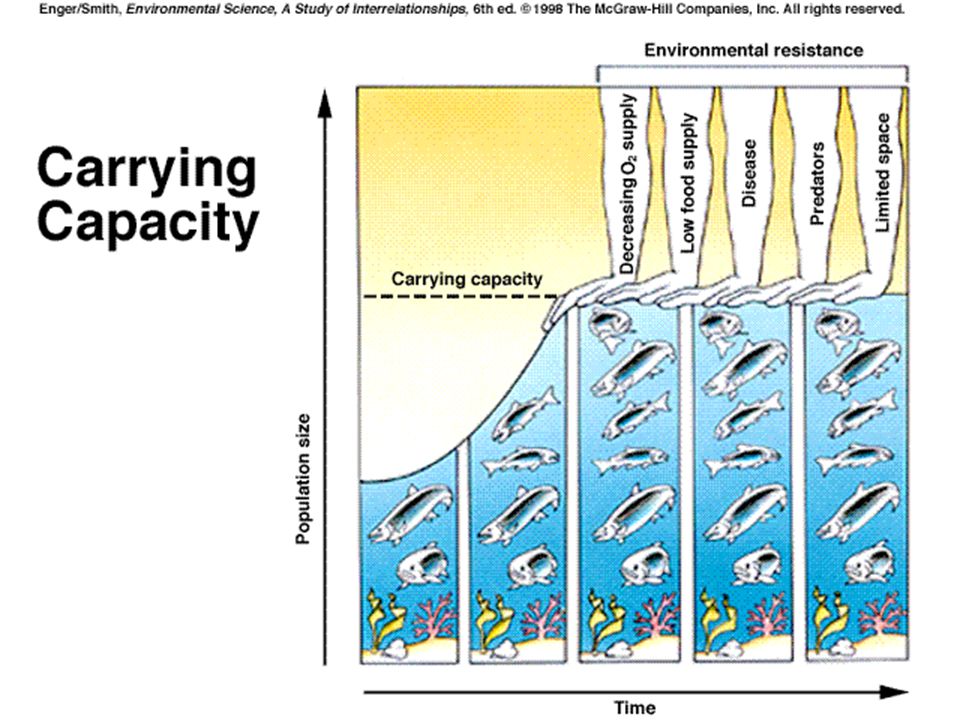
Carrying Capacity (K) Exponential curve is not realistic due to carrying capacity of area Carrying capacity is maximum number of individuals a habitat can support over a given period of time due to environmental resistance (sustainability)
")
23
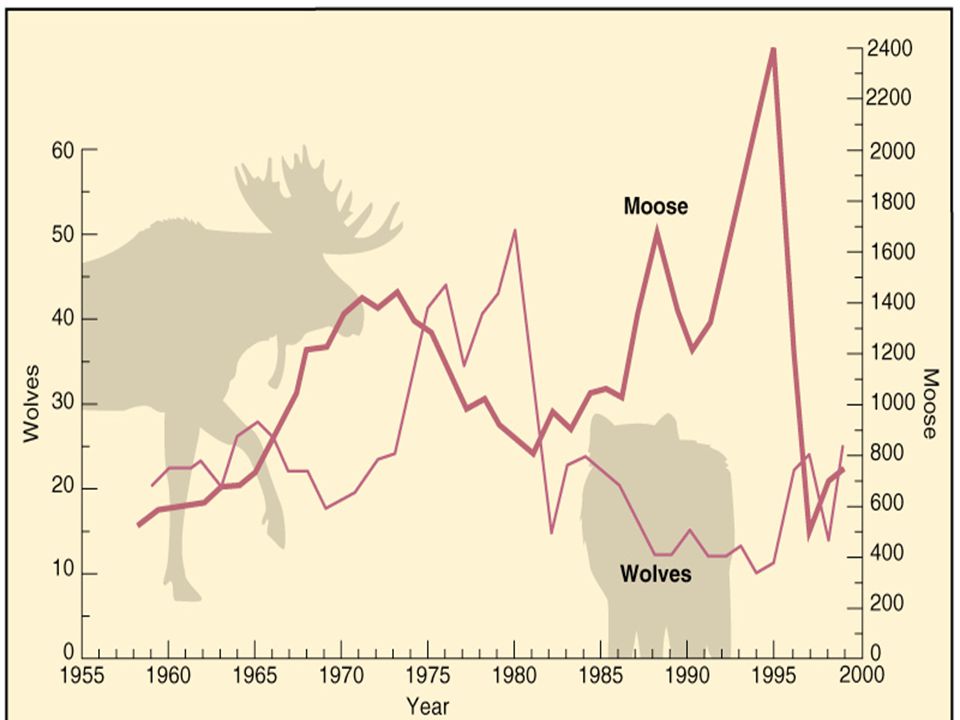
Logistic Growth Because of Environmental Resistance, population growth decreases as density reaches carrying capacity Graph of individuals vs. time yields a sigmoid or S-curved growth curve Reproductive time lag causes population overshoot Population will not be steady curve due to resources (prey) and predators
 and predators.")
26
Population Dynamics Outline
Characteristics of a Population Population Dynamics and Carrying Capacity Reproductive Strategies Conservation Biology Human Impacts

27
Reproductive Strategies
Goal of every species is to produce as many offspring as possible Each individual has a limited amount of energy to put towards life and reproduction This leads to a trade-off of long life or high reproductive rate Natural Selection has lead to two strategies for species: r - strategists and K - strategists

28
r - Strategists Spend most of their time in exponential growth
Maximize reproductive life Minimum life K

29
R Strategists Many small offspring
Little or no parental care and protection of offspring Early reproductive age Most offspring die before reaching reproductive age Small in size Adapted to unstable climate and environmental conditions High population growth rate – (r) Population size fluctuates wildly above and below carrying capacity – (K) Generalist niche Low ability to compete Early successional species
 Population size fluctuates wildly above and below carrying capacity – (K) Generalist niche. Low ability to compete. Early successional species.")
30
K - Strategists Maintain population at carrying capacity (K)
Maximize lifespan K

31
K- Strategist Fewer, larger offspring
High parental care and protection of offspring Later reproductive age Most offspring survive to reproductive age Larger adults Adapted to stable climate and environmental conditions Lower population growth rate (r) Population size fairly stable and usually close to carrying capacity (K) Specialist niche High ability to compete
 Population size fairly stable and usually close to carrying capacity (K) Specialist niche. High ability to compete.")
32
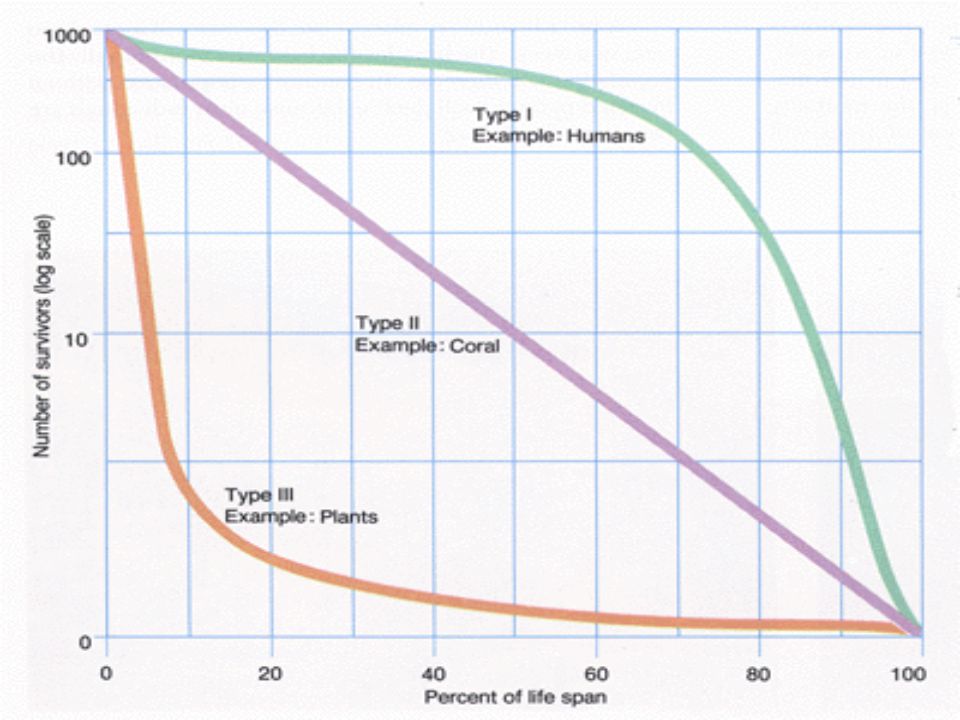
Survivorship Curves Late Loss: K-strategists that produce few young and care for them until they reach reproductive age thus reducing juvenile mortality Constant Loss: typically intermediate reproductive strategies with fairly constant mortality throughout all age classes Early Loss: r-strategists with many offspring, high infant mortality and high survivorship once a certain size and age

34
Population Dynamics Outline
Characteristics of a Population Population Dynamics and Carrying Capacity Reproductive Strategies Human Impacts

35
Human Impacts Fragmentation and degrading habitat
Simplifying natural ecosystems Strengthening some populations of pest species and disease-causing bacteria by overuse of pesticides Elimination of some predators

36
Human Impacts Deliberately or accidentally introducing new species
Overharvesting potentially renewable resources Interfering with the normal chemical cycling and energy flows in ecosystem

37
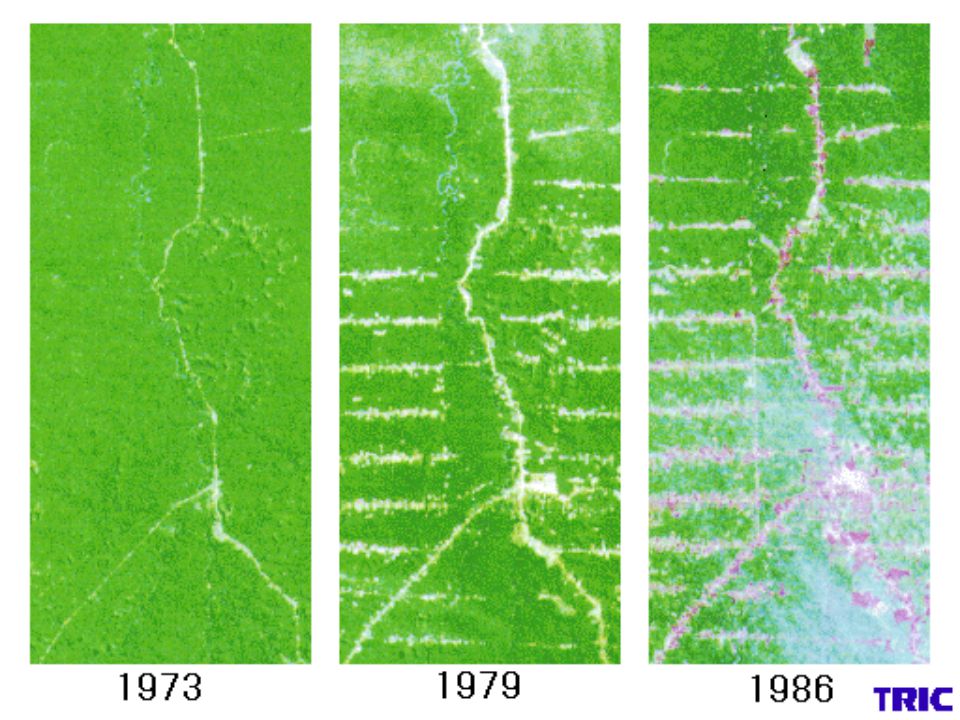
Habitat Fragmentation
Process by which human activity breaks natural ecosystems into smaller and smaller pieces of land Greatest impact on populations of species that require large areas of continuous habitat Also called habitat islands

39
Habitat fragmentation in northern Alberta
Habitat fragmentation in northern Alberta

40
Principles of Sustainability
Solutions Principles of Sustainability Lessons for Us How Nature Works Runs on renewable solar energy. Recycles nutrients and wastes. There is little waste in nature. Uses biodiversity to maintain itself and adapt to new environmental conditions. Controls a species population size and resource use by interactions with its environment and other species. Rely mostly on renewable solar energy. Prevent and reduce pollution and recycle and reuse resources. Preserve biodiversity by protecting ecosystem services and preventing premature extinction of species. Reduce births and wasteful resource use to prevent environmental overload and depletion and degradation of resources.

41
Four Principles for Sustainablility
We are part of, not apart from, the earth’s dynamic web of life. Our lives, lifestyles, and economies are totally dependent on the sun and the earth. We can never do merely one thing (first law of human ecology – Garret Hardin). Everything is connected to everything else; we are all in it together.
. Everything is connected to everything else; we are all in it together.")
Similar presentations


 that live in the same place at the same time and compete for the same resources. Resources.>")


