Download presentation
Presentation is loading. Please wait.

1
Correlation

2
The Problem Are two variables related?Are two variables related? XDoes one increase as the other increases? e. g. skills and incomee. g. skills and income XDoes one decrease as the other increases? e. g. health problems and nutritione. g. health problems and nutrition How can we get a numerical measure of the degree of relationship?How can we get a numerical measure of the degree of relationship?

3
Scatterplots Examples from textExamples from text XSee next three slides Infant mortality and number of physiciansInfant mortality and number of physicians Life expectancy and health care expendituresLife expectancy and health care expenditures Cancer rate and solar radiationCancer rate and solar radiation

7
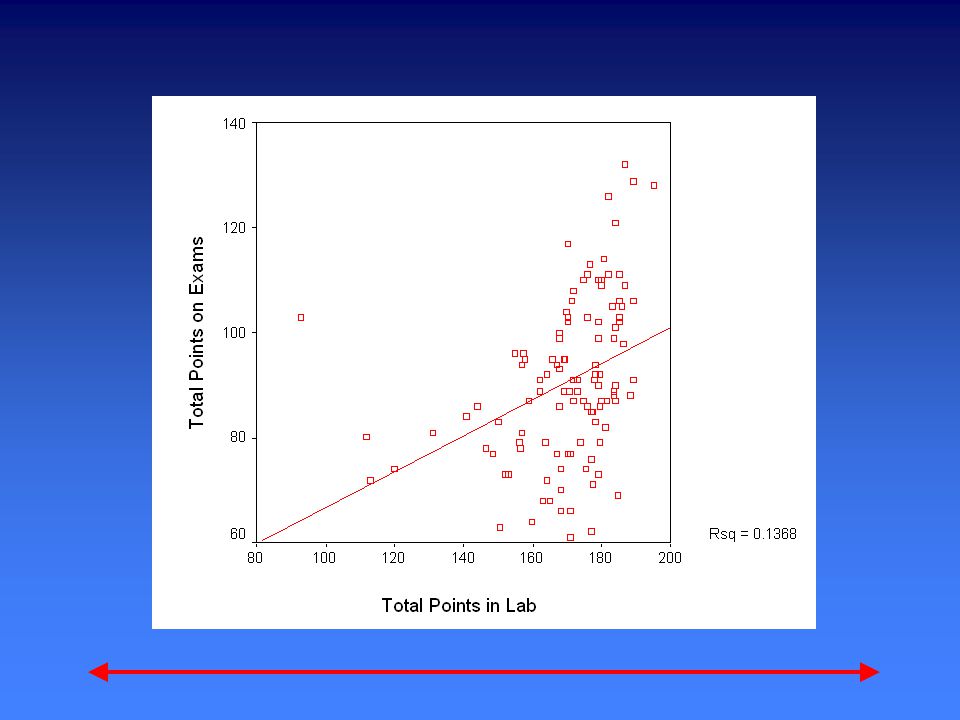
An Example An actual course with both a lab and an exam component of final gradesAn actual course with both a lab and an exam component of final grades Plotting exam component against lab componentPlotting exam component against lab component XFairly weak relationship XRelationship is positive

9
Exams and Labs Note relationship is weak, but real.Note relationship is weak, but real. Note most data cluster on right.Note most data cluster on right. Why do we care about relationship?Why do we care about relationship? XWhat would students conclude if there were no relationship? XWhat if the relationship were near perfect? XWhat if the relationship were negative?

10
Heart Disease and Cigarettes Landwehr & Watkins report data on heart disease and cigarette smoking in 21 developed countriesLandwehr & Watkins report data on heart disease and cigarette smoking in 21 developed countries Data have been rounded for computational convenience.Data have been rounded for computational convenience. XThe results were not affected.

11
The Data Surprisingly, the U.S. is the first country on the list--the country with the highest consumption and highest mortality.

12
Scatterplot of Heart Disease CHD Mortality goes on ordinateCHD Mortality goes on ordinate XWhy? Cigarette consumption on abscissaCigarette consumption on abscissa XWhy? What does each dot represent?What does each dot represent? Best fitting line included for clarityBest fitting line included for clarity

13
{X = 6, Y = 11}

14
What Does the Scatterplot Show? As smoking increases, so does coronary heart disease mortality.As smoking increases, so does coronary heart disease mortality. Relationship looks strongRelationship looks strong Not all data points on line.Not all data points on line. XThis gives us “residuals” or “errors of prediction” To be discussed laterTo be discussed later

15
Correlation Coefficient A measure of degree of relationship.A measure of degree of relationship. Sign refers to direction.Sign refers to direction. Based on covarianceBased on covariance XMeasure of degree to which large scores go with large scores, and small scores with small scores

16
Covariance The formulaThe formula How this works, and whyHow this works, and why When would cov XY be large and positive?When would cov XY be large and positive? When would cov XY be large and negative?When would cov XY be large and negative?

17
Correlation Coefficient Symbolized by rSymbolized by r Covariance ÷ (product of st. dev.)Covariance ÷ (product of st. dev.)
Covariance ÷ (product of st. dev.).")
18
Calculation Cov XY = 11.13Cov XY = 11.13 s X = 2.33s X = 2.33 s Y = 6.69s Y = 6.69

19
Correlation--cont. Correlation =.71Correlation =.71 Sign is positiveSign is positive XWhy? If sign were negativeIf sign were negative XWhat would it mean? XWould not alter the degree of relationship.

20
Factors Affecting r Range restrictionsRange restrictions XSee next slide Data only for countries with low consumptionData only for countries with low consumption NonlinearityNonlinearity Xe.g. age and size of vocabulary Heterogeneous subsamplesHeterogeneous subsamples XEveryday examples

21
Countries With Low Consumptions Data With Restricted Range Truncated at 5 Cigarettes Per Day Cigarette Consumption per Adult per Day 5.55.04.54.03.53.02.5 CHD Mortality per 10,000 20 18 16 14 12 10 8 6 4 2

22
Testing r Population parameter = Population parameter = Null hypothesis H 0 : = 0Null hypothesis H 0 : = 0 XTest of linear independence XWhat would a true null mean here? XWhat would a false null mean here? Alternative hypothesis (H 1 ) 0Alternative hypothesis (H 1 ) 0 XTwo-tailed
 0Alternative hypothesis (H 1 ) 0 XTwo-tailed.")
23
Tables of Significance Table in Appendix E.2Table in Appendix E.2 For N - 2 = 19 df, r crit =.433For N - 2 = 19 df, r crit =.433 Our correlation >.433Our correlation >.433 Reject H 0Reject H 0 XCorrelation is significant. XGreater cigarette consumption associated with higher CHD mortality.

24
Computer Printout Printout gives test of significance.Printout gives test of significance. See next slide.See next slide. XDouble asterisks with footnote indicate p <.01.

25
SPSS Printout

26
Intercorrelation Matrix Matrix of correlations of several variables at once.Matrix of correlations of several variables at once. Example from Kliewer et al (1998) JCCPExample from Kliewer et al (1998) JCCP X99 young children XMeasured level of Witness violence, Intrusive thoughts, Social support, and Internalizing symptomsWitness violence, Intrusive thoughts, Social support, and Internalizing symptoms XDefine these variables
 JCCPExample from Kliewer et al (1998) JCCP X99 young children XMeasured level of Witness violence, Intrusive thoughts, Social support, and Internalizing symptomsWitness violence, Intrusive thoughts, Social support, and Internalizing symptoms XDefine these variables.")
27
Cont.

28
Intercorrelation Matrix--cont. Describe the table.Describe the table. What does this tell us about the effects of witnessing violence?What does this tell us about the effects of witnessing violence? What role does social support play?What role does social support play?

Similar presentations


 measures the strength of the linear relationship.>")

 Association Between Variables Measured at the Interval-Ratio Level: Bivariate Correlation and Regression.>")


