Download presentation
Presentation is loading. Please wait.

1
World map showing plate boundaries (blue lines), the distribution of recent earthquakes (yellow dots) and active volcanoes (red triangles). Courtesy of NASA. VOLCANO-TECTONIC DYNAMICS The earth is a dynamic planet. Its rigid outer surface layer is broken into several tectonic plates which are in constant motion relative to one another. As demonstrated in the world map below, most of the ~550 active volcanoes on earth are located along the margins of adjacent plates.active volcanoes

2
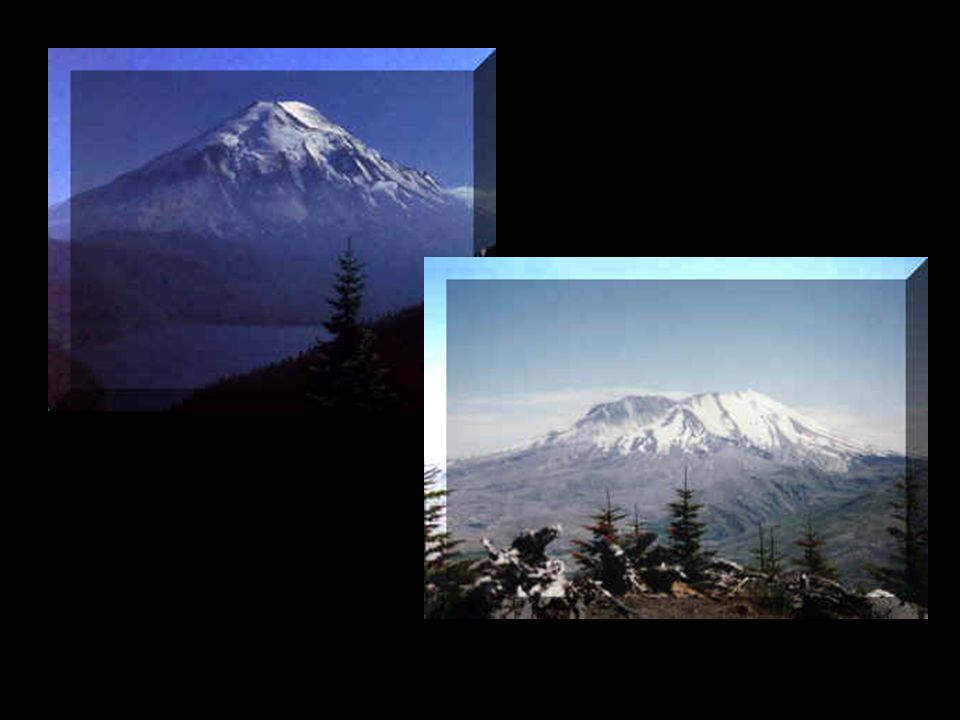
May 18, 1980 Eruption of Mount St. Helens

3
Secondary Eruption of Mount St. Helens 1980

5
Increased Seismic Activity

6
U.S. Geological Survey, Vancouver, Washington University of Washington, Pacific Northwest Seismograph Network, Seattle, Washington Mount St. Helens Information Statement, September 24, 2004 10:00 AM, PDT Since about 2 am PDT on the morning of 09/23 an earthquake swarm has been occurring at Mount St. Helens. Through 5 P.M. PDT on 09/23 about 200 small (less than magnitude 1) earthquakes have been located at MSH, and many smaller events have also been recorded through this morning. The earthquakes are occurring at shallow depths (less than 1 kilometer, or 1/2 mile) mostly under the lava dome that formed between 1980 and 1986. Such earthquakes are common at MSH, but a swarm with this many earthquakes has not been recorded for several years, most recently on November 3-4, 2001. The cause of such shallow swarms is uncertain, but may reflect increased ground water levels with the onset of autumn rain. The probability of small steam explosions that hurl rocks a few hundred meters (yards) may also be increased during periods with increased shallow earthquakes. Prior to the 2001 swarm, the last period of increased earthquake activity at Mount St. Helens occurred in the spring and summer of 1998 when hundreds of earthquakes per month, most smaller than M=2, were detected at depths as great as 9 kilometers (6 miles). An intrusion of magma (or molten rock) deep under the volcano and resulting increased gas pressure in the conduit that leads to the lava dome likely caused this increase in earthquakes. The current swarm is different in that the events are typically much smaller and shallower. We see no evidence that an intrusion of magma similar to that of 1998 is underway. We continue to monitor the situation closely and will issue additional Updates as warranted.
 earthquakes have been located at MSH, and many smaller events have also been recorded through this morning. The earthquakes are occurring at shallow depths (less than 1 kilometer, or 1/2 mile) mostly under the lava dome that formed between 1980 and Such earthquakes are common at MSH, but a swarm with this many earthquakes has not been recorded for several years, most recently on November 3-4, The cause of such shallow swarms is uncertain, but may reflect increased ground water levels with the onset of autumn rain. The probability of small steam explosions that hurl rocks a few hundred meters (yards) may also be increased during periods with increased shallow earthquakes. Prior to the 2001 swarm, the last period of increased earthquake activity at Mount St. Helens occurred in the spring and summer of 1998 when hundreds of earthquakes per month, most smaller than M=2, were detected at depths as great as 9 kilometers (6 miles). An intrusion of magma (or molten rock) deep under the volcano and resulting increased gas pressure in the conduit that leads to the lava dome likely caused this increase in earthquakes. The current swarm is different in that the events are typically much smaller and shallower. We see no evidence that an intrusion of magma similar to that of 1998 is underway. We continue to monitor the situation closely and will issue additional Updates as warranted..")
7
Increased in seismic activity

9
Mount St. Helens Information Statement October 1, 2004, 12:45 P.M., PDT This Information Statement describes a new feature that has developed in the crater of Mount St. Helens over the past few days. Photographs taken by scientists during gas flights show that an area of about 5 to10 acres on the crater glacier, just south of the 1980-86 lava dome, has risen up to several tens of feet (exact amount is not known) and has become increasingly crevassed (cracked). The crevasses are up to several feet wide and perhaps tens of feet deep. We think that this localized deformation is caused by a portion of the south side of the lava dome and crater floor pushing upward in a piston-like motion and lifting overlying snow, glacier ice, and rock debris that is tens to several hundred feet thick. Because there is no sign of steaming or rapid melting, we infer that old, cold dome rock is in contact with the glacier and not new lava, which would be hot enough to cause steaming.
 and has become increasingly crevassed (cracked). The crevasses are up to several feet wide and perhaps tens of feet deep. We think that this localized deformation is caused by a portion of the south side of the lava dome and crater floor pushing upward in a piston-like motion and lifting overlying snow, glacier ice, and rock debris that is tens to several hundred feet thick. Because there is no sign of steaming or rapid melting, we infer that old, cold dome rock is in contact with the glacier and not new lava, which would be hot enough to cause steaming..")
10
Amendment made at 12:45 P.M. This area is the source of the steam and ash emission that began shortly after noon. We continue to monitor the situation closely and will issue additional updates as warranted Mount St. Helens Information Statement, October 1, 2004, 1:45 P.M., PDT Mount St. Helens remains at Alert Level 2—Volcano Advisory Shortly before noon today, Mount St. Helens emitted a plume of steam and minor ash from an area of new crevasses in the crater glacier south of the 1980-86 lava dome. This area was described in the prior Information Statement issued at 12:45 P.M. The event lasted from 11:57 to 12:21 PDT and created a pale-gray cloud that reached an altitude of about 9700 ft (from pilot reports). It drifted southwestward, where nearby residents should receive no more than a minor dusting of ash.
. It drifted southwestward, where nearby residents should receive no more than a minor dusting of ash..")
11
Small Explosion Oct 1,2004

12
Mount St. Helens Notice of Volcano Alert, October 2, 2004 A notice of Volcano Alert (Alert Level 3) was issued today at 2:00 p.m. PDT Immediately after the small steam emission at 12:15, seismic activity changed from principally rock breakage events to continuous low-frequency tremor, which is indicative of magma movement. We are increasing the alert level to Volcano Alert the highest alert level indicating that an eruption could be imminent. The cause and outcome of the accelerating unrest is uncertain. Explosions from the vent could occur suddenly and without further warning. During such explosions the dome and crater floor are at greatest risk from ballistic projectiles, but the rim of the crater and flanks of the volcano could also be at risk. Explosions would also be expected to produce ash clouds that rise several to tens of thousands of feet above the crater rim and drift downwind. Currently wind forecasts from the National Weather Service, combined with eruption models, show that ash clouds will move to the northwest. If ash emissions are large, drifting ash could affect downwind communities. Minor melting of the glacier could trigger debris flows from the crater that are large enough to reach the Pumice Plain. There is very low probability that downstream communities would be impacted by these hydrologic events..
 was issued today at 2:00 p.m. PDT Immediately after the small steam emission at 12:15, seismic activity changed from principally rock breakage events to continuous low-frequency tremor, which is indicative of magma movement. We are increasing the alert level to Volcano Alert the highest alert level indicating that an eruption could be imminent. The cause and outcome of the accelerating unrest is uncertain. Explosions from the vent could occur suddenly and without further warning. During such explosions the dome and crater floor are at greatest risk from ballistic projectiles, but the rim of the crater and flanks of the volcano could also be at risk. Explosions would also be expected to produce ash clouds that rise several to tens of thousands of feet above the crater rim and drift downwind. Currently wind forecasts from the National Weather Service, combined with eruption models, show that ash clouds will move to the northwest. If ash emissions are large, drifting ash could affect downwind communities. Minor melting of the glacier could trigger debris flows from the crater that are large enough to reach the Pumice Plain. There is very low probability that downstream communities would be impacted by these hydrologic events...")
13
Mount St. Helens Update, October 3, 2004, 8:00 A.M. Current status is Volcano Alert (Alert Level 3); aviation color code RED Overnight (about 3 am) there was a tremor burst that lasted about 25 minutes. No eruptive plume was detected as a result of this tremor. Following the tremor, seismic activity dropped, but now is at a level similar to that before the tremor burst. Earthquakes are occurring at a rate of 1-2 per minute with maximum earthquake magnitudes of about M3. All earthquake locations remain shallow. During yesterday’s gas flight, scientists saw an increase in the number of fumaroles on the lava dome and detected some carbon dioxide. The total amount awaits further data reduction. Scientists also reported intermittently the smell of hydrogen sulfide (rotten-egg smell) over the crater. Data from the GPS instruments on the flanks of the volcano show no significant changes.
; aviation color code RED Overnight (about 3 am) there was a tremor burst that lasted about 25 minutes. No eruptive plume was detected as a result of this tremor. Following the tremor, seismic activity dropped, but now is at a level similar to that before the tremor burst. Earthquakes are occurring at a rate of 1-2 per minute with maximum earthquake magnitudes of about M3. All earthquake locations remain shallow. During yesterday’s gas flight, scientists saw an increase in the number of fumaroles on the lava dome and detected some carbon dioxide. The total amount awaits further data reduction. Scientists also reported intermittently the smell of hydrogen sulfide (rotten-egg smell) over the crater. Data from the GPS instruments on the flanks of the volcano show no significant changes..")
14
Green = >1 mo < 1yr Red = Recent < 1 month

16
Recent Seismisity Time vs Depth Plot Red = Recent Green = >1 mo < 1yr

17
Mount St. Helens Update 5 October 2004 7:00 A.M. Current status is Volcano Alert (Alert Level 3); aviation color code RED Yesterday visitors to Mount St. Helens witnessed a 30-minute-long steam-and-ash emission starting at 9:43 a.m. PDT and a 10- minute-long steam-and-ash emission starting at 14:10 p.m. PDT. The larger one dusted roads to the the SE of the volcano with ash. Maximum thickness of the ash at 8 km (about 5 miles) was 0.2 mm (less than 1/8 of an inch). Neither event generated earthquakes or an explosion signal. We infer that hot rock was pushed up into the glacier, melted ice, and generated the steam. Part of the vent for yesterday’s and other steam and ash emissions of the past few days is now covered by a bubbling lake. Since yesterday's emissions, earthquake energy has slowly increased to previous high values. Visual observations show that the area of uplift, which includes part of the glacier and a nearby segment of the south flank of the lava dome, continues to rise. Thermal surveys of the dome confirms the deformation. Hot cracks (40-50° C; about 100-120° F, well below magmatic temperatures) in the dome are opening, and dome rocks are avalanching off the dome into the lake and onto the south crater floor. The north flank of the dome appears thermally stable.
; aviation color code RED Yesterday visitors to Mount St. Helens witnessed a 30-minute-long steam-and-ash emission starting at 9:43 a.m. PDT and a 10- minute-long steam-and-ash emission starting at 14:10 p.m. PDT. The larger one dusted roads to the the SE of the volcano with ash. Maximum thickness of the ash at 8 km (about 5 miles) was 0.2 mm (less than 1/8 of an inch). Neither event generated earthquakes or an explosion signal. We infer that hot rock was pushed up into the glacier, melted ice, and generated the steam. Part of the vent for yesterday’s and other steam and ash emissions of the past few days is now covered by a bubbling lake. Since yesterday s emissions, earthquake energy has slowly increased to previous high values. Visual observations show that the area of uplift, which includes part of the glacier and a nearby segment of the south flank of the lava dome, continues to rise. Thermal surveys of the dome confirms the deformation. Hot cracks (40-50° C; about ° F, well below magmatic temperatures) in the dome are opening, and dome rocks are avalanching off the dome into the lake and onto the south crater floor. The north flank of the dome appears thermally stable..")
18
http://www.fs.fed.us/gpnf/volcanocams/msh/

19
What’s Erupting? Mt. Etna, Sicily (November 2002) -- Basaltic volcanism began on Mt. Etna in 1999 and has continued through 2003. The photograph here is from a sustained volcanic eruption from fractures on the south flank of Mt. Etna in November 2002. Image courtesy of Tom Pfeiffer (copyright).
..")
20
Nyiragongo and Nyamuragira Volcanoes -- These volcanoes lie within the east Aftican rift system in the Republic of the Congo. Nyiragongo is the prominent peak to the right, and Nyamuragira is the broader volcano to the left. Nyiragongo erupted on January 17, 2002, sending streams of lava (red in this false-color image) across the town of Goma (pinkish region) and into Lake Kivu (foreground). More than 100 people were killed, over 12,000 homes destroyed, and hundreds of thousands of people were forced to flee their community. Courtesy of NASA.
 across the town of Goma (pinkish region) and into Lake Kivu (foreground). More than 100 people were killed, over 12,000 homes destroyed, and hundreds of thousands of people were forced to flee their community. Courtesy of NASA..")
21
The model above depicts a cross-sectional view an explosively erupting volcano, typical of a so-called Plinian eruption. A variety of pressure surfaces exist within the magma column beneath the erupting volcano, and within the eruption column above the volcano.Plinian eruption

22
http://www.geology.sdsu.edu/how_volcanoes_w ork/index.html EXPLANATION OF THE ERUPTION MODEL The dynamics of an erupting volcano is demonstrated in the following cross-section. Eruptions are fed from a magma column that exists directly above a magma chamber. The magma column contains two critical pressure surfaces that separate three magmatic regimes with different physical properties.

23
Nonexplosive eruption with effusive lava flows Explosive eruption with large plume of tephra Whether or not an eruption falls into one of these end-member types depends on a variety of factors, which are ultimately linked to the composition of the magma (molten rock) underlying the volcano. Magma viscosity, temperature, and the amount of dissolved gases in the magma control explosiveness.

24
Spreading Center Volcanics Subduction Zone Volcanics Intraplate Volcanics - Mantle Plumes Many scientists believe that mantle plumes may be derived from near the core-mantle boundary, as demonstrated in this computer simulation from the Minnesota supercomputing lab. Note the bulbous plume heads, the narrow plume tails, and the flattened plume heads as they impinge on the outer sphere representing the base of the lithosphere.

25
Image Mozaic of Mars -- The large fractured terrain in the center of the image is the Valles Marineris Canyon System, which is over 4000 kilometers long. The Tharsis Shield Volcanoes are shown on the upper left of the image. Olympus Mons lies out of view beyond the two Tharsis volcanoes shown here. The Tharsis volcanoes ries 10 to 18 km above the Tharsis Plateau. Courtesy of NASA/JPL.Valles Marineris Canyon System Tharsis Shield VolcanoesOlympus Mons Mantle plume uplift (no active horizontal tectonics) Thin crust + molten mantle Basalt
 Thin crust + molten mantle Basalt.")
Similar presentations


 eruptions Explosive (Subduction)>")

 Divergent Boundary (Ridge) 2)>")


