Download presentation
Presentation is loading. Please wait.

1
Geostationary Observations of Hot Spots in Hawaii Luke Flynn, Robert Wright, Andrew Harris Hawaii Institute of Geophysics and Planetology University of Hawaii at Manoa GOFC/GOLD Global Geostationary Fire Monitoring Applications Workshop Darmstadt, Germany March 24, 2004

2
Hawaii Hot Spot Detection Program Objective: To provide operational synergistic global coverage in near- real-time for hazard management applications. Available High-Temporal Monitoring Systems: –MODIS Terra and Aqua – Up to 4 times a day polar orbiting global coverage restricted to active fires (only hot spot data recorded). –GOES 9, 10, 12 – Geostationary coverage of most of Western Hemisphere plus sporadic coverage of Pacific Rim. Satellite and Field-Based Validation Data Sets: –High spatial resolution data from ASTER, Landsat 7, and EO-1 (Hyperion and ALI). –Field-based comparative data of radiative flux from Kilauea (on-line) and other volcanoes. Supported Projects –Mainly Volcano Hazard Monitoring –Pacific Disaster Center (PDC) effort to monitor fire hazards within Pacific Rim and west to include India and Australia.
. –GOES 9, 10, 12 – Geostationary coverage of most of Western Hemisphere plus sporadic coverage of Pacific Rim. Satellite and Field-Based Validation Data Sets: –High spatial resolution data from ASTER, Landsat 7, and EO-1 (Hyperion and ALI). –Field-based comparative data of radiative flux from Kilauea (on-line) and other volcanoes. Supported Projects –Mainly Volcano Hazard Monitoring –Pacific Disaster Center (PDC) effort to monitor fire hazards within Pacific Rim and west to include India and Australia..")
3
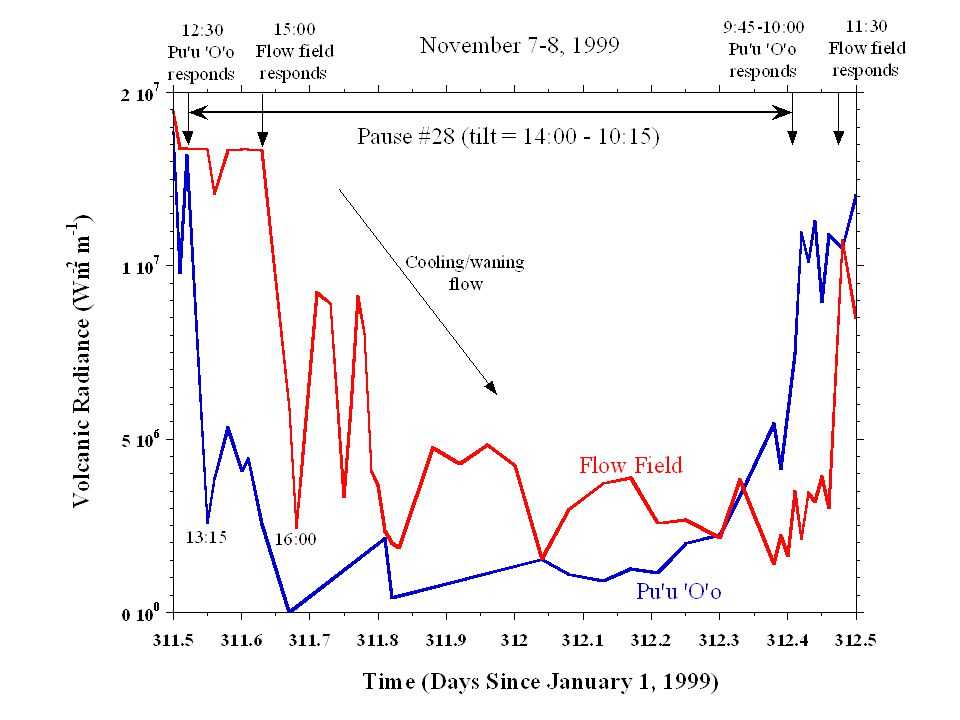
Current Hotspot Monitoring Sites GOES 8/10 Hotspot Images http://goes.higp.hawaii.edu/ MODIS Thermal Alerts http://modis.higp.hawaii.edu/ Pu'u 'O'o Vent Monitoring http://volcano2.pgd.hawaii.edu/puuoo Selected western-hemisphere sites updated every 10 to 30 minutes. Data are collected by geostationary GOES 8 and GOES 10 satellites in 15 minute intervals. Global maps of thermally significant events captured daily by MODIS 1 Hour, 4 Hour, Daily and Weekly plots of thermal activity from selected locations within Pu'u 'O'o Crater Hotspots, such as volcanic eruptions or fires, pose serious hazards to sensitive ecosystems, transportation and communication networks, and to populated regions. Orbiting Earth-observing satellites gather and relay valuable data on these hotspot hazards as they develop around the globe. Timely dissemination of these data to scientists and to local civil defense officials is crucial in efforts to understand and minimize losses from hazardous hotspot activity. HOTSPOTS ties together various sources of near-real-time data acquired by different Earth-observing satellites and processed by scientists at the Hawaii Institute of Geophysics and Planetology, University of Hawaii.

4
Geostationary Hot Spot Detection GOES 9, 10, and 12 provide near-real-time event detection (8 – 11 minute delay) of Western Hemisphere (every 15-30 minutes) and Pacific Rim (5-8 images per day). Data are available online for 15 day period after which they are stored to DVD. Online data browse tool helps image searches. DVD archive extends from 1998 to present. Huge data set that is unwieldy to respond to multiple large data queries. Automated email alert notification system extending to hazard mitigation officials now in 5 th year of operation.

5
GOES 8/10 Hot Spot Images With acknowledgments to the Naval Research Laboratory Satellite Applications Group headed by Jeff Hawkins (hawkins@nrlmry.navy.mil) for data processing and access, and the University of Hawaii’s Satellite Oceanography Laboratory Status: All sites operating normally.GOES Image Viewer Continental US GOES 10 Aleutians Upper Aleutians Big Island Hawai’i State of Hawai’i e158s09 Kavachi e169s18 Yasur/Ambrym New Zealand North Island GOES 8 Amazon Brazil Colima W. Mexico Cotopaxi Ecuador Galapagos E. Pacific Lascar N. Chile Santa Maria Guatemala Montserrat Lesser Antilles Nicaragua Central Am. Popocatepetl Central Mexico Villarrica Chile Costa Rica (& Panama) Senegal W. Africa Western US Eastern US Eastern US - Maine
 Senegal W. Africa Western US Eastern US Eastern US - Maine.")
6
Direct GOES reception every 15 mins. Automated pre-processing Automated product generation Email alert Observatories Reception - generation lag: 12 mins. Web-based hot spot maps & images Public/media Direct route Optional route Http://goes.higp.hawaii.edu/ Near-real-time hot spot data processing and dissemination

7
The GOES System RGB Image

8
Map with hot spot projection

9
Email Notice

10
Amazon Bigisland Colima Cotopax Galapagos Hawaii Lascar Montserrat Nicaragua NZL Popocatepetl Santamaria 2001:149 2001:150 2001:151 2001:152 2001:153 2001:154 2001:155 2001:156 2001:157 2001:158 2001:159 2001:160 atm b1 b2m4 hot key prob rgb Site NameYear:DayImage Type 44 Images Found 20010605.0215.g08.rgb.jpg 20010605.0245.g08.rgb.jpg 20010605.0315.g08.rgb.jpg Displayed Image 20010605.0215.g08.rgb.jpg View Image Prev ImageNext Image Reset Control Points Quit Image Viewer Show/Hide Overlays CoastsLat/Lon Geography Play as Movie Refresh (Sec)Duration Julian Day Continuous Forward Backward 0 0.25 1 2
Duration Julian Day Continuous Forward Backward")
11
http://goes.higp.hawaii.edu - Email Notices HVO (Hawai’i) CSIRO (Kavachi) Darwin Research Station (Galapagos) SERNAGEOMIN (Chile) Inst. Geofisico (Ecuador) CENAPRED (Popocatepetl) MVO (Montserrat) Colima Volcano Obsevatory (Mexico) Yasur, Ambrym, North Island (NZ) August 2000 INSIVUMEH (Guatemala) U. Blaise Pascal & INETER (Nicaragua)
 CENAPRED (Popocatepetl) MVO (Montserrat) Colima Volcano Obsevatory (Mexico) Yasur, Ambrym, North Island (NZ) August 2000 INSIVUMEH (Guatemala) U. Blaise Pascal & INETER (Nicaragua).")
12
GOES-9 coverage extends to Pacific Rim GOES – 9 coverage is sporadic but allows us to see fire activity in the Philippines, Japan, Indonesia, New Zealand, and Kamchatka.

13
October 7, 1999 Eruption of Guagua Pichincha

15
UH MODIS Thermal Alert System - 2004 Provides global observations for geostationary data validation a few times per day and extends to upper latitudes that geostationary systems do not cover. MODIS Alert acquires channels 21, 22, 31, and 32. Channels 21, 22, and 32 are used for the alert test. Latest online addition of software provides point and click zoom capability (0.5 deg x 0.5 deg). High resolution Shuttle radar DEM of globe provides great location accuracy for hot spots. Ability to run a variety of algorithms on completely online data set. Data transfers are very small making it an excellent option for field locations with poor Internet connectivity. Potential UH MODIS Thermal Alert Difficulties –Cannot distinguish between cloud-covered fire and no fire (MODIS Rapid Response can distinguish clouds). –Cannot map burn scars (MODIS Rapid Response).
. High resolution Shuttle radar DEM of globe provides great location accuracy for hot spots. Ability to run a variety of algorithms on completely online data set. Data transfers are very small making it an excellent option for field locations with poor Internet connectivity. Potential UH MODIS Thermal Alert Difficulties –Cannot distinguish between cloud-covered fire and no fire (MODIS Rapid Response can distinguish clouds). –Cannot map burn scars (MODIS Rapid Response)..")
16
22-32 Ocean ‘Cold’ clouds ‘Warm’ clouds ‘Cold’ land ‘Warm’ land Lava Thresholding lava pixels: Big Island example

17
22-32/22+32 Ocean ‘Cold’ clouds ‘Warm’ clouds ‘Cold’ land ‘Warm’ land Lava Thresholding hot-spots using (22-32)/(22+32)
/(22+32)")
18
Status of MODIS Thermal Alert Data Archive MODIS data were processed for short period in June, 2000 and also currently for September 15, 2000 – March, 2004. Processing continues to lag present day by less than 1 day. All alerts available on line for data queries. High spatial resolution radar DEM covers a large part of globe. Weekly summary of active volcanoes updated daily (~ 10- 15 active volcanoes/week). Developed PDC Algorithm - 10 largest hot spots tracked (added radiance from contiguous pixels) per day.
. Developed PDC Algorithm - 10 largest hot spots tracked (added radiance from contiguous pixels) per day..")
19
Comparative Sampling of MODIS Alerts Daily Sampling Monthly Sampling

20
MODIS Thermal Alert Zoom Capability MODIS alerted pixels projected onto radar DEM provide excellent accuracy for hazard applications and geostationary validation exercises.

21
Tracking hot spots with MODIS The eruption of Anatahan volcano in the Northern Mariana Islands illustrates the utility of the MODIS system for hot spot validation studies. Most hot spots are located within the eastern crater of Anatahan where the main eruption took place. Red dots mark the centers of alerted pixels, orange boxes the extent of 1 km pixels, and yellow circles the possible error where hot spots could have been located to affect the alerted pixel.

22
MODIS Thermal Alert Results Volcano Ambrym Arenal Bagana Balagan-Tas Bezymianny Big Ben Cleveland Erebus Erta Ale Etna Fuego Ibu Karangetang Karymsky Kilauea Krakatau Lascar Lopevi Mayon Merapi Michael Miyake-jima Activity Lava-lake Vent Lava dome ?? Lava dome Vent Lava-lake Vent/lava flow Vent Lava dome Lava flows Vent Lava dome Lava flows Lava dome ?? Vent Alerts 8 3 10 1 10 5 3 58 49 63 1 2 10 3 87 1 5 1 2 20 2 1 Volcano Montagu Nyamuragira Nyiragongo Pacaya P. Fournaise Popocatepetl Rabaul Santa Maria Semeru Shiveluch Montserrat Stromboli Tinakula Tofua Ulawun Villarrica Yasur Activity ?? Lava flows Vent Lava flows Lava dome Vent Lava dome Vent Lava dome Vent ?? Lava flows Lava-lake Vent Alerts 2 18 35 1 21 38 3 39 14 13 28 1 3 1 3 1 2

23
Hyperion for Fire Radiance Validation Studies Hyperion has 220 bands at 0.4 - 2.5 m with 30 m spatial resolution, but only a 7.5 km swath width. Part of a Hyperion image on left showing more extensive eruption. Saturation of detectors over hot channels cause a radiance echo in Hyperion data. We are working to reconstruct the original analog signal from the saturated pixels and the radiant echo.

24
Hyperion Spectra - July 22, 2001

25
Operational Conclusions Have to identify users and deliver product within their time frame. Have to deliver a product that is readily interpretable - not complicated. With the volume of geostationary data, deliver notice when search criteria are satisfied. Provide product support for users.

Similar presentations


 Pacific Disaster Center.>")


