Download presentation
Presentation is loading. Please wait.

1
Chapter 7 Nutrients and Energy

4
Energy Sources Organisms can be classified by trophic levels. –Autotrophs use inorganic sources of carbon and energy. Photosynthetic: Use CO 2 as carbon source, and sunlight as energy. Chemosynthetic: Use inorganic molecules (CO 2 ) as source of carbon and hydrogen sulfide (H 2 S) as energy. –Heterotrophs use organic molecules as sources of carbon and energy.
 as source of carbon and hydrogen sulfide (H 2 S) as energy. –Heterotrophs use organic molecules as sources of carbon and energy..")
7
Using Inorganic Molecules 1977 - Organisms found living on sea floor. –Near nutrients discharged from volcanic activity through oceanic rift. Chemosynthetic: Use inorganic molecules (CO 2 ) as source of carbon and hydrogen sulfide (H 2 S) as energy to synthesize organic matters Autotrophs depend on chemosynthetic bacteria. –Free-living forms. –Living within tissue of invertebrates.
 as source of carbon and hydrogen sulfide (H 2 S) as energy to synthesize organic matters Autotrophs depend on chemosynthetic bacteria. –Free-living forms. –Living within tissue of invertebrates..")
8
影片

9
Nitrogen uptake

11
Using Organic Molecules Three Feeding Methods of Heterotrophs: –Herbivores: Feed on plants. –Carnivores: Feed on animal flesh. –Detritivores: Feed on non-living organic matter.

12
Herbivores

13
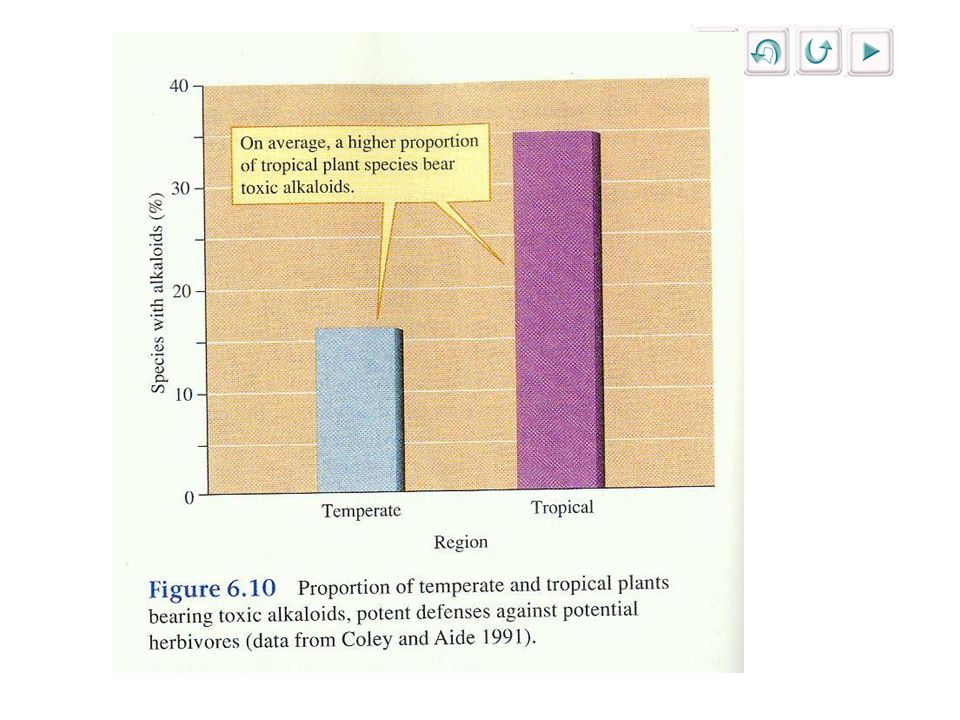
Substantial nutritional chemistry problems. Low nitrogen concentrations.

15
Herbivores Must overcome plant physical and chemical defenses. –Physical Cellulose; lignin; silica –Chemical Toxins Digestion Reducing Compounds

19
Detritivores: Consume food rich in carbon and energy, but poor in nitrogen.

21
Carnivores Consume nutritionally-rich prey. –Cannot choose prey at will. Prey Defenses: –Aposomatic Coloring - Warning colors. –Mullerian mimicry: Comimicry among several species of noxious organisms. –Batesian mimicry: Harmless species mimic noxious species.

22
A fly mimics a bee A wasp mimics a bee

23
Carnivores Predators are usually selection agents for refined prey defense. –Usually eliminate more conspicuous members of a population (less adaptive). –Must catch and subdue prey - size selection. Predator and prey species are engaged in a co- evolutionary race.
. –Must catch and subdue prey - size selection. Predator and prey species are engaged in a co- evolutionary race..")
25
The end

27
Optimal Foraging in Bluegill Sunfish

28
Energy Limitation Limits on potential rate of energy intake by animals have been demonstrated by studying relationship between feeding rate and food availability. Limits on potential rate of energy intake by plants have been demonstrated by studying response of photosynthetic rate to photon flux density.

29
Photon Flux and Photosynthetic Response Curves Rate of photosynthesis increases linearly with photon flux density at low light intensities, rises more slowly with intermediate light intensities, and tends to level off at high light intensities. –Response curves for different species generally level off at different maximum photosynthesis rates.

31
Food Density and Animal Functional Response Holling described (3) basic functional responses: –1. Feeding rate increases linearly as food density increases - levels off at maximum. Consumers require little or no search and handling time. –2. Feeding rate rises in proportion to food density. Feeding rate partially limited by search/handling time.

32
Food Density and Animal Functional Response 3. Feeding rate increases most rapidly at intermediate densities –(S-shaped).
..")
33
Optimal Foraging Theory Assures if energy supplies are limited, organisms cannot simultaneously maximize all life functions. –Must compromise between competing demands for resources. Principle of Allocation

34
Optimal Foraging Theory All other things being equal,more abundant prey yields larger energy return. Must consider energy expended during: Search for prey Handling time Tend to maximize rate of energy intake.

35
Optimal Foraging By Plants Limited supplies of energy for allocation to leaves, stems and roots. Bloom suggested plants adjust allocation in such a manner that all resources are equally limited. –Appear to allocate growth in a manner that increases rate of acquisition of resources in shortest supply.

36
Review Energy Sources Solar-Powered Biosphere Photosynthetic Pathways Using Organic Molecules Chemical Composition and Nutrient Requirements Using Inorganic Molecules Energy Limitation Food Density and Animal Functional Response Optimal Foraging Theory

45
Solar - Powered Biosphere Light propagates through space as a wave. –Photon: Particle of light bears energy. Infrared (IR) Long-wavelength, low energy. –Interacts with matter, increasing motion. Ultraviolet (UV) Short wavelength, high energy. –Can destroy biological machinery. –Photosynthetically Active Radiation (PAR) Between two extremes.
 Long-wavelength, low energy. –Interacts with matter, increasing motion. Ultraviolet (UV) Short wavelength, high energy. –Can destroy biological machinery. –Photosynthetically Active Radiation (PAR) Between two extremes..")
46
Photosynthetically Active Radiation

47
Solar - Powered Biosphere PAR –Quantified as photon flux density. Number of photons striking square meter surface each second. Chlorophyll absorbs light as photons. Landscapes, water, and organisms can all change the amount and quality of light reaching an area.

48
Photosynthetic Pathways C 3 Photosynthesis –Used by most plants and algae. –CO 2 + ribulose bisphosphate (5 carbon sugar) = phosphoglyceric acid (3 carbon acid) To fix carbon, plants must open stomata to let in CO 2. –Water gradient may allow water to escape.
 = phosphoglyceric acid (3 carbon acid) To fix carbon, plants must open stomata to let in CO 2. –Water gradient may allow water to escape..")
49
C 3 Photosynthesis

50
Photosynthetic Pathways C 4 Photosynthesis –Reduce internal CO 2 concentrations. Increases rate of CO 2 diffusion inward. Need fewer stomata open. –Conserving water –Acids produced during carbon fixation diffuse to specialized cells surrounding bundle sheath.

51
C 4 Photosynthesis

52
Photosynthetic Pathways CAM Photosynthesis –(Crassulacean Acid Metabolism) –Limited to succulent plants in arid and semi-arid environments. Carbon fixation takes place at night. –Reduced water loss. Low rates of photosynthesis. Extremely high rates of water use efficiency.

53
CAM Photosynthesis

54
Chemical Composition and Nutrient Requirements Five elements make up 93-97% of biomass of plants, animals, fungi and bacteria: –Carbon –Oxygen –Hydrogen –Nitrogen –Phosphorus

55
Essential Plant Nutrients Potassium Calcium Magnesium Sulfur Chlorine Iron Manganese Boron Zinc Copper Molybdenum

Similar presentations


 = phosphoglyceric acid (3 carbon.>")


