Download presentation
Presentation is loading. Please wait.

2
Meta-analysis of reef fish data in Hawaii to examine natural and anthropogenic processes Alan Friedlander 1, Mary Donovan 1, Kosta Stamoulis 1, Ivor Williams 2, 1 Fisheries Ecology Research Lab, Univ. Hawaii 2 CRED, PIFSC, NOAA

3
Outline & Products Data collection and breadth Length-weight relationships – Spatial and temporal comparison Bio-regionalization – Assemblage structure – Endemism Human Impacts – Gradients – Spatial analysis Modeling drivers – Comparison of methods – Modeling fish assemblages across biogeographic & anthropogenic gradients

4
Length-weight Parameters for Hawaiian Reef Fishes Published for the first time 112 species total 33 Hawaiian Endemics Subset Species used in temporal and regional comparisons Large differences when compared to known values from other regions

5
Fish Survey Datasets

6
Number of fish surveys by Island

7
Archipelago-level survey effort Williams et al. 2008 This Study 600 565 575 2340 266 571 32 133 908 60 644 239 535 1070 2508 10327 52 678

8
Biogregionalization – Assemblages vary between NWHI and MHI – Species composition varies along latitudinal gradient – Related to geographic extent of species distributions – Latitudinal correlations exist for a variety of species – Higher level of endemism in NWHI

9
BiomassAbundance ANOSIM R: 0.57, p < 0.01ANOSIM R: 0.47, p < 0.01 Nihoa Molokai Maro Niihau Laysan Kahoolawe Kauai Oahu Maui Lanai Hawaii Kure Lisianski Necker Midway P&H FFS Nihoa Molokai Maro Niihau Laysan Kahoolawe Kauai Oahu Maui Lanai Hawaii Kure Lisianski Necker Midway P&H FFS Multidimensional examination of fish species assemblages Stress = 0.09 Stress = 0.013 Assemblages distinct between MHI & NWHI Higher concordance using biomass

10
EOO = Extent of Occurrence Measuring species’ range size EOO = Extent of Occurrence The area encompassed by the minimum convex polygon of occurrence

11
EOO (km 2 ) Prop of Density Gradient of range size with Latitude
 Prop of Density Gradient of range size with Latitude")
12
Zoogeography with Latitude

13
Endemic species 25% species endemic to Hawaii Numerical endemism is 50% in NWHI compared to 20% in MHI Higher endemism at the N end of chain

14
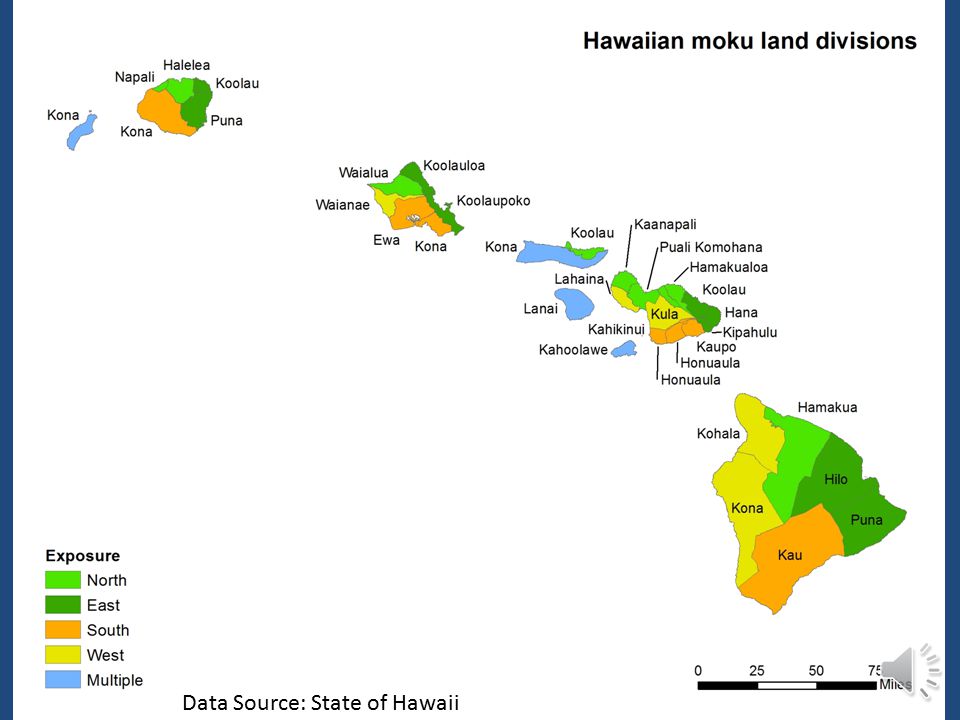
Human Impacts – Gradient of fish biomass within the MHI – Large difference in total biomass comparing NWHI and MHI – Fish assemblages have high concordance with traditional Hawaiian management systems – Comparison of MPAs across MHI

16
Data Source: State of Hawaii

17
Boosted Regression Tree Analysis of Fish Biomass with large-scale Habitat Variables Relative % variance explained

18
Fish Biomass Gradient by Moku and Island

19
Fish Biomass and Human Population by Moku

20
Pali Komohana (Maui) Kona (O‘ahu) Kaho‘olawe Ko‘olau (Moloka‘i) Napali (Kaua‘i)
 Kona (O‘ahu) Kaho‘olawe Ko‘olau (Moloka‘i) Napali (Kaua‘i)")
21
Fish biomass by Marine Protected area

22
Comparison of fish biomass by protected status & island

23
Mahalo mdono@hawaii.edu

Similar presentations

 Hawaii is the bigest island and is home to 11 of the worlds 13 climactic zones Visit black sand beaches, play in the snow on Mauna.>")


 J.>")


>")

 Hawaii Institute of Marine Biology School of Ocean, Earth Science and Technology,>")