Download presentation
Presentation is loading. Please wait.

1
Water Unit

2
Aquifers Porous, water bearing layers of sand, gravel and/or rock below earth’s surface Reservoirs for groundwater Latin:Aqua = Water Ferre = To bring

3
2 Types of Aquifers CONFINED Water is in porous, fractured rock Can be artesian (under pressure) Water is sandwiched between two impermeable layers UNCONFINED Water is in sandy/gravelly soil Impermeable layer (ex: solid rock) is beneath the water, but not above Most common ty pe
 Water is sandwiched between two impermeable layers UNCONFINED Water is in sandy/gravelly soil Impermeable layer (ex: solid rock) is beneath the water, but not above Most common ty pe")
5
2 factors determine productivity: 1.Porosity – The amount of water it can hold 2. Permeability – The ability of water to flow through it

6
Ogallala! Largest aquifer on earth Beneath 8 states, extending from N. Dakota to Texas Once held more water than all of the freshwater lakes, rivers and streams on earth combined Excessive pumping has left no water in some peripheral places

7
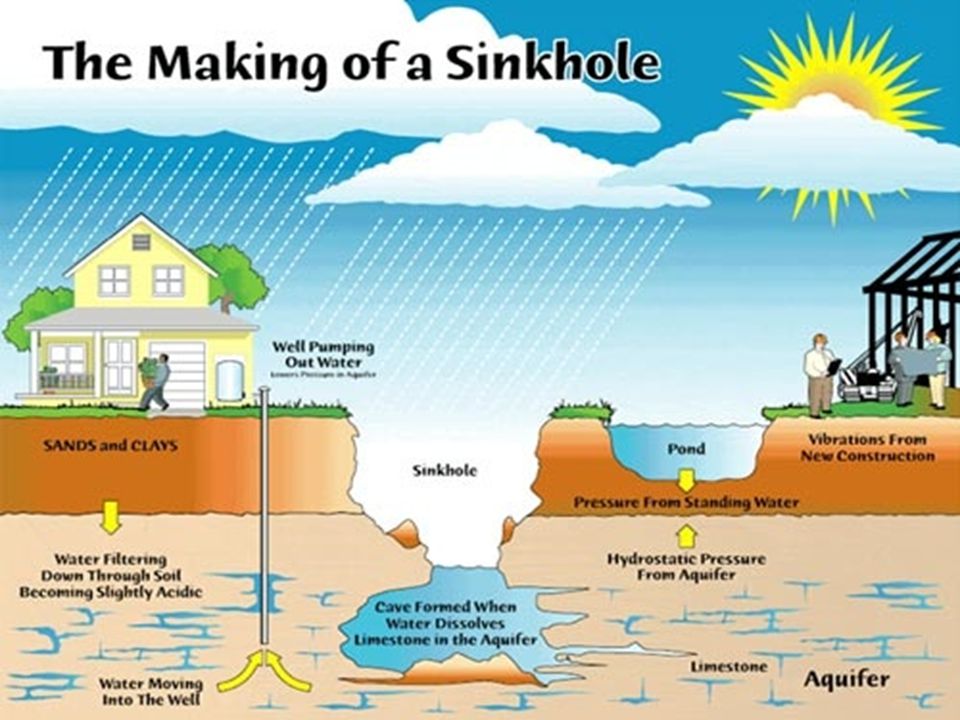
Groundwater Depletion Aquifer recharge can take thousands of years Depletion Examples: Cone of Depression Saltwater Intrusion Subsidence / Sinkholes

8
Cone of Depression and Saltwater Intrusion

9
Subsidence Sinkholes Surface craters caused by collapse of an underground channel

12
Rivers Riparian Zone – The river and its stream banks

13
Watershed All the land drained by a river The area retains rainwater and lessens downstream flooding when vegetated Case Study: Unregulated timber cutting along Yangtze caused 30,000 deaths due to flooding

14
How to Improve Watershed Management: Less development along floodplains Retain “crop residue” on fields Minimize plowing and forest cutting on slopes “Buffer zones” of vegetation near waterways

15
Earth’s Largest Rivers Discharge rate – the amount of water that passes a fixed point over a given amount of time. Amazon – Brazil, Peru (175,000 m 3 /sec) Orinoco – Venezuela (45,300 m 3 /sec) Yangtze – Tibet, China (28,000 m 3 /sec) Mississippi – US (18,400 m 3 /sec)
 Orinoco – Venezuela (45,300 m 3 /sec) Yangtze – Tibet, China (28,000 m 3 /sec) Mississippi – US (18,400 m 3 /sec).")
16
Case Study: 3 Gorges Dam Largest dam in the world 1.2 million people relocated Fragile ecosystems and rare species indigenous to that area were flooded Reservoir flooded thousands of villages Triggering landslides Dam is constructed above a fault line

17
3 Gorges Dam

18
Lake Stratification (draw it.)
")
19
Point Source Pollution: When a pollutant is identified as coming from a specific source Plume – contaminants that seep from a concentrated mass. Ex’s: smoke from a chimney, image to the right

20
Non-Point Source Pollution Pollution that does not have a specific point of origin Ex: parking lots, residential lawns

21
POLLUTION Point-Source Examples: – Leaky landfill – Leaky septic system – Thermal pollution Non-Point Source Examples: – Runoff/erosion from farms – Parking lots – Feedlots – Atmospheric deposition

22
Atmospheric Deposition Contaminants get into air and are redeposited via rain Normal rain: pH ~ 5.6 Acid Rain: pH <5 Acid Precipitation leaches out naturally occurring Al, Hg Has left 600,000 kg of Atrazine (an herbicide) in the great lakes
 in the great lakes")
23
Pollution Consequences pH – acidity can be caused by industry waste, acid rain, mine tailings (esp. coal due to high S content) N,P,K – concentrations elevate upon influx of fertilizer, manure… Oxygen level – measured in ppm. Air gets into water via Ps (photosynthesis) and wave action. – O 2 and BOD have an inverse relationship
 N,P,K – concentrations elevate upon influx of fertilizer, manure… Oxygen level – measured in ppm. Air gets into water via Ps (photosynthesis) and wave action. – O 2 and BOD have an inverse relationship.")
24
(Polltn Consq. cont.) Thermal Pollution: Heat in water Hot water can hold less O 2 than cold water Sources: Power plants Industrial coolant Your gutters
 Thermal Pollution: Heat in water Hot water can hold less O 2 than cold water Sources: Power plants Industrial coolant Your gutters.")
25
(Polltn Consq.) Turbidity (a.k.a. cloudiness) Increases due to presence of sediment and runoff, which use up O 2 during decomposition Turbidity itself isn’t necessarily bad. However, it is often present in connection with pathogenic organisms or an excess of decomposing material. Particles can bond with toxic substances, transporting them and complicating removal
 Increases due to presence of sediment and runoff, which use up O 2 during decomposition Turbidity itself isn’t necessarily bad. However, it is often present in connection with pathogenic organisms or an excess of decomposing material. Particles can bond with toxic substances, transporting them and complicating removal.")
26
(Polltn Consq) Infectious Agents Viruses, Bacteria Source: us and the animals Ex: Coliform – Multiple types of coliform, all originate in intestines – Fecal Coliform – not necessarily pathogenic, but in high levels is associated with other pathogenic bacteria
 Infectious Agents Viruses, Bacteria Source: us and the animals Ex: Coliform – Multiple types of coliform, all originate in intestines – Fecal Coliform – not necessarily pathogenic, but in high levels is associated with other pathogenic bacteria")
27
Oxygen Demanding Waste Oxygen Sag Curve Organic waste uses up O 2 in water during decomposition 6-10ppm is considered healthy O 2 level Example organic wastes: – Leaves – Food from processing plants – Sewage

28
Draw Oxygen Sag Curve

29
Cultural Eutrophication Dead Zone Increased nutrition that enters a water body, ultimately resulting in a lowered oxygen level. 1. Increased nutrients enter a water body. 2. Causes an unsustainable algal bloom and overgrowth of phytoplankton 3. Algae and phytoplankton use up available oxygen when they decompose. 4. Fish suffocate.

30
Eutrophication cont. Can be due to: – Increased nutrients, esp. N and P Ex: agricultural manure, fertilizer – Elevated temperature Ex: Thermal pollution/increased sunlight (which triggers unsustainable algae growth, begins cycle…)
.")
32
Gulf of Mexico “Dead Zone”

33
Eutrophication Natural Cultural

34
Blue Baby Syndrome Caused by excess nitrates in water Nitrates bind to red blood cells…especially harmful to infants Causes baby to appear bluish due to lack of O 2 reaching cells (suffocation) Can cause death Many of Iowa’s “cornbelt” wells are nitrate contaminated
 Can cause death Many of Iowa’s cornbelt wells are nitrate contaminated")
35
Toxic Tide/Red Tide (polltn cont.) Caused by dinoflaggelates – unicellular, photosynthetic microorganisms Population bulge can be due to natural causes or due to excess nutrients in waterbody Ex: pfiesteria piscicida – poisonous to eat or breathe (causes memory loss, confusion, acute skin burning, lesions…)
 Caused by dinoflaggelates – unicellular, photosynthetic microorganisms Population bulge can be due to natural causes or due to excess nutrients in waterbody Ex: pfiesteria piscicida – poisonous to eat or breathe (causes memory loss, confusion, acute skin burning, lesions…)")
36
Radioactive Materials (polltn. Cont.) Sources: mining, ore processing, power plants, or can be naturally occurring Ex: Cs, Th, U
 Sources: mining, ore processing, power plants, or can be naturally occurring Ex: Cs, Th, U.")
37
Inorganic Chemicals (polltn. cont.) Ex: Hg, Sn, Pb, Cd, Ni, As, Se Are often bioaccumulators (increase in concentration as you move up the food chain) ppm levels can be fatal to humans Sources: household cleaners, industrial effluent Ex: panning for gold in Amazon River. (use Hg to bind to Au, then burn off Hg using torch)
 Ex: Hg, Sn, Pb, Cd, Ni, As, Se Are often bioaccumulators (increase in concentration as you move up the food chain) ppm levels can be fatal to humans Sources: household cleaners, industrial effluent Ex: panning for gold in Amazon River. (use Hg to bind to Au, then burn off Hg using torch).")
38
Organic Chemicals (polltn. cont.) Ex: Pesticides, pharmaceuticals, plastics, pigments…(organic = Carbon) – Estrogen in birth control pills is affecting river life Causes genetic defects (see p.455, photos 20.8, 20.9) 2 main sources: 1. Improper disposal of household/industrial waste 2. Runoff from fields, farms, etc.
 Ex: Pesticides, pharmaceuticals, plastics, pigments…(organic = Carbon) – Estrogen in birth control pills is affecting river life Causes genetic defects (see p.455, photos 20.8, 20.9) 2 main sources: 1. Improper disposal of household/industrial waste 2. Runoff from fields, farms, etc..")
39
Pollution Solutions Use less fertilizer (use compost, leave clippings…) Establish buffer strips Keep livestock and feedlots away from streams Perform crop rotation –Corn soybeans Use contour plowing Irrigate at night Use drip irrigation
 Establish buffer strips Keep livestock and feedlots away from streams Perform crop rotation –Corn soybeans Use contour plowing Irrigate at night Use drip irrigation")
40
Water Treatment General Processes: – Flocculation – use of a substance (ex: alum) that causes precipitates to coagulate and settle – Aeration – exposing the water to air – Percolation – the process of water settling through soil/gravel Removes the large stuff and some bacteria – Disinfection – killing microorganisms prior to discharge Done using UV light, O3 or Cl
 that causes precipitates to coagulate and settle – Aeration – exposing the water to air – Percolation – the process of water settling through soil/gravel Removes the large stuff and some bacteria – Disinfection – killing microorganisms prior to discharge Done using UV light, O3 or Cl")
42
Rural Sewage Treatment - Septic tank and field

43
Municipal Treatment (1 o, 2 o, 3 o ) Primary: – Uses grates/screens and a grit chamber/settling tank to remove “solids”. – “Solid” stuff is termed “primary sludge”. Mmmm. Secondary: – Aerates the sewage – Uses aerobic bacteria and protozoa to digest organic matter. Tertiary: – Uses binding agents, artificial wetlands, lagoons to remove remaining impurities, esp. N and P

44
Municipal Sewage Treatment– 1 o, 2 o, 3 o

45
Good News! In spite of our growing population, we use 10% less water than we did in 1980 Ex: Water saving toilets Low-flow shower heads Gray water, aka “sullage” – Wastewater generated from sink, washing machine, etc. that can be re-used.

46
Water Use and Waste #1 domestic use of water: – Toilet. (40%) #2 domestic use of water: – Shower/Bath (37%) Nearly ½ of industrial water is used for cooling – Wasted heat! – Thermal pollution!
 #2 domestic use of water: – Shower/Bath (37%) Nearly ½ of industrial water is used for cooling – Wasted heat. – Thermal pollution!.")
47
Water Use and Waste (cont.) #1 use of water globally: – Agriculture CA Central Valley: – Subsidies covered cost for distribution – Farmers pay up to 1/10 of the actual cost to supply the water – Incentive to conserve….?
 #1 use of water globally: – Agriculture CA Central Valley: – Subsidies covered cost for distribution – Farmers pay up to 1/10 of the actual cost to supply the water – Incentive to conserve….")
48
Want More Water? Cloud Seeding. Use of dry ice, Potassium Iodide, silver iodide, or hygroscopic salts to get clouds to release rain Issues: – Loss of rain elsewhere – Contamination of water – Ecosystem disruption Chemical is injected into cloud, forcing ice crystals to form, grow and fall

49
Want More Water? Desalinate. Converts ocean or brackish water into freshwater by removing salts Methods: –D–Distillation –R–Reverse osmosis (semi-permeable membrane) 3-4x as expensive as other freshwater Energy intensive Saudi Arabia, Kuwait and United Arab Emirates account for 85% of all desalination plants
 3-4x as expensive as other freshwater Energy intensive Saudi Arabia, Kuwait and United Arab Emirates account for 85% of all desalination plants.")
50
Glen Canyon Dam

51
Dams…Reservoirs…Channels Reservoir – a man-made basin for storage and controlled release of water Disrupts terrestrial ecosystems Encourages agricultural development in areas never meant to grow crops Massive water loss via evaporation and seepage Evaporation and agricultural runoff change the salinity of the water

52
Case Study: Colorado River Diversion of water from CO river has caused fighting between CA, UT, NV, AZ, NM and Mexico. Boulder dam and Glen Canyon Dam – Block fish passage/spawning – Trap nutrient-rich silt – Alter water temperatures Farm irrigation has caused salts from naturally alkaline soils to leach into river Millions of acres of farmland are “salt-poisoned” due to irrigation using increasingly salty water

53
What’s left for Mexico: CO River delta in Mexico (once lush, agriculturally productive) no longer receives the natural flow of silt and nutrient-rich water The salinity of the CO River was so high during the 1960s that Mexico !protestar! – U.S. agreed to build a desalination plant to restore the salinity of the CO to useable levels Case Study: Colorado River

54
Case Study: Aswan Dam, Nile R., Egypt Previously, the Nile River annually overflowed its banks. Effects: – Deposition of 4 M. tons of nutrient-rich silt on the valley floor – Made Egypt's otherwise dry land productive and fertile But there were some years when the river did not rise at all, causing widespread drought and famine. Aswan Dam created Lake Nasser.

55
Aswan Dam Benefits: Captures floodwater during rainy seasons, releases it during times of drought. Generates enormous amounts of electric power – More than 10 billion kilowatt-hours/year

56
Aswan Dam Disadvantages: – Nile River Delta region is no longer as fertile/productive as it was: Increased use of artificial fertilizers eutrophication… – Tremendous social impacts Relocation of 1 M. Egyptian peasants to less fertile government lands Loss to historians/archaeologists: Nubian civilization is one of the world’s oldest. The monuments/historical sites were flooded by Lake Nasser.

Similar presentations


>")