Download presentation
Presentation is loading. Please wait.

1
CHAT Asthma Collaborative Safety and Quality Collaborative

2
Objectives: To describe fundamental tenets of quality improvement To demonstrate ways to demonstrate quality improvement data To describe evidence based approaches to the diagnosis and management of pediatric asthma To discuss the CHAT safety and quality collaborative purpose, design, and implementation in the ED and Inpatient unit CHAT Safety and Quality Collaborative

3
Introduction: Partnership of 8 children’s hospitals in Texas Goals of the collaborative: To improve the quality and safety of care in CHAT hospitals To evaluate and establish the process for the development and adoption of evidence-based pathways To improve the care for ED and inpatient pediatric asthma To demonstrate improved outcomes of care with decrease cost of care delivery CHAT Safety and Quality Collaborative

4
Rationale: Standardization of practice within an institution will improve efficiency and effectiveness of care Standardization of practice throughout the CHAT hospitals will allow for aggregate learning, economies of scale in data management, and acceleration of discovery for best practices Rapid cycle improvement will occur in multiple cycles CHAT Safety and Quality Collaborative

5
Conducting Quality Improvement: A Primer CHAT Safety and Quality Collaborative

6
To define evidence based practice and guidelines for care To define quality To review the model for improvement To demonstrate an asthma QI project Objectives

7
Evidence based practice is not an intermittent choice EBP is about how we make decisions Not all decisions can be supported with good evidence But all should be supported with the best evidence Care delivered must be “transparent” A philosophy

8
What are the possible causes for these results?

9
AAP action plans: >200 asthma action plans at one institution alone Therapies differed Beta agonist weaning Oxygen weaning (5 min to 24 hours) Education Social work Chronic care management Variations in practice
 Education Social work Chronic care management Variations in practice")
10
Wide variations in practice are often not related to differences among patients Minimizing variations in practice can improve quality of health care delivery Variation in clinical practice Variation in beliefs Variation in interpretation of evidence Variation in response when evidence is lacking The purpose of EBGs: minimizing variation

11
Integrate best evidence for recommendations Help translate what we know into usable knowledge Are tailored to values and preferences Provide transparency where evidence lacks and default to consensus is necessary Limitations: No protocol fits every patient and No protocol (perfectly) fits any patient Target the applicability to 80% EBP Guidelines
 fits any patient Target the applicability to 80% EBP Guidelines")
12
Quality? Quality?

13
The degree to which health services for individuals and populations increase the likelihood of desired health outcomes and are consistent with current professional knowledge KN Lohr, N Engl J Med, 1990 Defining Quality

14
Focus on the tail Brent James, MD. ATP course.

15
1.Reduce variation 2.Shift toward desired outcome

16
What are we trying to accomplish? How will we know that a change is an improvement? What change can we make that will result in improvement? Model for Improvement ActPlan StudyDo Adapted from: The Improvement Guide: A Practical Approach to Enhancing Organizational Performance, 2 nd Ed. Gerald J. Langley, Ronald D. Moen, Kevin M. Nolan, Thomas W. Nolan, Clifford L. Norman, and Lloyd P. Provost Jossey-Bass 2009

17
What are we trying to accomplish? How will we know that a change is an improvement? What change can we make that will result in improvement? Model for Improvement ActPlan StudyDo Aim statements (SMART goals/aims) S pecific M easurable A ttainable R elevant T ime bound
 S pecific M easurable A ttainable R elevant T ime bound.")
18
What are we trying to accomplish? How will we know that a change is an improvement? What change can we make that will result in improvement? Model for Improvement ActPlan StudyDo “ In God we trust. All others bring data.” W. E. Deming

19
Outcome Measures Voice of the patient. Process Measures Voice of the workings of the system. Are the parts/steps in the system performing as planned? Balancing Measures What happened to the system as we improved the outcome and process measures (e.g. unanticipated consequences, other factors influencing outcome)? Types of Measures
. Types of Measures.")
20
What are we trying to accomplish? How will we know that a change is an improvement? What change can we make that will result in improvement? Model for Improvement ActPlan StudyDo “All improvement will require change, but not all change will result in improvement!” What can we do to make an improvement?

21
Plan: Set goals, predict, plan data collection Do: Test the plan, document problems, reassess and revise Study: Complete data analysis, review lessons, decide action Act: Implement, evaluate, decide next cycle Adapted from Langley G, Nolan K, et al. The Improvement Guide: A practical approach to enhancing organizational performance. San Francisco Jossey Bass Publishers 1996 The PDSA Quality Improvement Cycle

22
Ideas Adapted from: The Improvement Guide: A Practical Approach to Enhancing Organizational Performance, 2nd Ed. Gerald J. Langley, Ronald D. Moen, Kevin M. Nolan, Thomas W. Nolan, Clifford L. Norman, and Lloyd P. Provost; Jossey-Bass 2009 Act Plan Study Do Act Plan Study Do Act Plan Study Do Multiple PDSA cycles will result in the intended process improvement

23
Plan : Defining the problem Long mean length of stay for children with asthma Lack of standardization for care regimens Oxygen therapy Beta agonist therapy Search the evidence and identifying a strategy: PIJournalOutcome measures WazekaPediatr Pulmonol, 2001Hospital costs, length of stay KellyAnn Allergy Asthma Immunol, 2000 LOS, teaching, chronic medication plan Systems-based practice case: length of stay

24
Asthma protocols and printed orders Beta agonist weaning Oxygen weaning Education Social work Chronic care management Systems-based practice case: Do

25
Outcomes LOS Home QOL Displacement of resources: school days/work days missed 188 pediatric encounters 143 controls 45 interventions Systems-based practice case: Study

26
Mean length of stay for all: 2.35 (SD 1.63) Intervention 1.71 vs. 2.55 Difference in mean 0.84, 95%CI for difference 0.30-1.38, p=0.002). No differences in missed days of work/daycare/school
. No differences in missed days of work/daycare/school.")
27
Decision support tools Evidence based guidelines Emergency Center order sets Inpatient order sets Special care units order sets Community/PCP order sets Hospital based action plan Systems-based practice: Act

29
Begin the discharge process early Use Evidence Based Practice guidelines Use standardized action plans Systems-based practice: Subsequent cycles

30
Inpatient length of stay

31
Calculating cost savings Use # of Admits for Asthma (2008 = 650) Calculate days saved per year based upon ALOS decrease from 2.8 to 2.0 days 2008 = 520 bed days Building capacity Use last 6 month 2008 data to determine “variable direct cost” per day ($1002) Calculate savings in 2008 - $521,040 Assumption: filling beds in early days with patients with higher margin per case First day margins are better than 3 rd day margins Cost savings
 Calculate days saved per year based upon ALOS decrease from 2.8 to 2.0 days 2008 = 520 bed days Building capacity Use last 6 month 2008 data to determine variable direct cost per day ($1002) Calculate savings in $521,040 Assumption: filling beds in early days with patients with higher margin per case First day margins are better than 3 rd day margins Cost savings")
32
Data primer/ Introduction to data analyses tools CHAT Safety and Quality Collaborative

33
1. Define data 2. Explain some barriers to successfully using data 3. Explain the purpose and use of select quality data tools Objectives

34
Data is: Factual information used as a basis for reasoning, discussion, or calculation Examples: Medications Given (Dosages, Routes, etc.) Vital Signs / Symptoms Patient Characteristics (Age, Sex, Race, etc.) Costs Therapies Staff Turnover, Working Hours, Ratios Times (Admission, Discharge, etc.) Anything we can document to measure performance What is Data?
 Vital Signs / Symptoms Patient Characteristics (Age, Sex, Race, etc.) Costs Therapies Staff Turnover, Working Hours, Ratios Times (Admission, Discharge, etc.) Anything we can document to measure performance What is Data")
35
Dennis O’Leary Former President, JCAHO

36
Describe and improve processes Evaluate process or output variation Assist with decision-making Analyze data in a variety of ways Display information Purpose of QI Tools

37
Where am I? Where do I want to be? How do I get there? Am I still on the right path? How well did I do? QI Tools Help Answer 5 Questions

38
A bar graph that shows the distribution of CONTINUOUS data A snapshot of data taken from a process Summarize large data sets graphically Histograms

39
Histograms are a snapshot in time and show “distribution” They do NOT show trends over time Histogram Analysis

40
Bar chart arranged in descending order of height from left to right Bars on left relatively more important than those on right Separates the "vital few" from the "useful many" (Pareto Principle) 80/20 Rule - 80% of the gain from 20% of the categories What is a Pareto Chart?
 80/20 Rule - 80% of the gain from 20% of the categories What is a Pareto Chart")
41
Example - Pareto Chart

42
Breaks big problems into smaller pieces Displays causes or problems in priority order Identifies most significant factors Shows where to focus efforts Allows better use of limited resources Why use a Pareto Chart?

43
over time A running record of process behavior over time Requires no statistical calculations Shows process behavior at a glance some Can detect some special causes Time sequence is plotted on horizontal axis Measure of interest is always plotted on the vertical axis mean Center Line is the mean score What is a Run Chart?

44
Example Run Chart

45
After making a Run Chart or a Control chart, what’s next? The type of variation determines your approach: SPECIAL CAUSE VARIATION? If negative, eliminate it If positive, emulate it COMMON CAUSE VARIATION? COMMON CAUSE VARIATION? Communicate that this is normal variation Don’t “tamper” with individual data points! Improvement Strategies

46
A statistical tool used to distinguish between process variation resulting from common causes and variation resulting from special causes What is a Control Chart?

47
Example Control Chart

48
Monitor process variation over time Differentiate between special cause and common cause variation Assess effectiveness of changes Communicate process performance Why use Control Charts?

49
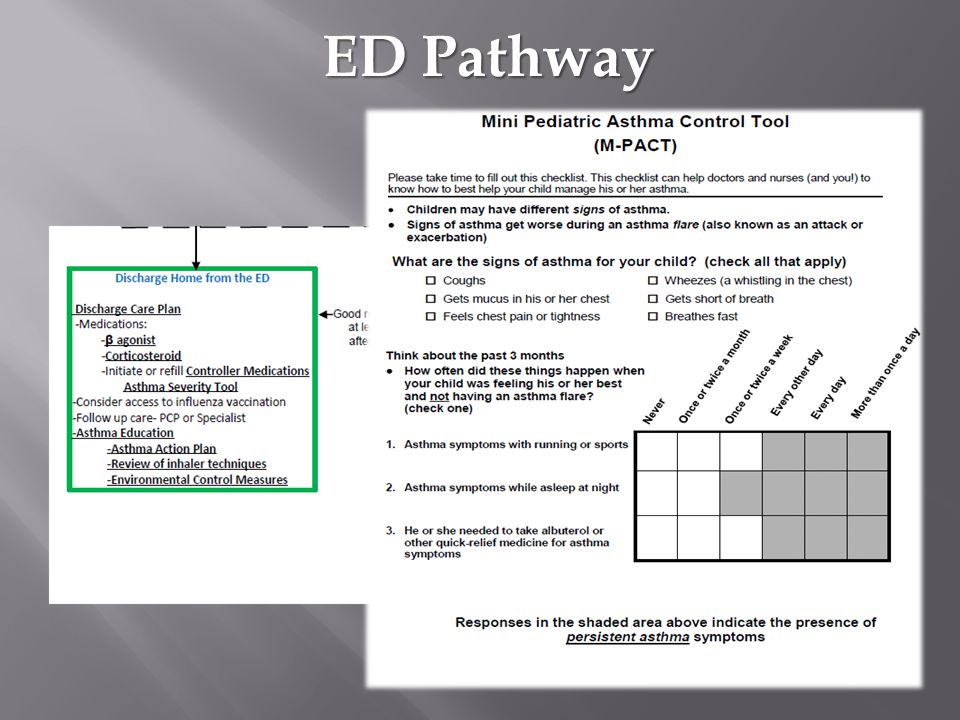
Reflects continuum of care from initial ED evaluation through discharge from inpatient unit ED pathway is based on first 3 hours of management and escalation/ de-escalation of therapy Inpatient pathway is focused on weaning process and discharge management Hyperlinks will address evidence, best practice, dosages, references Asthma EB Pathway

52
In children and adolescents with acute asthma exacerbation, no significant difference exists for important clinical responses such as time to recovery of asthma symptoms, repeat visits, or hospital admissions when medications are delivered via HFA with Valved Holding Chamber (VHC) or nebulizer. HFA with VHC is preferred. Continuous Albuterol is as effective as intermittent but should be reserved for children requiring administration more than every 1 hour and for children with life threatening asthma. ED Pathway

53
Hyperlinks

54
Strong recommendation with high quality evidence for the use of ipratropium bromide with beta agonist for up to three doses as adjunct therapy in children with moderate – severe asthma exacerbations ED Pathway

55
Strong recommendation with moderate quality evidence for the use of IV magnesium sulfate as adjunct therapy when there is inadequate response to conventional therapy after the first hour in children with severe asthma exacerbations. Weak recommendation with low-quality evidence to use IV terbutaline in a monitored care setting for the treatment of children with severe asthma exacerbations. Strong recommendation with low quality evidence for the use of non- invasive positive pressure ventilation prior to intubation in children with severe asthma exacerbations. ED Pathway

57
Inpatient Pathway

61
Key Elements of Evidence Based Pathway Recommendations Recommendation: Strong recommendation with good quality evidence that corticosteroids speed the resolution of airflow obstruction, reduce the rate of relapse, and may reduce hospitalizations, especially if administered within one hour of presentation to the ED. Oral prednisone has effects equivalent to those of intravenous methylprednisolone Dexamethasone is as effective as prednisone CHAT Safety and Quality Collaborative

62
Key Elements of Evidence Based Pathway Recommendations Cont. Evidence For Recommendation: Strong recommendation with high quality evidence for the use of ipratropium bromide with beta agonist for three doses as adjunct therapy in children with moderate – severe asthma exacerbations. Recommendation: Strong recommendation with moderate quality evidence for the use of IV magnesium sulfate as adjunct therapy when there is inadequate response to conventional therapy within the first hour in children with moderate to severe asthma exacerbations. Recommendation: Strong recommendation with low quality evidence for the use of non- invasive positive pressure ventilation prior to intubation in children with severe asthma exacerbations. CHAT Safety and Quality Collaborative

63
Key Elements of Evidence Based Pathway Recommendations Cont. Evidence Against Evidence Against: Routine use of Spirometry or Peak Flow, ABG/VBG, CXR to determine level of severity. Not Recommended: Low quality evidence to use Heliox in the treatment of children with asthma exacerbations. Not Recommended : Low-quality evidence to use subcutaneous terbutaline or epinephrine with severe asthma exacerbations. Evidence Inconclusive Level of oxygen saturation to start or wean supplementation β agonist weaning regiment Discharge criteria Use of asthma score Initiating controllers in ED/inpatient CHAT Safety and Quality Collaborative

64
CHAT Asthma Best Practices Matrix

65
CHAT Asthma Best Practices Matrix Cont.

68
Should you have any questions, please refer to (please insert: Name/ email/ phone number of the specific person (s) at each institution), your assigned resource / educator CHAT Safety and Quality Collaborative
 at each institution), your assigned resource / educator CHAT Safety and Quality Collaborative")
69
Before and after this training, you will be asked to complete a brief assessment to determine your acquisition of knowledge CHAT Safety and Quality Collaborative

70
Questions CHAT Safety and Quality Collaborative

Similar presentations