Download presentation
Presentation is loading. Please wait.

1
QI Presentation: Skills and Examples
Dr David Gozzard Senior Fellow, Institute for Healthcare Improvement, Boston US

2
Objectives of the Session
Understanding of relationship between structure and process Introduction to process mapping Driver diagram development PDSA worked examples

3
System Design Every system is perfectly designed to achieve exactly the results it gets

4
The Healthcare System 133 People to take care The Patient
of the patient The Patient

5
STRUCTURE + PROCESS = OUTCOME

6
PROCESS MAPPING

7
Why Map Processes?

8
Dealing with a non-functioning lamp
A Simple Flowchart Dealing with a non-functioning lamp

9
Another Simple Flowchart
Waking up in the morning

10
Process Maps

12
A New Tool – Driver Diagrams
A tool to help us understand the messiness of life!

13
What changes can we make?
Primary Drivers System components which will contribute to moving the primary outcome Secondary Drivers Elements of the associated Primary Driver. They can be used to create projects or a change package that will affect the Primary Driver.

14
Stroke Driver Diagram Improve the outcome for people following stroke
First hours bundle Start aspirin Confirmation of diagnosis Rapid recognition tool e.g. ROSIER First day bundle Swallow screen Admission to co-located beds CT scan First 3 days bundle Physiotherapy assessment Nutritional assessment Manual handling assessment 36h continuous monitoring First 7 days bundle Information sharing with patients/carers MDT goal setting meeting OT assessment commenced Reduce the number of episodes of avoidable harm Interventions identified by the Global Trigger Tool analysis

15
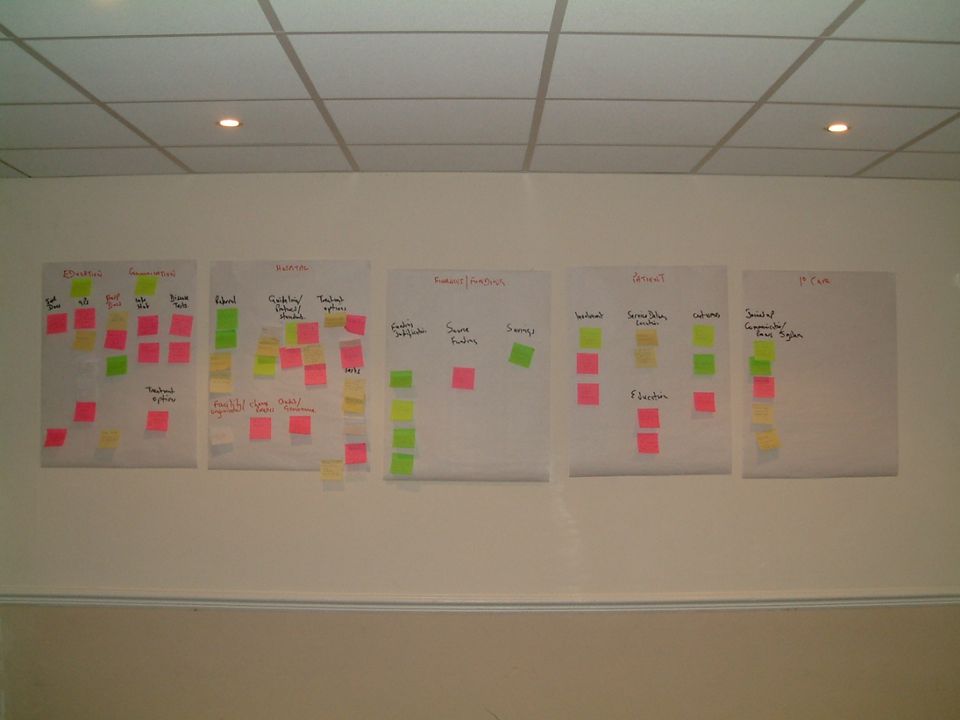
Driver Diagram Exercise
Establish stakeholder group Objectives Discussion regarding concerns (group) Flipchart exercise (smaller groups) Sticky notes exercise (individual) Coffee!! Whilst this is taking place the notes are “themed” Stakeholders view themes (primary drivers) Group exercise to format driver diagram
 Flipchart exercise (smaller groups) Sticky notes exercise (individual) Coffee!! Whilst this is taking place the notes are themed Stakeholders view themes (primary drivers) Group exercise to format driver diagram.")
19
Projects Anaemia Management Driver Diagram Better anaemia management
Education Training packages Communication Disseminating pathway guidelines Core Processes Hospital Treatment options Guidelines/Protocols Referral pathway Finances Business cases Commissioning Patient Satisfaction/outcome Service design Involvement Primary care Responsibilities Engagement Anaemia Management Driver Diagram Projects

20
How Will We Know We Are Improving
How Will We Know We Are Improving? Understanding the System for Weight Loss with Measures Here is a theory about the drivers that impact my current weight loss campagin [BUILD1] Of course, every system is perfectly designed to achieve… [BUILD2] What would it take to achieve a NEW ME? Describe the drivers (alcohol drives both intake and outflow, the latter because it discourages exercise). Points to make: Secondary drivers have a clear impact on the outcome Selection of secondary drivers to work on depends on where we start: if we’re already working out 5 days a week and fit, we’ll probably concentrate on intake; if we don’t drink, then we don’t need to consider that driver. Effective changes are idiosyncratic [BUILD3] Mention Donabedian’s categories, relate to the diet Measures let us • Monitor progress in improving the system • Identify effective changes
. Points to make: Secondary drivers have a clear impact on the outcome. Selection of secondary drivers to work on depends on where we start: if we’re already working out 5 days a week and fit, we’ll probably concentrate on intake; if we don’t drink, then we don’t need to consider that driver. Effective changes are idiosyncratic. [BUILD3] Mention Donabedian’s categories, relate to the diet. Measures let us. • Monitor progress in improving the system. • Identify effective changes.")
21
Group Work Working in pairs, for an improvement aim arising from a national audit define the following: Primary drivers Secondary drivers Possible projects Allow 10 minutes for this exercise

22
Guidance for testing a change concept
A test of change should answer a specific question! A test of change requires a theory and a prediction! Test on a small scale and collect data over time. Build knowledge sequentially with multiple PDSA cycles for each change idea. Include a wide range of conditions in the test sequence. Don’t confuse a task with a test! 29

23
The Model for Improvement
Define the question Gather information and resources (observe) Form hypothesis Generate new hypothesis and retest Analyze and interpret data Perform experiment and collect data
 Form hypothesis. Generate new hypothesis and retest. Analyze and interpret data. Perform experiment and collect data.")
24
Why Test? Why not just implement then spread?
Increase degree of belief Document expectations Build a common understanding Evaluate costs and side-effects Explore theories and predictions Test ideas under different conditions Learn and adapt

25
Repeated Use of the PDSA Cycle
Changes That Result in Improvement Model for Improvement What are we trying to accomplish? How will we know that a change is an improvement? A P What change can we make that S D will result in improvement? DATA D S Implementation of Change P A A S P Wide-Scale Tests of Change D Hunches Theories Ideas A P Follow-up Tests S D Very Small Scale Test

26
The Sequence for Improvement
Make part of routine operations Spreading a change to other locations Test under a variety of conditions Implementing a change Act Plan Study Do Testing a change Theory and Prediction Developing a change

27
Group Work Working in pairs, devise a PDSA cycle to test an idea based upon a problem arising from a national audit. Note – your driver diagram exercise will have developed some ideas for testing! Allow 10 minutes for the exercise

28
Thank You Any Questions?

Similar presentations


 project?>")


