Download presentation
Presentation is loading. Please wait.

1
E. Coli What's in your water?

2
Have you ever wondered what is in your water?

3
Is Spring or Stream Water more Contaminated with E. Coli?

4
Research According to the USDA and the EPA, agricultural run-off can greatly contaminate water sources E. coli from animal dung

5
Springs vs. Streams Springs are underground streams. Springs are naturally filtered. Streams are shallow rivers. Streams are exposed to contaminants

6
Hypothesis Stream water will have the higher E. coli levels than spring water.

8
Experimental Procedure- prepare the sample 1. Collect water samples in sterilized 25 mL glass jars 2. Add 5 mL of sampled water to bottle of nutrients and shake for 5 seconds

9
Materials For this experiment you would need. Incubator Petri dishes and corresponding supplies Eye droppers Water samples Rubber gloves Counting

10
Experimental Procedure- growing the bacteria 3. Place the sample in a Petri dish after 3 minutes the solution gels. Invert dishes 5. The Petri dishes were incubated for 3 days at 23-26 C 4. Colonies are counted and results are graphed 5 Repeat steps 2 through 4 for all samples

11
Incubation Samples are incubated Maintain a constant temperature of twenty-three(23) to twenty-six(26) degrees Celsius All samples were isolates to a sterile surface to control cross contamination
 to twenty-six(26) degrees Celsius All samples were isolates to a sterile surface to control cross contamination")
13
Experimental Procedure Counting Count E.coli in each Petri dish -use a grid over the Petri dish and count the colonies - to ensure accurate data repeat counts

14
Control Group Distilled water- most impurities removed – Zero E. Coli should be present

15
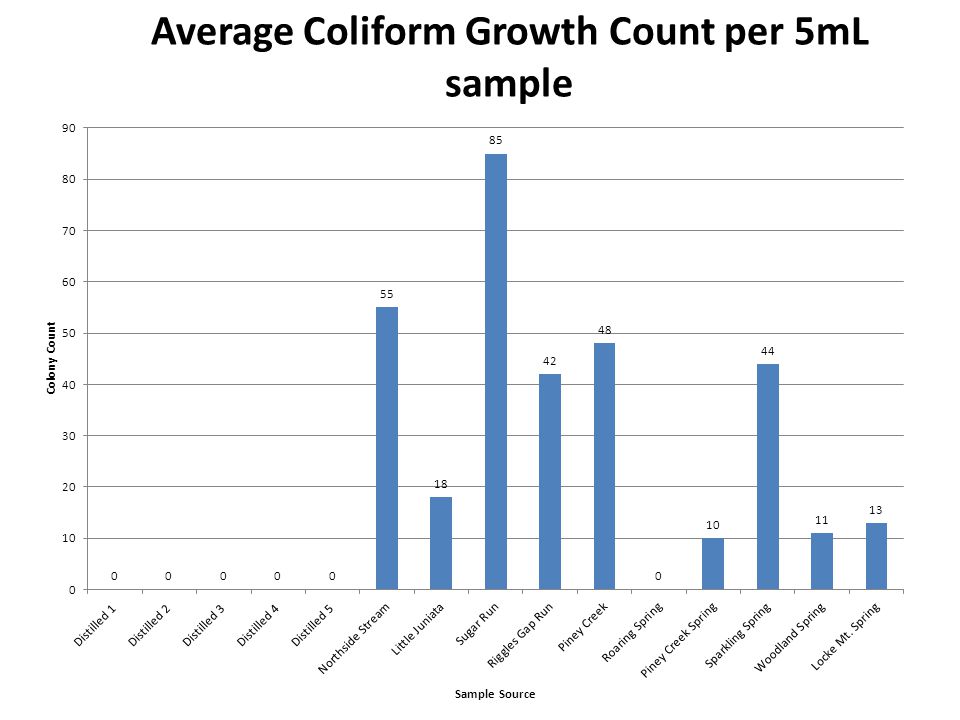
CONTROL Coliform Growth Count per 5mL sample. Distilled Water 10 Distilled Water 20 Distilled Water 30 Distilled Water 40 Distilled Water 50

16
STREAMS Coliform Growth Count per 5mL sample. North Side Stream5553 Little Juniata18 Sugar Run8584 Riggles Gap Run4243 Piney Creek (stream)4850
4850.")
17
SPRINGS Coliform Growth Count per 5mL sample. Roaring Spring00 Piney Creek Spring1013 Sparkling Spring4443 Woodland Spring1110 Locke Mt. Spring1312

21
Average Coliform Count in 5mL sample Distilled0 Stream49.6 Spring15.6

22
Conclusion The data does not support my hypothesis that stream water has more E. coli than spring water. Due to the individuality of streams and springs.

23
Further Improvements to test streams and their corresponding feeder springs to determine the contamination levels from the source and down-stream. the source of the contamination along the waterway.

24
Abstract Is Spring or Stream Water more Contaminated with E. Coli? Stream water will have the higher E. coli levels than spring water. The data supports my hypothesis that stream water has more E. coli than spring water.

Similar presentations


. Triclosan was more.>")
 Radish seeds 8 Test tubes or Bottles Distilled Water 8 Petri Dishes 8 Acetate Grids and.>")
 Pour Plates for Day 2 of Lab 2B Thursday:>")


