Download presentation
Presentation is loading. Please wait.

1
INDUSTRIAL MINERAL TRANSPORTATION and MARKETING

2
TRANSPORTATION CONCEPTS Overall transport is 21% of US economy Often >50% of delivered IM cost Bulk versus value Place value Value added Quality retention or “do no harm” Efficiency, luck, and risk

3
Transport Often exceeds 50% of delivered cost (highest except food) Industrial MineralMineShipping$ End% of As $ per short ton$$Userdel $ Construction aggregates 4–7 2–66-1327-52 Industrial glass/foundry sand 7–126–1013-2239-51 frac sand 15–1225–4040-5265-75 Cement domestic 40–508–1448-6415-24 imported 26–308–1434-4422-33 Pumice (import) 10–159–1219-2742-49 Coal 19–2810–1729-4530-42 Gypsum 5–1010–1515-2557-67 Feldspar (ground) 40–5040–6080-11047-57 Lime 35–5015–2550-7526-37 Kaolin (slurry) 30–4520–35 50-8045-48
 Industrial MineralMineShipping$ End% of As $ per short ton$$Userdel $ Construction aggregates 4–7 2– Industrial glass/foundry sand 7–126– frac sand 15–1225– Cement domestic 40–508– imported 26–308– Pumice (import) 10–159– Coal 19–2810– Gypsum 5–1010– Feldspar (ground) 40–5040– Lime 35–5015– Kaolin (slurry) 30–4520–")
4
GEOLOGY existence Development TRANSPORTATION Production profit MARKET

5
TRANSPORTATION AS MARKETING

6
“THE MARKETING CONCEPT” Focus all activities towards total customer management and satisfaction Make products consumers want vs making consumers want a product Transportation can customer satisfaction Industrial marketing better for IMs than consumer marketing approach Industrial marketing focuses on customer satisfaction

8
IM TRANSPORT COST FACTORS IM volume & processing Wet or dry; bulk or packaged Transport distance Availability, schedule & transit time Equipment & support facilities

9
…more factors Distribution, terminal, & port facilities Support services or lack thereof Ex-Im tariffs, bonding & customs Governmental & environmental regs. Cultural or regional differences Insurance & risk-avoidance

10
TRANSPORT RISK TruckLower Risk Rail Barge ShipHigher Risk

11
TRUCK TRANSPORT Unlimited year-round movement Load & unload quickly Operate independently with small crew Flexible –Small lots & variable sizes –infrequent shipment Very expensive; 10–25¢ per ton-mile

12
TRUCKING 2 Transports about 60% of US cargo Highest cost per ton mile Very flexible Rates fixed (common carrier) or negotiation States set common or contract carrier Common carrier serves all = highly regulated Contract carrier negotiates with each customer separate, confidential contract rates based on many economic and competitive factors
 or negotiation States set common or contract carrier Common carrier serves all = highly regulated Contract carrier negotiates with each customer separate, confidential contract rates based on many economic and competitive factors")
13
RAIL TRANSPORT Slow; limited to track Inflexible Expensive, 2–4¢ per ton-mile Time, volume, distance interaction Railcars/service often unavailable Railroads often difficult to deal with

14
Rail 2 Subsidized or nationalized except in U.S. Haul about 25% of freight Railroads restrict interchange points & reciprocal switching agreements with other railroads Today most material moves under commodity, scale, or contract rates held confidential for competitive advantage Hauls from producer to user over a single railroad are cheaper than joint-line movement –profits are shared –some expenses duplicated

15
Railcar service Mingle car--100 t or less, very slow, high rates Multiple car—1200 t or more, slow, moderate rates Trainload--4000 t or more, cars loaded and unloaded together, fast, low rates Unit train--contract tons per time in set number of cars, continuous turnaround service, very fast, lowest rates Some railcar types used by IM producers are: –hopper –rapid discharge –gondola –covered –pressure differential –and special service

16
Railroad Cost Factors Loading time Volume moved Distance Unloading time Rail equipment Rail equipment owner Competing transport Competing rates Value of service

17
BARGE TRANSPORT Slow Inflexible –needs river, canal or waterway and locks –oriented to large bulk cargoes Limited access; grain season (Aug.–Nov.) Inexpensive; 0.75–1¢ per ton-mile
 Inexpensive; 0.75–1¢ per ton-mile")
18
Barge 2 Relatively unregulated rates; private contracts Contracts negotiated via market forces Inland waterways carry 12% of US freight for 2% of US freight billings Inland waterway is about 23,200 km of which the lower 400 km are accessible to ocean-going vessels Coastal seaways (Gulf Intracoastal Waterway from Texas to Florida is also important The Rhine, and its feeder ports on the North Sea (Rotterdam, Antwerp, Amsterdam), connect via canal to the Danube and the Black Sea
, connect via canal to the Danube and the Black Sea")
19
SHIP TRANSPORT Slow Needs extensive infrastructure Very inflexible –not now geared to IM cargoes –not usually a factor inland Seasonal (grain, iron, coal, fertilizer; E↔W) Very inexpensive; 0.1–0.15¢ per ton mile
 Very inexpensive; 0.1–0.15¢ per ton mile")
20
SHIP TYPES AND SIZES

21
SHIPPING CONTRACT RISK Through Rate Lower Risk Liner Trip Time or Voyage Charter Contract of Affreightment Time Charter Bare BoatHigher Risk

22
… more risks Accidents Weather (time to avoid) Breakdowns Stowage errors Port problems (either end of voyage) Political problems
 Breakdowns Stowage errors Port problems (either end of voyage) Political problems")
23
Shipping Tramp –Voyage: single voyage, rates from spot market –Contract of affreightment: lift specific tonnage over several voyages for a set period –Time: voyages for a specified time under direction of charterer who bears most costs except wages, victuals, and insurance as "disponent owner" –Bare boat: charterer takes vessel for specified time, staffing and operating it without restriction Liner (schedule with conference) Coastal or coaster Short sea Long sea
 Coastal or coaster Short sea Long sea")
24
Shipping, cont. Underutilized in past by industrial minerals Big 3+ = wheat, iron ore, coal, (fertilizer) Brokers critical; history of ship helpful to limit contamination and other problems Bulk shipping –Unregulated –Cyclical –Fixtures by negotiation
 Brokers critical; history of ship helpful to limit contamination and other problems Bulk shipping –Unregulated –Cyclical –Fixtures by negotiation.")
25
Shipping, even more Control over commodity transport greatest if shipping FOB load port and fixing a vessel –Leaves control in hands of IM producer –Ensures vessel type, contamination level, ship-owner reliability, on-time arrival –Flexibility to respond to the freight market Charter on a delivered basis –Cost and freight, or C&F –Leaves control in the hands of the ship-owner –Causes some uncertainty and lowers flexibility

26
Shipping Brokers Cable, cargo, and ship brokers lessen risk – canvass the shipping market, –evaluate freight offers and services, –provide relatively unbiased opinions Worldwide shipping market –cyclical –dominated by supply and demand –operates 24/7 Correct choice of discharge port is critical –based on distance to customer and transport available –shortest distance is not always the cheapest

27
TRENDS Deregulation & integration Marketing & transport distance Just in time delivery; mostly by truck Use of brokers, traders, trade groups Distribution centers Bulk or container terminals

28
…more trends Use of rail & water transport Large ships serving fewer ports Use of containers on inland waterways Importance of transport managers Internet information & commerce

29
SUMMARY OF TRANSPORTATION TYPES

30
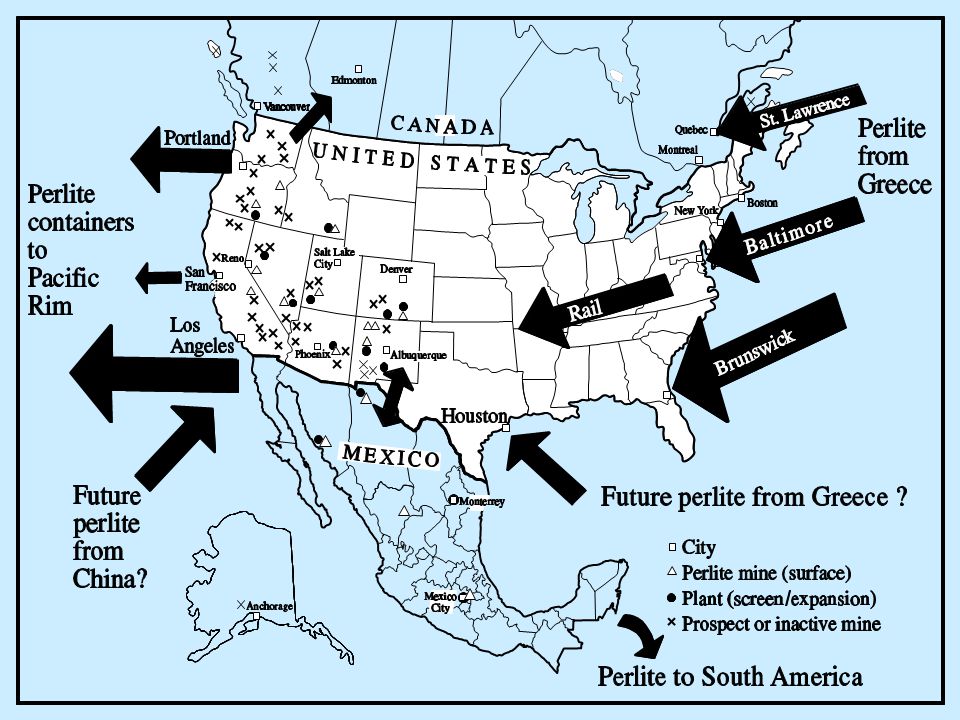
North American Perlite A transport example Greek imports to East Coast of USA Trans-loading from ship to railcars Market focus reversal to West Coast Containers to Pacific Rim Also Gulf access (Mobile; Houston) Panama Canal, Cape Horn
 Panama Canal, Cape Horn")
Similar presentations


 - - 7,000-10,000 BC Wind (sails) - - 3,000 BC Steamboat.>")


 Meaning: transportation is the movement of people and products from one place to another. It’s one of the aids to trade.>")


