Download presentation
Presentation is loading. Please wait.

1
The National Wilderness Preservation System: Character and Valueswww.srs.fs.fed.us/trends Ken Cordell, Forest Service Research, and Ralph Swain, Forest Service Wilderness Management

2
ABOUT THIS PRESENTATION 1.Some selected principles of good Wilderness management 2.The changing social context 3.A big picture description of the NWPS and the characteristic of “Wildness” 4.A Framework of Wilderness values 5.Social Values and Group Differences 6.Economic Values 7.Ecological and Intrinsic Values **************

3
ABOUT THIS PRESENTATION 1.Some selected principles of good Wilderness management 2.The changing social context 3.A big picture description of the NWPS and the characteristic of “Wildness” 4.A Framework of Wilderness values 5.Social Values and Group Differences 6.Economic Values 7.Ecological and Intrinsic Values **************

4
SOME PRINCIPLES of GOOD WILDERNESS MANAGEMENT Wilderness is first and foremost a national resource for the benefit of all, human society and non-humans alike National, regional, and local social, economic, political, and environmental conditions and trends define the changing context within which Wilderness is managed. It is important to know the trends The optimum Wilderness management goals may not always please local interests or the current visitors There are equity and other social issues associated with every management decision made and accounting for them is a responsibility in good management Fragmented (compartmentalized) decision making is easier, but not better Good planning is forward looking, based on what could and should be, not necessarily what is or has been
 decision making is easier, but not better Good planning is forward looking, based on what could and should be, not necessarily what is or has been.")
5
SOME PRINCIPLES of GOOD WILDERNESS MANAGEMENT Wilderness is first and foremost a national resource for the benefit of all, human society and non-humans alike National, regional, and local social, economic, political, and environmental conditions and trends define the changing context within which Wilderness is managed. It is important to know the trends The optimum Wilderness management goals may not always please local interests or the current visitors There are equity and other social issues associated with every management decision made and accounting for them is a responsibility in good management Fragmented (compartmentalized) decision making is easier, but not better Good planning is forward looking, based on what could and should be, not necessarily what is or has been
 decision making is easier, but not better Good planning is forward looking, based on what could and should be, not necessarily what is or has been.")
6
SOME PRINCIPLES of GOOD WILDERNESS MANAGEMENT Wilderness is first and foremost a national resource for the benefit of all, human society and non-humans alike National, regional, and local social, economic, political, and environmental conditions and trends define the changing context within which Wilderness is managed. It is important to know the trends The optimum Wilderness management goals may not always please local interests or the current visitors There are equity and other social issues associated with every management decision made and accounting for them is a responsibility in good management Fragmented (compartmentalized) decision making is easier, but not better Good planning is forward looking, based on what could and should be, not necessarily what is or has been
 decision making is easier, but not better Good planning is forward looking, based on what could and should be, not necessarily what is or has been.")
7
SOME PRINCIPLES of GOOD WILDERNESS MANAGEMENT Wilderness is first and foremost a national resource for the benefit of all, human society and non-humans alike National, regional, and local social, economic, political, and environmental conditions and trends define the changing context within which Wilderness is managed. It is important to know the trends The optimum Wilderness management goals may not always please local interests or the current visitors There are equity and other social issues associated with every management decision made and accounting for them is a responsibility in good management Fragmented (compartmentalized) decision making is easier, but not better Good planning is forward looking, based on what could and should be, not necessarily what is or has been
 decision making is easier, but not better Good planning is forward looking, based on what could and should be, not necessarily what is or has been.")
8
SOME PRINCIPLES of GOOD WILDERNESS MANAGEMENT Wilderness is first and foremost a national resource for the benefit of all, human society and non-humans alike National, regional, and local social, economic, political, and environmental conditions and trends define the changing context within which Wilderness is managed. It is important to know the trends The optimum Wilderness management goals may not always please local interests or the current visitors There are equity and other social issues associated with every management decision made and accounting for them is a responsibility in good management Fragmented (compartmentalized) decision making is easier, but not better Good planning is forward looking, based on what could and should be, not necessarily what is or has been
 decision making is easier, but not better Good planning is forward looking, based on what could and should be, not necessarily what is or has been.")
9
SOME PRINCIPLES of GOOD WILDERNESS MANAGEMENT Wilderness is first and foremost a national resource for the benefit of all, human society and non-humans alike National, regional, and local social, economic, political, and environmental conditions and trends define the changing context within which Wilderness is managed. It is important to know the trends The optimum Wilderness management goals may not always please local interests or the current visitors There are equity and other social issues associated with every management decision made and accounting for them is a responsibility in good management Fragmented (compartmentalized) decision making is easier, but not better Good planning is forward looking, based on what could and should be, not necessarily what is or has been
 decision making is easier, but not better Good planning is forward looking, based on what could and should be, not necessarily what is or has been.")
10
ABOUT THIS PRESENTATION 1.Some selected principles of good Wilderness management 2.The changing social context 3.A big picture description of the NWPS and the characteristic of “Wildness” 4.A Framework of Wilderness values 5.Social Values and Group Differences 6.Economic Values 7.Ecological and Intrinsic Values **************

11
This published book examined the population, demographic, urban, rural, economic, leisure and recreation trends of the United States. An update is underway. *********** ******* DEMOGRAPHIC DATA SOURCE

12
Dominant Socioeconomic Forces Shaping the Future of the United States: An Update of Footprints By H. Ken Cordell 1, John C. Bergstrom 2, Carter J. Betz 1, and Gary T. Green 2 1 2 Introduction This chapter is devoted to providing up-to-date summaries of a number of highly important social and economic trends that will play a role in the future of the United States and its natural resources. The trend topics covered include population growth, changing composition of the population, urban growth and sprawl, transition of rural lands, economic growth, consumer spending, and recreation demands. This chapter is essentially an abbreviated update of the book Footprints on the Land (Cordell & Overdevest, 2001). It is undertaken …….. 1 Project Leader and Outdoor Recreation Planner respectively, USDA Forest Service, Southern Research Station, Athens, GA. 2 Respectively, Professor, Agriculture & Applied Economics, and Assistant Research Scientist, Warnell School of Forest Resources, University of Georgia, Athens, GA. Update Coming in June in a book to be published through the ISSRM
. It is undertaken …….. 1 Project Leader and Outdoor Recreation Planner respectively, USDA Forest Service, Southern Research Station, Athens, GA. 2 Respectively, Professor, Agriculture & Applied Economics, and Assistant Research Scientist, Warnell School of Forest Resources, University of Georgia, Athens, GA. Update Coming in June in a book to be published through the ISSRM.")
14
Including Undocumented (Est.)
")
15
Life Expectancy

16
Historical and Projected Population in the U.S.

17
Historic and Projected Population by Ethnicity

19
LONG TERM TRENDS SINCE 1960

22
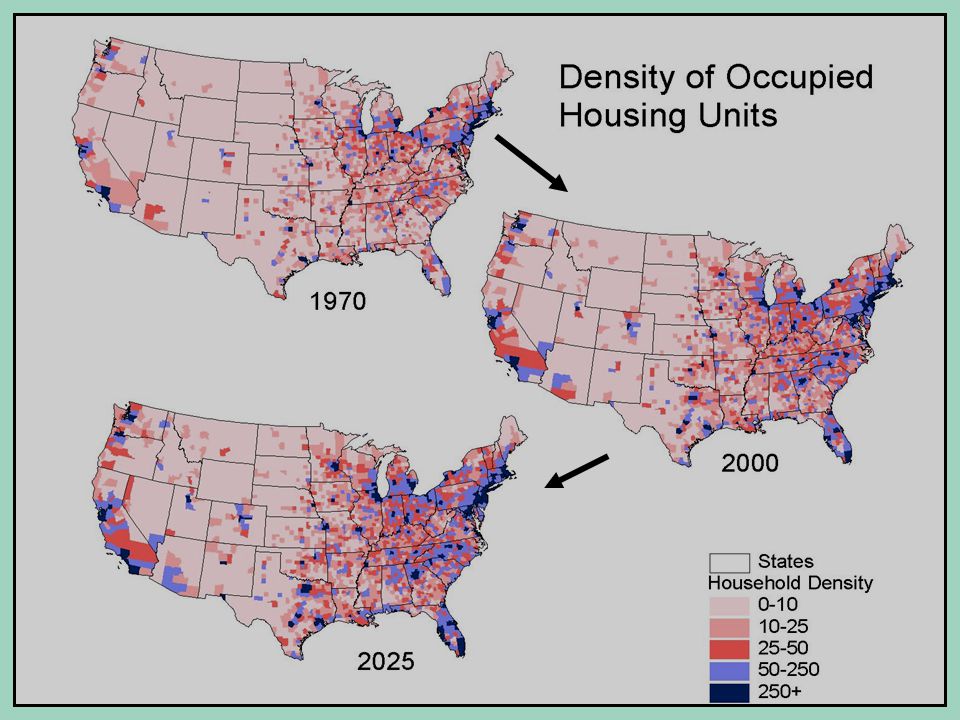
Spatial Relationship of NFs to Heavily Populated Counties 2025

23
ABOUT THIS PRESENTATION 1.Some selected principles of good Wilderness management 2.The changing social context 3.A big picture description of the NWPS and the characteristic of “Wildness” 4.A Framework of Wilderness values 5.Social Values and Group Differences 6.Economic Values 7.Ecological and Intrinsic Values **************

25
Number of Wilderness areas designated in the East, West, and Alaska between 1964 and 2002

26
StateAreasAcresPercentage of National Total Acres Alaska4858,182,21658.70 California13013,975,53514.10 Arizona904,518,4424.56 Washington304,324,1824.36 Idaho74,015,0614.05 Montana153,442,4163.47 Colorado403,171,6853.20 Wyoming153,111,1323.14 Oregon402,258,2382.28 Nevada422,123,3432.14 National Total45799,122,250100.00 Number of Wilderness areas and acres in the 10 states having the most Wilderness

27
Distance Sum of Population Percent of Population 25 miles47,495,99716.8 50 miles114,497,25740.6 100 miles195,745,45269.4 200 miles262,151,98593.0 400 miles281,918,792100.0 Number of people living within 25, 50, 100, 200, and 400 miles of Wilderness

28
Density of roads relative to Wilderness

29
Percentage of total Wilderness area at elevations above 5,000 feet by census division and nationally

30
PrecipitationAreasAcres Percent of Total 0-15 in.14612,920,17927.55 16-30 in.1389,517,03920.29 31-40 in.1018,777,38818.72 41-60 in.1859,817,24420.93 61-90 in.633,533,0527.53 100+ in.202,331,8834.97 National

32
The proportion of Wilderness areas in each of 7 land cover classes by census division

33
Location of designated wilderness areas relative to type of ecosystem at Bailey’s Domain and Division level for each Census Region

37
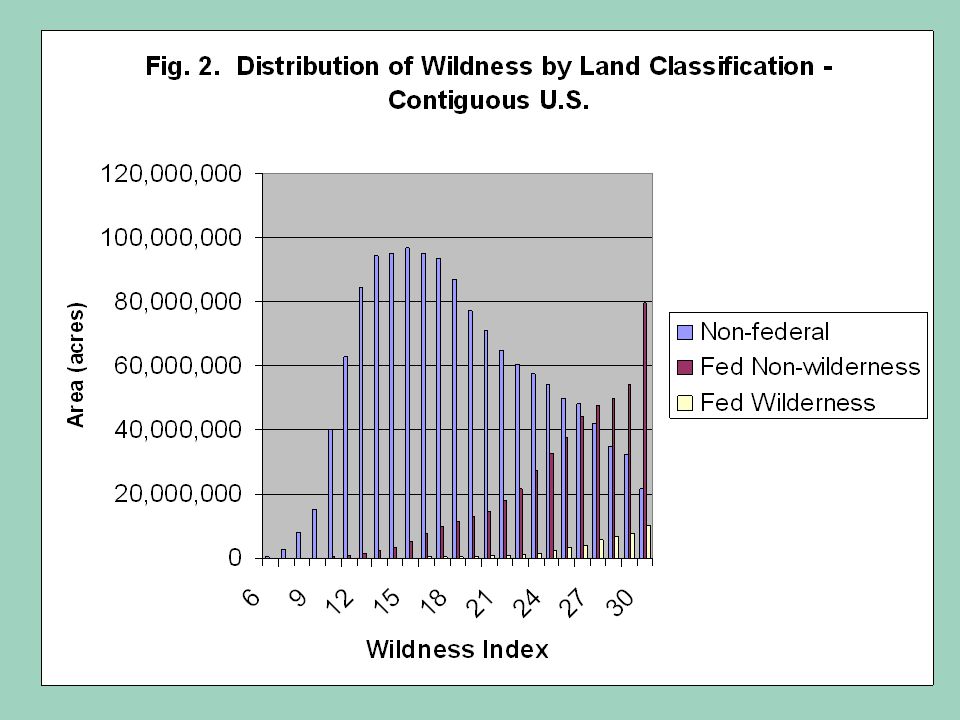
Aplet, et al Wildness Index, 2004 Wild Built

38
ABOUT THIS PRESENTATION 1.Some selected principles of good Wilderness management 2.The changing social context 3.A big picture description of the NWPS and the characteristic of “Wildness” 4.A Framework of Wilderness values 5.Social Values and Group Differences 6.Economic Values 7.Ecological and Intrinsic Values **************

39
Basic Functional Connections Measurement Accounts or CategoriesSpecific Types of Measures or Indicators Wilderness Values SocialPsychological Sociological Anthropological EconomicActive Use Value Passive Use Value Economic Impacts EcologicHuman Life Support Value Animal and Plant Life Support Value EthicalInstrumental Value Intrinsic Value Wilderness Services Animal and Plant Habitat; Carbon Sequestration; Subsistence Living; Cultural Preservation; Historic Preservation; Scientific Discovery; Educational Development; Personal Physical Health and Growth; Personal Emotional Health and Growth; Personal Spiritual Health and Growth; Community Health and Quality of Life Wilderness Functions Preservation of Natural and Wild Places; Recreational and Experiential Setting; Ecosystem and Biodiversity Preserve Wilderness Attributes Geographic; Geologic; Hydrologic; Atmospheric; Biologic; Naturalness; Wildness; Constructed An Organizing Framework for Wilderness Values

40
Basic Functional Connection Measurement Accounts or Categories Examples of Measures or Indicators Wilderness Values SocialDevelopmental/Health Value Social Identify Value Spiritual Value EconomicActive Use Value Passive Use Value Economic Impacts EcologicHuman Life Support Value Animal and Plant Life Support Value EthicalInstrumental Value Intrinsic Value

41
ABOUT THIS PRESENTATION 1.Some selected principles of good Wilderness management 2.The changing social context 3.A big picture description of the NWPS and the characteristic of “Wildness” 4.A Framework of Wilderness values 5.Social Values and Group Differences 6.Economic Values 7.Ecological and Intrinsic Values **************

42
Humans Were Meant to Rule Over Nature 14% Strongly Agree 15% Somewhat Agree 19% Somewhat Disagree 42% Strongly Disagree 29% 61% (6% Neutral)
")
43
Source: Dujack, 1997. Percentage of Americans Reporting Regulation of Natural Resources is “Just the Right Amount” or has “Not Gone Far Enough.”

44
Nationally about 1/2 of American’s 16+ report knowing about the NWPS Only 4.4% feel we have put too many acres into the NWPS: - Not enough 52.6% - About right 26.9% - Too much 4.4% - Not sure 15.4% Public Views on Wilderness

45
Percent of Respondents Too little/Not enough61 About right24 Too much8 Not sure/Don’t know7 American residents’ attitude toward the amount of Wilderness land in the USDA National Forest system

46
What Americans in 2002 Value about Wilderness Percentage Saying It Is Slightly or Not Important Extremely Important Wilderness Value Protecting air quality58.41.5 Protecting water quality55.91.5 Protecting wildlife habitat52.73.1 Protecting endangered species49.85.0 Legacy for future generations49.13.1 Preserving unique ecosystems and genetics44.35.1 Future option to visit37.57.1 Just knowing it is preserved36.96.4 Providing scenic beauty35.45.5 Providing recreation opportunities27.87.2 Providing spiritual inspiration25.9 16.7 Undisturbed area for scientific study23.9 11.6 Providing income for tourism industry 9.7 33.5

47
Very or extremely Important (%) Wilderness value19942002Change Protecting water quality78.993.114.2 Protection of wildlife habitat78.687.8 9.2 Protecting air quality78.092.314.3 For future generations76.987.010.1 Protection for endangered spp73.782.7 9.0 Preserving ecosystems66.580.013.5 Scenic beauty59.774.014.3 Future option to visit59.475.115.7 Just knowing it exists56.174.618.5 For scientific study46.357.511.2 Recreation opportunities48.964.916.0 Providing spiritual inspiration43.256.513.3 Income for tourism industry22.829.7 6.9 Trends in Public Values of Wilderness In International Journal of Wilderness Research last year
 Wilderness value Change Protecting water quality Protection of wildlife habitat Protecting air quality For future generations Protection for endangered spp Preserving ecosystems Scenic beauty Future option to visit Just knowing it exists For scientific study Recreation opportunities Providing spiritual inspiration Income for tourism industry Trends in Public Values of Wilderness In International Journal of Wilderness Research last year")
48
Summation There are three underlying dimensions of Wilderness values that the above public surveying has revealed. In order, by percentage of Americans saying they are extremely important, they are: 1. Ecological services, especially clean air and water for humans and other species, on and off site 2. Ecosystem protection, including wildlife habitat, endangered species and rare and unique species 3. Amenities for human appreciation and use, including wildlands for future generations, current and future options for recreation, scenery, spiritual inspiration, scientific study, and a draw for tourism

49
ABOUT THIS PRESENTATION 1.Some selected principles of good Wilderness management 2.The changing social context 3.A big picture description of the NWPS and the characteristic of “Wildness” 4.A Framework of Wilderness values 5.Social Values and Group Differences 6.Economic Values 7.Ecological and Intrinsic Values **************

62
How would be align messaging to better connect with immigrants?

63
How would we better connect with different age groups?

66
Public Views on Wilderness Nationally about 1/2 of American’s 16+ report knowing about the NWPS Only 4.4% feel we have put too many acres into the NWPS: - Not enough, 52.6% - About right, 26.9% - Too much, 4.4% - Not sure, 15.4%

67
Percent of Respondents Favor Total69.8 Strongly Favor42.5 Somewhat Favor27.3 Oppose Total12.4 Somewhat Oppose6.4 Strongly Oppose6.0 Neither12.2 Don’t Know5.6 Percentages of surveyed American population indicating support or opposition for designating additional wilderness in their own state

68
Should we designate more Wilderness within Federal lands? Important/ Very Important Urban62% Suburban56% Rural47%

69
Should we designate more Wilderness within Federal lands? Important/ Important/ Very Important White59% Black49% Hispanic56% Asian75%

70
Should we designate more Wilderness within Federal lands? Important/ Important/ Very Important North66% South55% Great Plains50% Rockies59% Pacific Coast59%

71
Recreation is another significant social benefit Total NWPS Site Visits12,825,610 FS site visits10,517,000 NPS site visits1,923,841 FWS site visits333,466 BLM site visits51,302 Total single-day site visits8,458,490 Total multi-day site visits4,367,120 Total FS, FWS, & BLM site visits10,901,768 FS, FWS, & BLM single-day site visits (73%)7,958,291 FS, FWS & BLM multi-day site visits (27%)2,943,477 Total NPS site visits1,923,841 NPS single-day use (26%)500,199 NPS multi-day use (74%)1,423,643 Total visitation by agency, visitation by single-day and multi-day use and by region
7,958,291 FS, FWS & BLM multi-day site visits (27%)2,943,477 Total NPS site visits1,923,841 NPS single-day use (26%)500,199 NPS multi-day use (74%)1,423,643 Total visitation by agency, visitation by single-day and multi-day use and by region")
72
BenefitGrand Mean Enjoy nature1.5 Physical fitness2.0 Reduce tensions2.2 Escape2.2 Outdoor learning2.3 Sharing values2.8 Independence3.0 Family kinship3.0 Spiritual3.1 Considerate people3.3 Achievement/stimulation3.4 Physical rest3.5 Teach/lead others3.8 Risk taking4.6 Risk reduction4.7 Meet new people5.1 Mean scores of responses to 16 wilderness recreation experience preference domains from eight designated wilderness areas

73
Population-wide Total (Overlapping) Occasions Per Year by Groupings of Activities (2000-01) All activities98.5%273.8 Viewing, learning, gathering activities 88.4%136.1 Developed site activities94.9%93.3 Activities on trails40.4%40.3 Swimming, surfing, and other beach activities 2.8%36.6 Motorized activities62.0%31.3 Hunting and fishing38.1%26.9 Snow activities19.3%13.3 Risk activities35.2%12.0 Non-motorized activities22.8%7.9 PERCENT OF POPULATION PARTICIPATING AND PER-CAPITA OCCASSIONS
 Occasions Per Year by Groupings of Activities ( ) All activities98.5%273.8 Viewing, learning, gathering activities 88.4%136.1 Developed site activities94.9%93.3 Activities on trails40.4%40.3 Swimming, surfing, and other beach activities 2.8%36.6 Motorized activities62.0%31.3 Hunting and fishing38.1%26.9 Snow activities19.3%13.3 Risk activities35.2%12.0 Non-motorized activities22.8%7.9 PERCENT OF POPULATION PARTICIPATING AND PER-CAPITA OCCASSIONS")
74
Venture Publishing

75
Public Lands and NWPS Lands Overlaid onto Projected Recreation Demand Hotspots, 2020

76
Wilderness Visits to National Forests 2001 Source: NVUM (Thousands)
")
77
Distribution by Length of Stay (in hours) Wilderness
 Wilderness")
78
Forest Service RegionPercentage single-day use (FS only) R1 – Northern Rocky Mountain55.8 R2 – Rocky Mountain85.9 R3 – Rocky Mountain-Southwest93.6 R4 – Intermountain84.0 R5 – Pacific – Southwest77.5 R6 – Pacific – Northwest62.6 R8 – South70.8 R9 – North29.8 R10 – Alaska98.1 Average73.1 Percentages of single-day wilderness visits by Forest Service Region
 R1 – Northern Rocky Mountain55.8 R2 – Rocky Mountain85.9 R3 – Rocky Mountain-Southwest93.6 R4 – Intermountain84.0 R5 – Pacific – Southwest77.5 R6 – Pacific – Northwest62.6 R8 – South70.8 R9 – North29.8 R10 – Alaska98.1 Average73.1 Percentages of single-day wilderness visits by Forest Service Region")
79
Duration of Wilderness Visits Site TypeSite visit (hours) Developed Day Use 1.9 Developed Overnite 25.9 General Forest Area 26.5 Wilderness 19.7
 Developed Day Use 1.9 Developed Overnite 25.9 General Forest Area 26.5 Wilderness 19.7")
80
Age Distribution (%) Category All NF Visits Wilderness Site Visits 20 and Under 17.621.6 21 to 30 13.320.4 31 to 40 22.133.4 41 to 50 15.015.1 51 to 60 12.86.1 61 to 70 12.82.6 Over 70 6.60.7
 Category All NF Visits Wilderness Site Visits 20 and Under to to to to to Over")
81
Race/ethnicity Distribution (%) Category All NF Visits Wilderness Site Visits White 97.497.3 Spanish, Hispanic or Latino 0.40 Black/African American 0.81.5 Asian 0.31.2 Am. Indian/ Alaska Native 0.10 Native Hawaiian or Pacific Islander 0.80 Other 0.20

82
Perception of crowding Overnight SitesDay Use SitesWildernessGeneral Forest 10 Over crowded 0.0 2.9 9 6.30.0 8 16.91.114.41.1 7 3.24.80.04.7 6 13.72.01.310.1 5 27.915.153.419.2 4 13.77.75.015.1 3 13.327.214.313.8 2 0.025.911.618.4 1 Hardly anyone there 5.116.20.014.6 Perceptions of Crowding

83
ABOUT THIS PRESENTATION 1.Some selected principles of good Wilderness management 2.The changing social context 3.A big picture description of the NWPS and the characteristic of “Wildness” 4.A Framework of Wilderness values 5.Social Values and Group Differences 6.Economic Values 7.Ecological and Intrinsic Values **************

84
Decreasing tangibility of benefits

85
Direct On-Site Use and Passive Use Economic Value Value TypeUseNet Economic Value Annual Net Economic Value On-site recreation value: Single-day use 8.4 million single-day trips per year $19.50 per trip$165 million On-site recreation value: Multi-day use 4.4 million multi- day trips per year $68.47$299 million Passive use Value 52.7 million households $63.31 per household $3.34 billion Total Annual NEV $3.8 billion Per acre$35.89

86
Summation Passive use net economic value per annum is estimated to be $3.45 billion. On-site recreation use value is estimated to be around $464 million per year Passive use value is estimated to be over 7 times (7.4 actually) greater than on-site recreation use value.
 greater than on-site recreation use value..")
87
Does Wilderness Designation Harm Rural Economies? There are no discernible general patterns of negative impacts from Wilderness existing in rural counties Economic growth is greater for non-metropolitan counties that contain or are near publicly-owned natural areas, including Wilderness Wilderness contributes to the quality of life of local residents and it is actively sought in migration decisions The role of Wilderness in local economic development is similar to the old BASF commercial: “We don’t build it, we just make it better” Economic growth is increasingly being generated by multiplier effects from consumer spending in the services and trades sectors But, the total volume of visitation to Wilderness, and the associated spending by nonlocal visitors is not sufficient to sustain any significant tourism industry by itself “Wilderness protection does not impoverish communities by locking up resources. Rather, it protects the economic future of those communities by preserving high quality natural environments that are increasing in demand across the nation.” (Tom Power 1996) Economic Impacts
 Economic Impacts.")
88
Economic Growth Effects of Wilderness in Non-Metropolitan Western Counties Counties Containing: Number of Counties Employment Growth 1969-1997 (%) Income Growth 1969-1997 (%) No federal lands1363.5755.9 Any federal lands401142.7992.5 Federal multiple use lands 172115.6864.5 Federal multiple use lands and protected lands 230163.31089.7 More protected lands than multiple use lands 13197.31109.2
 Income Growth (%) No federal lands Any federal lands Federal multiple use lands Federal multiple use lands and protected lands More protected lands than multiple use lands")
89
Employment growth, 1969-1996 Per Capita Income growth, 1969-1996 Total Income growth, 1969-1996 Population growth, 1969-1996 All rural counties (n=113) 0.3820.2530.3410.337 Rural counties not adjacent to metropolitan areas (n=83) 0.4430.2890.4060.453 Correlation of percentage of Wilderness in a sample of western rural counties and their economic development indicators
 Rural counties not adjacent to metropolitan areas (n=83) Correlation of percentage of Wilderness in a sample of western rural counties and their economic development indicators")
90
StatementAgreeDisagreeNo Opinion Nearby wilderness areas are important to county 81109 Wilderness important reason why move or stay 532622 There should be more access to wilderness 433621 Additional wilderness should be designated nearby 393526 Wilderness areas should be opened for mineral and energy development 226513 Percent agreeing or disagreeing with Wilderness statement, National Survey

91
Does Wilderness Designation Harm Rural Economies? There are no discernible general patterns of negative impacts from Wilderness existing in rural counties Economic growth is greater for non-metropolitan counties that contain or are near publicly-owned natural areas, including Wilderness Wilderness contributes to the quality of life of local residents that is actively sought in migration decisions The role of Wilderness in local economic development is similar to the old BASF commercial: “We don’t build it, we just make it better” Economic growth is increasingly being generated by multiplier effects from consumer spending in the services and trades sectors But, the total volume of visitation to Wilderness, and the associated spending by nonlocal visitors is not sufficient to sustain any significant tourism industry by itself “Wilderness protection does not impoverish communities by locking up resources. Rather, it protects the economic future of those communities by preserving high quality natural environments that are increasing in demand across the nation.” (Tom Power 1996) Economic Impacts
 Economic Impacts.")
92
Additional Values (No less Important) Ecological (The contribution of Wilderness to sustaining natural systems that support life, human and non-human) Intrinsic (From a philosopher’s perspective, the intrinsic value of something is really its claim to be)
 Ecological (The contribution of Wilderness to sustaining natural systems that support life, human and non-human) Intrinsic (From a philosopher’s perspective, the intrinsic value of something is really its claim to be)")
93
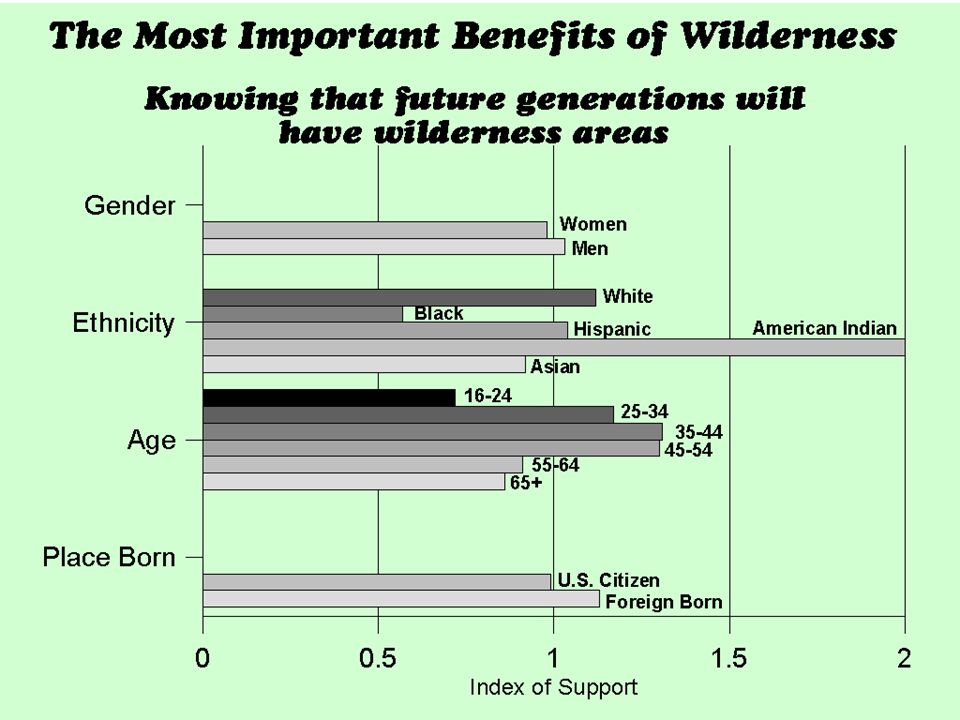
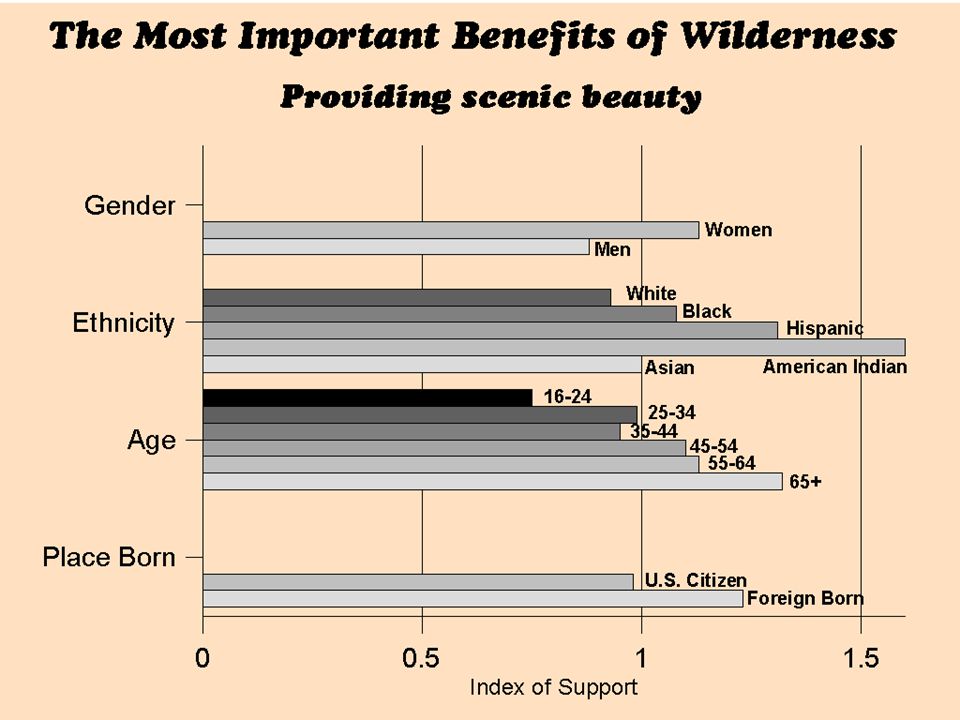
Protecting air quality Protecting water quality Protecting wildlife habitat Protecting T&E species Legacy for future generations (By Majority Vote)
")
94
SOME PRINCIPLES of GOOD WILDERNESS MANAGEMENT Wilderness is first and foremost a national resource for the benefit of all, human society and non-humans alike National, regional, and local social, economic, political, and environmental conditions and trends define the changing context within which Wilderness is managed. It is important to know the trends The optimum Wilderness management goals may not always please local interests or the current visitors There are equity and other social issues associated with every management decision made and accounting for them is a responsibility in good management Fragmented (compartmentalized) decision making is easier, but not better Good planning is forward looking, based on what could and should be, not necessarily what is or has been
 decision making is easier, but not better Good planning is forward looking, based on what could and should be, not necessarily what is or has been.")
95
SOME POINTS TO PONDER Wilderness is an American treasure, owned by the people of this Country, held by you in a trust of stewardship Stewardship includes being informed of the positions and values of the “Stockholders” of this rich national treasure—IT IS IMPORTANT TO KNOW THE DATA Limiting data to on-site surveys and “conventional wisdom” ignores the vast majority of the Wilderness System’s owners, the public, most of whom will never show up—USE HOUSEHOLD SURVEYS

97
The National Wilderness Preservation System: Character and Valueswww.srs.fs.fed.us/trends Ken Cordell, Forest Service Research, and Ralph Swain, Forest Service Wilderness Management END

98
QUESTIONS My questions: 1. Many different aspects of Wilderness are valued by the American Public. Among these values are passive use values and on-site recreation use values. Science-based estimates of one of these types of values is larger in economic terms than the other. Which is larger AND by a magnitude of how much? (E.g., twice as large, 4 times as large, etc.) _______________________________________________________________________ ________________________. 2. What are the three dimensions of Wilderness values that have resulted from public survey research Ken Cordell and his colleagues have done recently. Please put them in the correct order from the highest public support percentage (first one on your list) to the lowest public support percentage (third one on your list). –__________________
 _______________________________________________________________________ ________________________. 2. What are the three dimensions of Wilderness values that have resulted from public survey research Ken Cordell and his colleagues have done recently. Please put them in the correct order from the highest public support percentage (first one on your list) to the lowest public support percentage (third one on your list). –__________________.")
99
4. Many different aspects of Wilderness are valued by the American Public. Among these values are passive use values and on-site recreation use values. Science-based estimates of one of these types of values are larger in economic terms than the other. Which is larger AND by a magnitude of how much. (e.g., twice as large, 4 times as large, etc.) Passive use net economic value per annum is estimated to be $3.45 billion. On-site recreation use value is estimated to be around $464 million per year. Passive use value is estimated to be over 7 times (7.4 actually) greater than on- site recreation use value. 5. What are the three dimensions of Wilderness values that have resulted from public survey research Ken Cordell and his colleagues have done recently? Please put them in the correct order from the highest public support percentage (first one on your list) to the lowest public support percentage (third one on your list). 1. Ecological services, especially clean air and water for humans and other species, on and off site 2. Ecosystem protection including wildlife habitat, endangered species and rare and unique species 3. Amenities for human appreciation and use including wildlands for future generations, recreation, spiritual inspiration, scientific study, and a draw for tourism
 Passive use net economic value per annum is estimated to be $3.45 billion. On-site recreation use value is estimated to be around $464 million per year. Passive use value is estimated to be over 7 times (7.4 actually) greater than on- site recreation use value. 5. What are the three dimensions of Wilderness values that have resulted from public survey research Ken Cordell and his colleagues have done recently. Please put them in the correct order from the highest public support percentage (first one on your list) to the lowest public support percentage (third one on your list). 1. Ecological services, especially clean air and water for humans and other species, on and off site 2. Ecosystem protection including wildlife habitat, endangered species and rare and unique species 3. Amenities for human appreciation and use including wildlands for future generations, recreation, spiritual inspiration, scientific study, and a draw for tourism.")
Similar presentations


 Presentation by Jeff S. Sharp OLC Annual Meeting & Industry Symposium Plain City, Ohio February.>")


