Download presentation
Presentation is loading. Please wait.

1
Climate Change SNC 2D1

2
Weather short term, local changes in factors such as:
temperature precipitation wind speed cloud cover Relative humidity atmospheric pressure these factors fluctuate frequently sometimes on an hourly basis Weather changes are caused by the movement and interaction of air currents and ocean currents on earth, as they carry energy that originated from the Sun

3
Climate long term changes in weather factors, usually over a larger geographic area the climate in Ontario changes with the four seasons the climate in tropical areas like Singapore does not change as much – only dry season and rainy season to determine climate patterns meteorologists collect weather data over many years climate determines the types of flora and fauna that live in an ecosystem White Pine trees are common in Ontario, but not in Barbados – similarly, palm trees are not common in Ontario

4
Classifying Climate Climate zones – developed by Vladimir Köppen in the early 1900s – he used temperature and precipitation data along with plant communities to identify patterns within geographic regions

5
Classifying Climate Ecoregions – based more in ecological data than the climate zones – use information about landforms, soil types, plants, animals and climate data

6
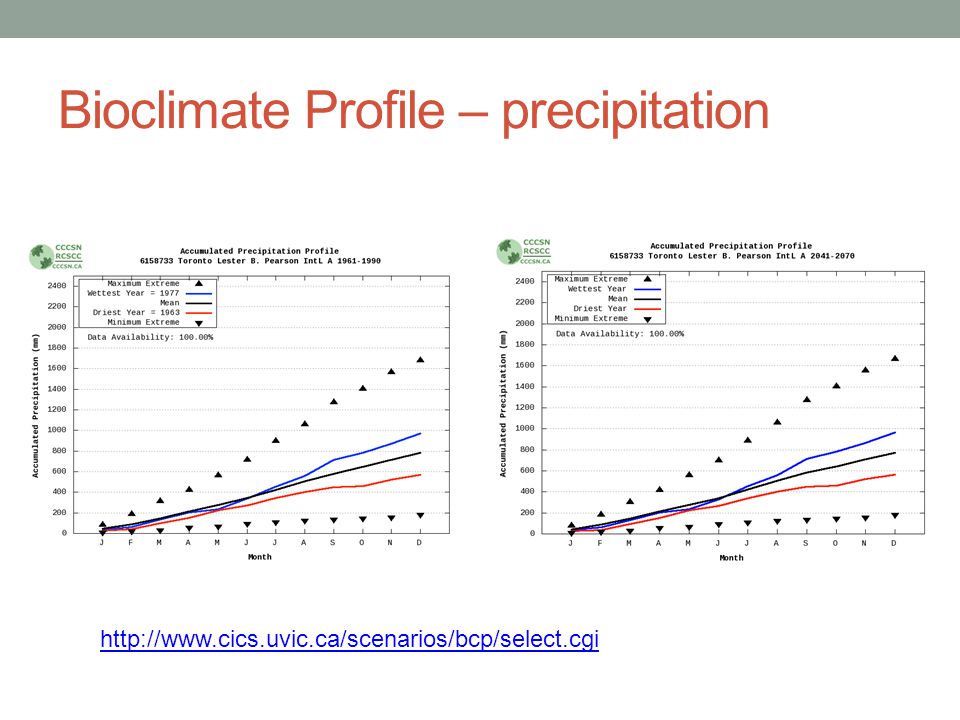
Classifying Climate Bioclimate Profiles – developed by Canadians – they provide ‘climate at a glance’ in a graphical representation of climate on a site by site basis. a typical bioclimate profile consists of a number of elements which describe the temperature and moisture conditions at the site in question bioclimate profiles have been developed for over 500 locations across Canada, for two climate periods of historical data: and is primarily used as the ‘baseline’ period , is the most recent 30-year ‘climate normals period’ both can be used as a reference for predicting future climate data

7
Bioclimate Profile – temperature

8
Bioclimate Profile – precipitation
9
Factors affecting climate
Distance from the equator (latitude) Proximity to large bodies of water Presence of ocean or air currents Land formations Height above sea level (altitude)
 Proximity to large bodies of water. Presence of ocean or air currents. Land formations. Height above sea level (altitude)")
10
Sun’s Importance in Earth’s Climate
The earth’s global climate system in powered by incoming solar radiation – almost all energy on earth comes from the sun Incoming solar energy can take three forms ultraviolet radiation visible light increasing wavelength, decreasing energy infrared radiation When the sun’s rays hit a particle or object, they may be absorbed transmitted reflected

11
Absorption and reflection of sun’s energy

12
Maintaining an energy balance
if all of the energy coming from the sun were to remain on the Earth, it would eventually continue to heat up to levels that would not support life we know this does not happen, so energy must be released in some way the Earth’s surface (land and oceans) emits energy to the atmosphere the atmosphere then emits that energy back out into space this energy is emitted in the form of infrared radiation
 emits energy to the atmosphere. the atmosphere then emits that energy back out into space. this energy is emitted in the form of infrared radiation.")
13
Absorption, reflection and emission

14
How does latitude affect climate?
At the equator, the sun’s rays are concentrated onto a smaller area Near the poles, the same amount of sunlight energy is spread out over a larger area

15
Components of Earth’s Climate System
Atmosphere layers of mixed gases that surround the planet, reaching more than 100km above the Earth’s surface Layers include: troposphere, stratosphere, mesosphere, thermosphere and exosphere The ozone layer in the stratosphere absorbs much of the sun’s UV radiation, which would otherwise harm plants and animals The atmosphere absorbs and reflects the sun’s energy and also transmits to the earth’s surface - transferring energy and heat around the planet with air currents and winds

16
Components of Earth’s Climate System
Hydrosphere Includes all water on the earth, in solid, liquid or gaseous forms Liquid water (oceans, lakes, rivers) can absorb and reflect the sun’s energy Water vapour (especially as clouds) reflect sun’s energy Ice and snow (glaciers, ice caps, permafrost) reflect a lot of the sun’s energy Together all are part of the water cycle, which helps to transfer energy and heat around the planet
 can absorb and reflect the sun’s energy. Water vapour (especially as clouds) reflect sun’s energy. Ice and snow (glaciers, ice caps, permafrost) reflect a lot of the sun’s energy. Together all are part of the water cycle, which helps to transfer energy and heat around the planet.")
17
Components of Earth’s Climate System
Lithosphere Includes the Earth’s crust – rock, soil on land as well as under bodies of water Landforms can affect the climate by changing the movement of air currents and precipitation (rain shadow effect) Living things Plants, animals, fungi, bacteria – all are part of the climate system since they interact with water and air Plants take in CO2, while animals and other organisms release it into the atmosphere Some organisms also produce other waste gases, such as methane, which along with CO2 also affect the absorption of the sun’s energy by the atmosphere
 Living things. Plants, animals, fungi, bacteria – all are part of the climate system since they interact with water and air. Plants take in CO2, while animals and other organisms release it into the atmosphere. Some organisms also produce other waste gases, such as methane, which along with CO2 also affect the absorption of the sun’s energy by the atmosphere.")
18
The Greenhouse Effect Without the climate system, the Earth’s average global temperature would be about -18°C, but because of the greenhouse effect, it is actually 15°C Much of the sun’s high energy radiation passes through the gases of the atmosphere where it is absorbed by the Earth’s surface Here it is converted into infrared radiation (thermal energy and emitted back to the atmosphere Some gases absorb this IR radiation well, and then re-emit it in all directions – about half of it back to the earth’s surface

19
The Greenhouse Effect

20
Concentration in atmosphere
Greenhouse Gases Most of the atmosphere is N2 and O2 which do not absorb infrared radiation The gases in small proportion are responsible for the greenhouse effect, including: The contribution to the greenhouse effect depends on the concentration of the gas in the atmosphere, as well as how much thermal energy each molecule of gas can absorb Greenhouse Gas Concentration in atmosphere Carbon dioxide 385 ppm Water vapour 0 – 4 % Methane 1.785 ppm Nitrous oxide 321 ppb

21
Carbon Dioxide CO2 is estimated to contribute to 25% of the greenhouse effect on Earth pre-industrial (before 1750) levels were around 280 ppm natural sources include: Cellular respiration of plants and animals Volcanic eruptions Burning and decay of organic matter the carbon cycle has long maintained a balance in the CO2 levels carbon sinks remove CO2 from the atmosphere and convert it into organic molecules like sugars terrestrial plants and algae in the oceans and lakes are important carbon sinks

22
Water Vapour The amount of water vapour in the atmosphere depends on the temperature As temperature increases, more water evaporates Warmer air can also hold more water vapour With more water vapour in the air, the greenhouse effect is intensified, further increasing the temperature This is called a positive feedback loop, where the effect enhances the original cause In negative feedback loops, the effect decreases the original cause

23
Positive Feedback Loop
More water vapour leads to higher temperatures Higher temperatures leads to more water vapour

24
Methane and Nitrous Oxide
one molecule can absorb about 23 times more thermal energy than a molecule of CO2 Natural sources include plant decomposition in swamps, and animal digestion Pre-industrial levels were ppm Nitrous Oxide Can absorb about 300 times more thermal energy than CO2 Natural sources include bacterial activity in soils and water Pre-industrial levels were 270 ppb

25
Energy Transfer Energy and heat can be transferred in three ways:
Conduction – through collision of particles Convection – through movement of fluids (liquids or gases) Radiation – infrared (thermal) energy through space
 Radiation – infrared (thermal) energy through space.")
26
Energy Transfer in the Atmosphere
The sun’s rays near the equator cause air to rise Once it reaches the troposphere, it cools and descends This movement of air creates a circular current called a convection current This pattern is repeated near the poles The rotation of the Earth from east to west causes these winds to twist (this is called the coriolis effect) These twisting winds are known as the prevailing winds - these tend to move warm air from the equator up towards the poles – if they did not exist, there would be a much greater difference in temperature between the equator and the poles
 These twisting winds are known as the prevailing winds - these tend to move warm air from the equator up towards the poles – if they did not exist, there would be a much greater difference in temperature between the equator and the poles.")
27
Prevailing Winds

28
Energy Transfer in Oceans
Water moving toward the poles gets cooler As some of it freezes into ice, the remaining water becomes saltier, making it more dense The higher density, cooler, saltier water sinks Warmer water from the equator flows toward the poles to replace it This creates the thermohaline circulation, and acts like a global conveyor belt, distributing heat through ocean currents Warm and cold ocean currents have a significant effect on climate Newfoundland’s climate is affected by the cold Labrador current Northwestern Europe has a warmer, damper climate than would be expected based on the latitude due to the warm Gulf Stream

29
Thermohaline Circulation

30
Think you understand heat transfer?
Try the Heat Game ! If not, review the Earth as a System video

31
Long-term cycles in climate
The earth is 4.6 billion years old, and has undergone many changes in its history Many of these changes affected climate in dramatic ways Any change that affects Earth’s energy balance will cause a change in climate These could be due to geologic changes in the Earth’s crust, or variations in the Earth’s orbit, or in the amount of energy put out by the sun

32
Long-term changes: Continental drift
The earth’s land masses have moved over the surface of the globe, and continue to move today This is due to shifting plates on the crust, explained by the theory or plate tectonics When continents move, ocean currents are affected, which affects heat transfer Today, most of the Earth’s land mass is in the northern hemisphere – because there are fewer large bodies of water, this results in cooler winters and warmer summers Uplifting of new mountain ranges can also affect local climates by influencing the movement of air masses

33
Continental Drift

34
Long-term changes: Milankovitch cycles
The last 800,000 years have seen the Earth’s climate cycling between freezing ice ages and warmer interglacial periods Currently the Earth is in an interglacial period which has existed for the last 10,000 years There are several factors which cause these alternating ice ages and interglacial periods – collectively they are known as the Milankovitch cycles, after engineer and amateur astronomer Milutin Milankovitch Each of these factors changes the amount of solar radiation affecting Earth

35
Milankovitch cycles - eccentricity
The shape of Earth’s orbit varies over time, changing from circular to an oval shape & back again every 100, 000 years, affecting length and intensity of seasons. Orbit closer to sun (more solar radiation) Orbit farther from sun (less solar radiation)
 Orbit farther from sun (less solar radiation)")
36
Milankovitch cycles – Tilt
The angle of the earth’s axis changes in a 41,000 year cycle Currently the tilt is 23.5°, slowly decreases to a minimum angle of 22.1° and then back to a maximum of 24.5°

37
Milankovitch cycles – Precession
The direction of the tilt of the earth’s axis changes in a 26,000 year cycle Similar to a spinning top as it slowly changes the direction in which it points The Earth’s axis currently points toward the star Polaris, but in 1000 years, it will point toward the star Airai

38
Milankovitch cycles – Overall effects

39
Milankovitch cycles – Overall effects
Together these Milankovitch cycles act as the main trigger for the 100,000 year cycles in glaciation With small changes in the amount of energy the Earth receives, positive feedback then enhances these changes thousands of years

40
Short term variations in climate
Volcanic Eruptions Volcanoes release enormous amounts of rocks, dust and gases high into the atmosphere These emissions can travel with air currents over large areas, shading the earth and reflecting solar energy In particular, sulfur dioxide reflects a lot of solar radiation, cooling the earth temporarily These effects can last for weeks, months or years depending on the size of the volcanic eruption

41
Short term variation in climate
Mount Pinatubo Erupted in July 1990, emitting between million tons of sulfur dioxide high into the atmosphere – most of the gases were released in a 9-hour period on July 15 This increase in atmospheric SO2 has been linked to the average global cooling of between 0.4°C – 0.5°C in

42
Short term variation in climate
Air and Ocean Currents can have sometimes abrupt changes in climate about 12, ,500 years ago, after the last glacial period, an unexpected cooling occurred for the next 1300 years (± 70 years). one hypothesis to explain this is that large amount of ice was melting, releasing large volumes of fresh water into oceans – it is thought that this disrupted the thermohaline circulation, causing the abrupt cooling of the planet for a while this period is referred to as the Younger Dryas, or “the Big Freeze”
. one hypothesis to explain this is that large amount of ice was melting, releasing large volumes of fresh water into oceans – it is thought that this disrupted the thermohaline circulation, causing the abrupt cooling of the planet for a while. this period is referred to as the Younger Dryas, or the Big Freeze")
43
Short term variation in climate
El Niño a recurring disruption in the Pacific trade winds and ocean currents that brings warm moist air to the west coast of South America, which is usually cool and arid Normally, the Pacific trade winds blow from east to west, dragging the warm surface waters westward, where they accumulate into a large, deep pool just east of Indonesia, and northeast of Australia. Ocean temperatures are shown in the image at right, illustrating a ‘normal’ condition

44
El Niño this warm pool of water helps to maintains the convection currents and trade winds in the atmosphere meanwhile, the deeper, colder waters in the eastern Pacific are allowed to rise to the surface, creating an east-west temperature gradient along the equator known as the thermocline tilt. in the spring, the trade winds diminish and are usually replenished to maintain normal conditions. however, during an El Niño year, the trade winds are not replenished, and so the ocean currents are not pushed westward - this allows warm water to move eastward below the surface, the thermocline flattens out, preventing upwelling of cold water in the eastern Pacific the eastern Pacific warms and water levels rise the western Pacific cools and water levels drop

45
El Nino Above: Red is 30 °C and blue is 8 °C.

46
Feedback Loops and Climate
A process whereby an initial change in the atmospheric process will tend to either: Reinforce the process – positive feedback Weaken the process – negative feedback recall: the water vapour feedback loop This becomes much more complex if clouds and ice are considered More water vapour leads to higher temperatures Higher temperatures leads to more water vapour

47
Cloud altitude and feedback loops
trap thermal energy near Earth’s surface warmer temperatures more low clouds even warmer temperatures clouds form at low altitude Clouds form at high altitudes Reflect Sun’s radiation back to space Cooler temperatures

48
Albedo albedo is a measure of the proportion of radiation reflected by a surface ice and snow have high albedos, while green plants and soil have lower albedos A planet’s average albedo takes into account the proportion of different surfaces The Earth’s albedo is 0.30 – 0.40

49
Albedo Effect This is the positive feedback loop between the amount of ice on the Earth and it’s average temperature Less of Sun’s radiation reflected by ice Earth’s temperature increases Ice melts More of Sun’s radiation reflected by ice Earth’s temperature decreases More ice forms

50
Studying Clues to Past Climates
Weather data has been reliably recorded for at least the last 200 years This provides a good record of the Earth’s climate for this period – but what about earlier in the past? Some informal records can be relied upon – journals, paintings, farming records and oral histories Paleoclimatologists study past (sometimes ancient) climate They use records in nature, called proxy records, including: Ice cores Tree rings Coral reefs Rocks Ocean sediments Caves
 climate. They use records in nature, called proxy records, including: Ice cores. Tree rings. Coral reefs. Rocks. Ocean sediments. Caves.")
51
Ice Cores Ice sheets found in Antarctica, Greenland, and Canada’ arctic can be kilometres deep, formed from hundreds of thousands of years of snowfall, compacted into layers Air bubbles trapped in these layers contain trace amounts of gases that tell us what the atmosphere was like in the past Ions and isotopes can also be detected which give clues to past global events (sulphate ions from volcanos) and past global temperatures (oxygen isotopes)
 and past global temperatures (oxygen isotopes)")
52
Tree Rings Trees grow quickly in the spring, and more slowly for the rest of the season – this produces the annual growth rings Warm wet years produce thicker annual rings, and during drier cooler years, the rings are thinner We can use trees from different sources (living trees, dead trees, timbers found in ancient buildings) to build a climate profile for a geographic area by matching up similar growth patterns in the tree rings By matching tree ring widths, we can develop a chronology that extends quite far into the past, especially knowing that some trees can live for 1500 years or more!
 to build a climate profile for a geographic area by matching up similar growth patterns in the tree rings. By matching tree ring widths, we can develop a chronology that extends quite far into the past, especially knowing that some trees can live for 1500 years or more!")
53
Tree Rings Dendrochronology

54
Coral Reefs Coral reefs also grow in a yearly pattern, called laminations Small samples of coral can be analyzed for oxygen isotopes to indicate the temperature of the oceans when the layers were formed The laminations are only visible under UV lamps, not under visible light

55
Rocks, Ocean Sediment and Caves
Earth’s lithosphere was formed by slowly building up layer upon layer – often trapping clues to climate in these layers Plant materials, such as pollen can be used to identify the species of trees that existed in the past which can give clues about the temperature and climate Ocean sediment cores can be drilled and analyzed for fossils of marine plants and animals – oldest layer is at the bottom of the core, so we can get a picture of how life has changed on the planet for thousands of years

56
What Do You Think Now? About half of the energy on Earth comes from the Sun. The greenhouse effect is a natural phenomenon. Carbon dioxide is an important part of Earth’s climate system. Earth’s climate has remained very stable for thousands of years. Volcanic eruptions cause the climate to change. Weather and climate are the same thing.

Similar presentations


 McGraw Hill Ryerson 2007 11.1 Natural Climate Change “Climate” describes the average conditions of a region. Climate is usually measured over a minimum.>")


 above Earth. Densest – N, O, & water vapor Stratosphere->")