Download presentation
Presentation is loading. Please wait.

1
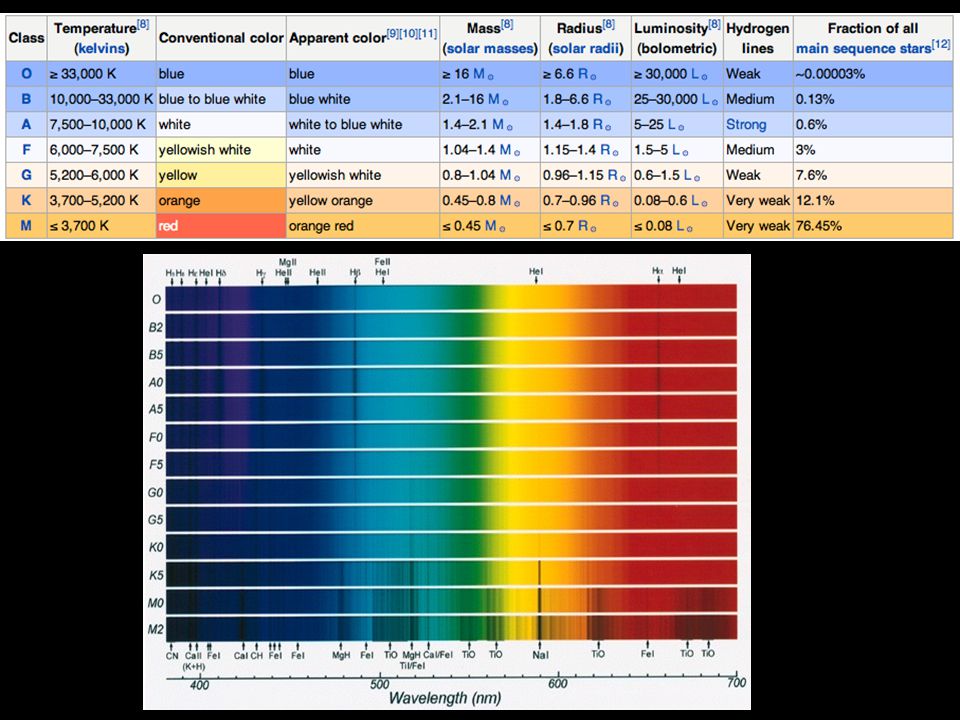
Classification of Stellar Spectra Essentially all stars appear as point sources. Only differences are brightness and spectra. Many differences in spectra due to temperature – Pseudo blackbody (with chromosphere outside photosphere) – Relative strength of absorption lines (due to different stages of ionization and energy states)
 – Relative strength of absorption lines (due to different stages of ionization and energy states).")
2
Hydrogen Absorption Lines in Visible Classification originally based on strength of Balmer absorption lines (2 -> n). A type stars have strongest lines – (OBAFGKM) Harvard Classification obafgkmrns.htmlobafgkmrns.html
 Harvard Classification obafgkmrns.htmlobafgkmrns.html.")
3
http://astronomy.swin.edu.au/cosmos/h/harvard+spectral+classification

4
Hydrogen Balmer Series Balmer series due to transitions from n=2 to n>2 Strength of absorption lines depends on fraction of atoms that are neutral and in the n=2 state Maxwell-Boltzmann Statistics:

6
Saha Equation Relative number of atoms in i th ionization state also determined using Maxwell-Boltzmann statistics – Derivation complicated due to the continua of possible states for free electrons – Result is the Saha equation: Partition function (effective number of states): Ionization energy:
: Ionization energy:")
7
Hydrogen mostly ionized above 12,000 K Thus the fraction of hydrogen atoms in the n=2 energy state is given by fraction of neutral atoms times the fraction of neutral atoms in n=2.

8
Calcium Lines Abundance of calcium is 1/500,000 that of hydrogen Lower ionization energy (6.1 eV) makes calcium essentially all singly ionized (Ca II) Roughly 265/266 Ca II atoms in ground state – 1s 2 2s 2 2p 6 3s 2 3p 6 4s 1 – 4s to 3d produce calcium H & K lines – Even though abundance is low, the high fraction of calcium in ground state produce large absorption lines
 makes calcium essentially all singly ionized (Ca II) Roughly 265/266 Ca II atoms in ground state – 1s 2 2s 2 2p 6 3s 2 3p 6 4s 1 – 4s to 3d produce calcium H & K lines – Even though abundance is low, the high fraction of calcium in ground state produce large absorption lines")
9
Abundances: H – 91% He – 8.9% O -.05% C – 0.03 N – 0.01 Ne -.01 Si -.003 Mg -.003 Fe –.003

10
Solar Spectrum D: Sodium E & G: Iron F: Hydrogen (H beta) C: Hydrogen (H alpha) H & K: Calcium II
 C: Hydrogen (H alpha) H & K: Calcium II")
12
Hertzsprung- Russell Diagram Hipparcos catalog 2010: 16,631 stars with relative distance precision better than 10% Luminosity vs Spectral Classification

13
Hertzspring-Russell Diagram

14
HR Diagram for Nearest Stars

16
Stellar Radii Along constant radius line

17
Sirius A Sirius B

18
Betelgeuse d = 640 ly L = 10 5 L sun R = 1,200 R sun =4.5 AU M = 19 M Sun

19
Correlation between mass, luminosity, and position in MS branch:

Similar presentations


 via green / yellow.>")


 sizes of stars.>")
 2.Mass (from Doppler.>")