Download presentation
Presentation is loading. Please wait.

1
Ecosystems An ecosystem consists of all the organisms living in a community as well as all of the abiotic factors with which they interact. What is a community? An association of species populations inhabiting a given area at the same time. Usually defined by the place in which they live or the nature of their interaction.

2
Ecosystems http://eschooltoday.com/ecosystems/what-is-an-ecosystem.html A pond ecosystem

3
Ecosystems - ecotones Ecosystems: -Rarely have distinct boundaries -Are generally not self-contained -Not self-sustaining

4
Ecosystems - ecotones Ecotone - An ecotone is a transition area between two ecosystems, usually identified by the change in plant communities, such as forest and grassland. Some have distinct boundaries. Some have fuzzy boundaries.

5
Ecosystems – all together now All of the ecosystems on earth are collectively called the The Biosphere By name, it is meant to include all of the areas on earth that support life.

6
Ecosystems – Nutrient Cycling Ecosystems contain: Living organisms Energy Chemicals Nutrients

7
Ecosystems – Nutrient Cycling Recall – Energy does what in ecosystems? A: Energy flows through systems.

8
Ecosystems – Nutrient Cycling Eventually, all energy is lost as heat back into space. Second Law of Thermodynamics – In the conversion of energy from one form to another, high-quality, useful energy is always degraded to low-quality, less useful energy that can’t be recycled to give high-quality energy. (Can’t even break even.) The first law of thermodynamics : “Energy cannot be created or destroyed, it can only be changed from one form to another.” It takes energy to get energy.
 The first law of thermodynamics : Energy cannot be created or destroyed, it can only be changed from one form to another. It takes energy to get energy..")
9
Ecosystems – Nutrient Cycling Organisms cannot live by energy alone. Organism require 17 essential nutrients. Large quantities: Less of: Carbon (C)Calcium (Ca) Hydrogen (H)Magnesium (Mg) Oxygen (O)Sulfur (S) Nitrogen (N)Iron (Fe) Phosphorus (P)Manganese (Mn) Potassium (K)
Calcium (Ca) Hydrogen (H)Magnesium (Mg) Oxygen (O)Sulfur (S) Nitrogen (N)Iron (Fe) Phosphorus (P)Manganese (Mn) Potassium (K).")
10
Ecosystems – Nutrient Cycling Even less of: Trace amounts of: Sodium (Na)Barium (Ba) Boron (B)Cobalt (Co) Molybdenum (Mb)Flourine (F) Copper (Cu)Iodine (I) Chlorine (Cl)Selenium (Se) Zinc (Zn)Silicon (Si) Vanadium (V) Can these chemicals (elements) be lost like heat?
Barium (Ba) Boron (B)Cobalt (Co) Molybdenum (Mb)Flourine (F) Copper (Cu)Iodine (I) Chlorine (Cl)Selenium (Se) Zinc (Zn)Silicon (Si) Vanadium (V) Can these chemicals (elements) be lost like heat")
11
Ecosystems – Nutrient Cycling Two types of cycles: Gaseous cycles Non-gaseous cycles

12
Ecosystems – Nutrient Cycling Two types of cycles: Gaseous cycles Non-gaseous cycles

13
Ecosystems – Nutrient Cycling Two types of cycles: Gaseous cycles Non-gaseous cycles

14
Ecosystems – Nutrient Cycling Two types of cycles: Gaseous cycles Non-gaseous cycles Commemorate Caesar: Take a Deep Breath!

15
Ecosystems – Nutrient Cycling Two types of cycles: Gaseous cycles Non-gaseous cycles – nutrient cycling Nutrients are passed from organism to organism, which results in nutrient cycles. These cycles involve both the biotic and abiotic components of ecosystems, hence they are often called biogeochemical cycles.

16
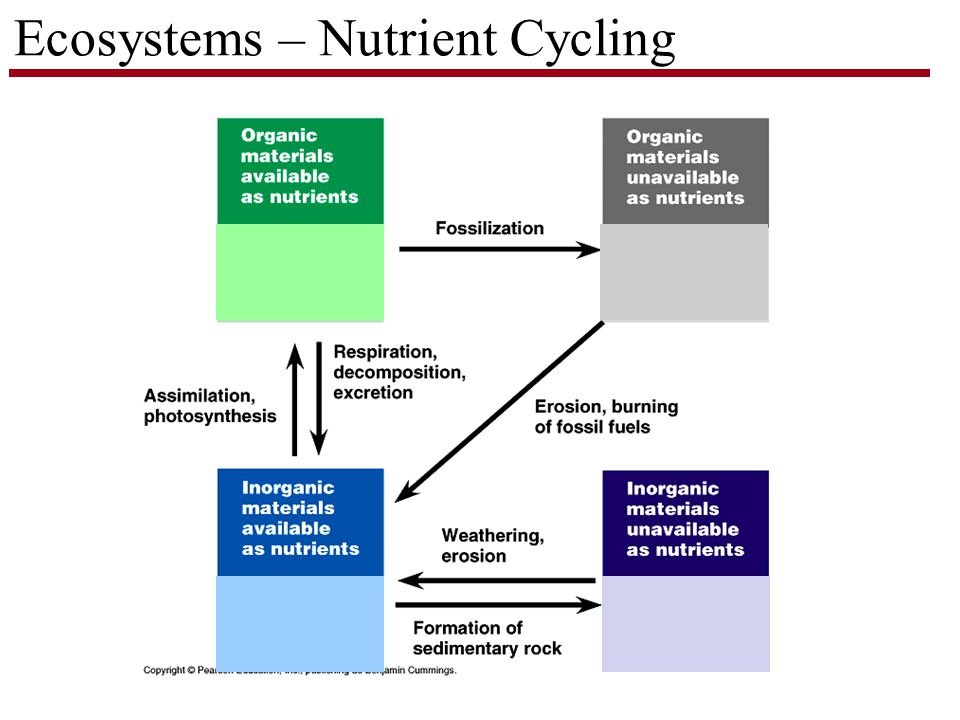
Ecosystems – Nutrient Cycling

18
Ecosystems – Molecules with carbon Lignin Phospholipid – cell memebrane Protein

19
Ecosystems – Carbon Cycle

20
Ecosystems – Phosphorus Cycle

21
Ecosystems – Rhythmic cycles of CO 2

22
Ecosystems – Rhythmic cycles of CO 2 over time Charles Keeling began precise monthly measurements of the concentration of carbon dioxide in 1958. He was the first to do so systematically and so his data have come to be known as the "The Keeling Curve." The measurements were made at the Mauna Loa Astronomical Observatory which is at the summit of an inactive volcano in Hawaii. Mauna Loa was chosen because it is far from major sources or sinks of carbon dioxide. Carbon dioxide concentrations measured at Mauna Loa are a good proxy for the average of the whole Earth. If the general trend continues, the concentration of carbon dioxide will be 400 PPM within ten years. It is hard to avoid this conclusion. Nothing short of a large volcanic eruption or a nuclear war or a large meteorite strike would change this conclusion. 2007

23
Ecosystems – Rhythmic cycles of CO 2 over time

24
Ecosystems – CO 2 concentrations over geologic time The data comes from air bubbles trapped in ice taken from a two kilometer hole drilled into the Antarctic ice sheet.

25
Ecosystems – CO 2 concentrations over geologic time Atmospheric carbon dioxide concentrations in parts per million for the past 800,000 years, with the 2013 annual average concentration as a dashed line. The peaks and valleys in carbon dioxide levels follow the coming and going of ice ages (low CO 2 ) and warmer interglacials (higher CO 2 ). Graph by NOAA Climate.gov, based on EPICA Dome C data (Lüthi, D., et al., 2008) provided by NOAA NCDC Paleoclimatology Program.data
 and warmer interglacials (higher CO 2 ). Graph by NOAA Climate.gov, based on EPICA Dome C data (Lüthi, D., et al., 2008) provided by NOAA NCDC Paleoclimatology Program.data.")
26
Ecosystems – The greenhouse effect

27
Ecosystems – Damaging greenhouse gases Carbon dioxide (CO2) – Life in atmosphere – part of carbon cycle Methane (CH4) – Life in atmosphere – 12 years Impact on climate change – 20x greater than CO2. Nitrous oxide (N 2 O) - Life in atmosphere – 120 years Impact on climate change 300x greater thanCO 2 F-gases (CFC), Hydrofluorocarbons
 - Life in atmosphere – 120 years Impact on climate change 300x greater thanCO 2 F-gases (CFC), Hydrofluorocarbons.")
28
Ecosystems – Damaging greenhouse gases Carbon dioxide (CO2) – Life in atmosphere – part of carbon cycle Methane (CH4) – Life in atmosphere – 12 years Impact on climate change – 20x greater than CO2. Nitrous oxide (N 2 O) - Life in atmosphere – 120 years Impact on climate change 300x greater thanCO 2 F-gases (CFC, Hydrofluorocarbons [HCFC] – Life in atmosphere -
 - Life in atmosphere – 120 years Impact on climate change 300x greater thanCO 2 F-gases (CFC, Hydrofluorocarbons [HCFC] – Life in atmosphere -.")
29
Ecosystems – Damaging greenhouse gases Carbon dioxide (CO2) – Life in atmosphere – part of carbon cycle Methane (CH4) – Life in atmosphere – 12 years Impact on climate change – 20x greater than CO2. Nitrous oxide (N 2 O) - Life in atmosphere – 120 years Impact on climate change 300x greater thanCO 2 F-gases (CFC, Hydrofluorocarbons [HCFC] – Life in atmosphere -
 - Life in atmosphere – 120 years Impact on climate change 300x greater thanCO 2 F-gases (CFC, Hydrofluorocarbons [HCFC] – Life in atmosphere -.")
30
Ecosystems – Damaging greenhouse gases Carbon dioxide (CO2) – Life in atmosphere – part of carbon cycle Methane (CH4) – Life in atmosphere – 12 years Impact on climate change – 20x greater than CO2. Nitrous oxide (N 2 O) - Life in atmosphere – 120 years Impact on climate change 300x greater thanCO 2 F-gases (CFC, Hydrofluorocarbons [HCFC] – Life in atmosphere -
 - Life in atmosphere – 120 years Impact on climate change 300x greater thanCO 2 F-gases (CFC, Hydrofluorocarbons [HCFC] – Life in atmosphere -.")
31
Ecosystems – Damaging greenhouse gases F-gases (CFC) chlorofluorcarbons Hydrofluorocarbons (HCFC) – Life in atmosphere – 1 -270 years. Effect 140 – 11,770x Perfluorocarbons (PFC) – Life in atmosphere – 800 - 50,000 years. Effect 6,500 – 9,200 Sulfur hexafluoride (SF) – Life in atmosphere – 3,200 years. Effect 23,900x refrigerants aerosol propellants, solvents, fire retardants.
 – Life in atmosphere – ,000 years. Effect 6,500 – 9,200 Sulfur hexafluoride (SF) – Life in atmosphere – 3,200 years. Effect 23,900x refrigerants aerosol propellants, solvents, fire retardants..")
32
Ecosystems – Damaging greenhouse gases http://www.climate-connect.co.uk/Home/?q=node/2015

33
Ecosystems – Damaging greenhouse gases http://www.wri.org/publication/navigating-numbers

34
Ecosystems – Perturbations to the CO 2 cycle

35
Ecosystems – Sequestration CO 2 - natural Recent estimatesRecent estimates have calculated that 26 percent of all the carbon released as CO 2 from fossil fuel burning, cement manufacture, and land-use changes over the decade 2002–2011 was absorbed by the oceans. (About 28 percent went to plants and roughly 46 percent to the atmosphere.) During this time, the average annual total release of was 9.3 billion tons of carbon per year, thus on average 2.5 billion tons went into the ocean annually.
 During this time, the average annual total release of was 9.3 billion tons of carbon per year, thus on average 2.5 billion tons went into the ocean annually..")
36
Ecosystems – Sequestration CO 2 - natural

37
Ecosystems – Sequestering CO 2 - anthropogenic As estimated in the U.S. Inventory of Greenhouse Gas Emissions and Sinks, more than 40% of CO 2 emissions in the United States are from electric power generation.U.S. Inventory of Greenhouse Gas Emissions and Sinks Applied to a 500 MW coal-fired power plant, which emits roughly 3 million tons of CO 2 per year, [1] the amount of GHG emissions avoided (with a 90% reduction efficiency) would be equivalent to:[1] Planting more than 62 million trees, and waiting at least 10 years for them to grow. Avoiding annual electricity-related emissions from more than 300,000 homes.
 would be equivalent to:[1] Planting more than 62 million trees, and waiting at least 10 years for them to grow. Avoiding annual electricity-related emissions from more than 300,000 homes..")
38
Ecosystems – Nutrient Cycling Is there a way to obtain energy from the ecosystem without breaking, or altering these cycles?

39
Ecosystems – Nutrient Cycling Is there a way to obtain energy from the ecosystem without breaking, or altering these cycles? Yes!

40
Ecosystems – Nutrient Cycling Types of biomass that can be burned for electricity Grasses, such as Miscanthus (pictured), or switchgrass. Hybrid Poplar

41
Ecosystems – Nutrient Cycling Harvesting Hybrid Poplar The regrowth from the initial harvest is called coppice.

42
Ecosystems – Methane

43
Methane release 85% of methane 15% of methane Methane loss = energy loss Energy loss = smaller cows

44
Methane Production in Animals 0.4% 5% 11% 71%!!!! Presentation by Rand Davis and Lianne Henderson

45
Ecosystems – Methane – is it really a problem?

46
Prior to 1999 there was a strong relationship between change in atmospheric methane concentrations and the world ruminant populations. However, since 1999 this strong relation has disappeared. This change in relationship between the atmosphere and ruminant numbers suggests that the role of ruminants in greenhouse gases may be less significant than originally thought, with other sources and sinks playing a larger role in global methane accounting.

Similar presentations


 climate change is on a timescale of decades, an example would.>")


 Dissolved CO2 in aquatic.>")


