Download presentation
Presentation is loading. Please wait.

1
Low-Frequency Acoustic Gravity Waves Observed after t he 2004 Sumatra-Andaman Earthq uake Takeshi Mikumo (Kyoto University, Japan) Takuro Shibutani (DPRI,Kyo to University, Japan)
 Takuro Shibutani (DPRI,Kyo to University, Japan)")
2
Outlines 1.2004 Sumatra -Andaman Earthqu ak e (Mw= 9.2) ; Ground u plift and s ubsidence (Mw= 9.2) ; Ground u plift and s ubsidence 2.Microbarograph r ecords observed after the earth- quake quake 3. Waveform modeling for synthetic barograms 4. Comparison between the recorded and synthetic barograms 5. Summary and Preliminary Conclusions

3
1 Source Region of the 2004 Sumatra-Andaman Earthquake 1U,2U,3U,4U: Uplifted Zones 1D,2D,3D,4D: Subsided Zones

4
Provided by K. Satake

5
Arranged by K. Satake

6
Microbarograph stations that recorded infrasound waves from the 2004 Sumatra-Andaman earthquake

7
Acknowledgments We thank the following colleagues for providing us with the microbarograph data obtained at the respective stations. MAT(Matsushiro, Japan) T. Tsuyuki (Matsushiro Seismological Observatory, JAM, Japan) KAM(Kamioka, Japan) W. Morii (DPRI, Kyoto University, Japan) DGR (Diego Garcia) A. Le Pichon (CEA/DASE/LDG, France), M. Garces & D. Fee (University of Hawaii, USA) PAL (Palau) M. Garces & D. Fee (University of Hawaii, USA)
 T. Tsuyuki (Matsushiro Seismological Observatory, JAM, Japan) KAM(Kamioka, Japan) W. Morii (DPRI, Kyoto University, Japan) DGR (Diego Garcia) A. Le Pichon (CEA/DASE/LDG, France), M. Garces & D. Fee (University of Hawaii, USA) PAL (Palau) M. Garces & D. Fee (University of Hawaii, USA).")
8
Observed (de-trended) and Filtered Records at MAT (Matsushiro, Japan) 05:55 Dec.26 10Pa CH 12 CH 19 0 Observed Filtered
 and Filtered Records at MAT (Matsushiro, Japan) 05:55 Dec.26 10Pa CH 12 CH 19 0 Observed Filtered")
9
Observed (de-trended) and Filtered Records at KAM (kamioka, Japan) Fil ter e d Obse rved 5 Pa CH1 05:53 Dec.26
 and Filtered Records at KAM (kamioka, Japan) Fil ter e d Obse rved 5 Pa CH1 05:53 Dec.26")
10
Observed 0.5 Pa 1 Pa 03:36 Dec.26 I52H2 I52H6 Original and Filtered Records at DGR (Diego Garcia) Filtered
 Filtered")
11
Original and Filtered Records at PAL (Palau) Origi nal Fil ter ed 2 Pa 2 Pa IS39H2 IS39H5 05:03 Dec.26
 Origi nal Fil ter ed 2 Pa 2 Pa IS39H2 IS39H5 05:03 Dec.26")
12
Microbarograph Records at Alaska and California stations after the 1964 Alaskan earthquake (Mw=9.0) (Mikumo,1968)
 (Mikumo,1968)")
13
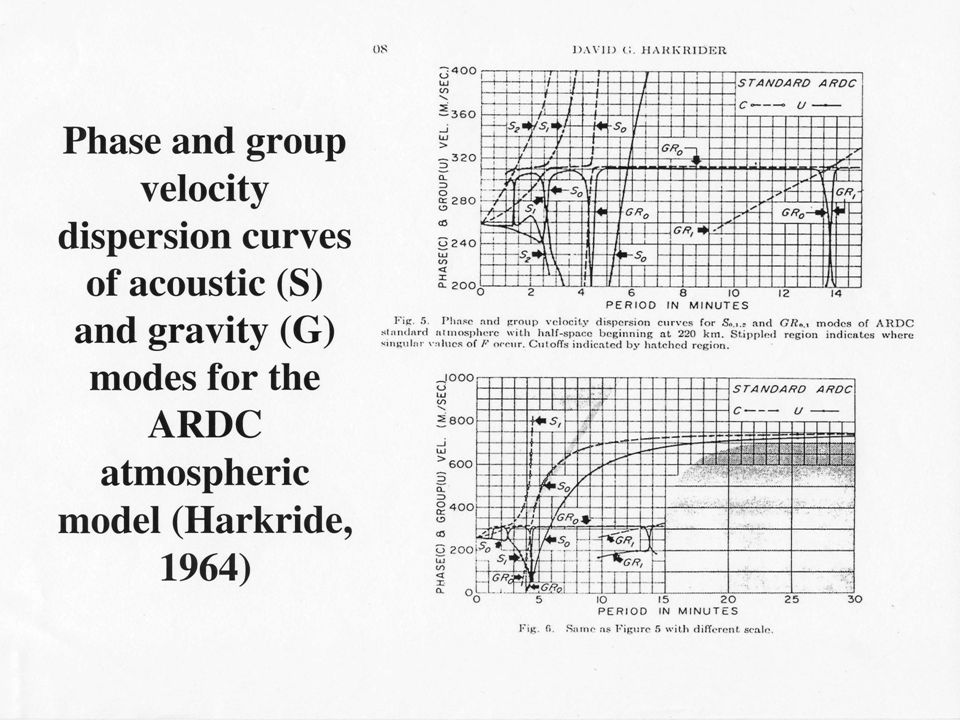
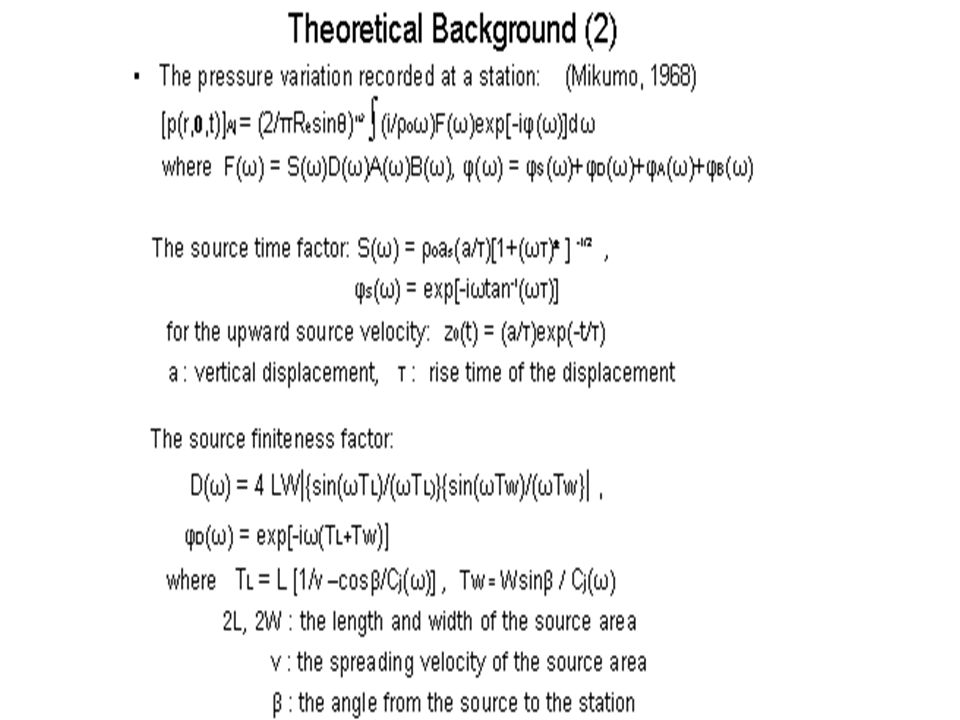
Waveform Modeling Procedures 1. Dynamic response of the lower atmosphere up to an altitude of 220 km ( the standard ARDC model) to a surface source and receiver: Spectral amplitude response Aj(ω) and phase velocity Spectral amplitude response Aj(ω) and phase velocity Cj(ω) for gravity and acoustic modes (j=1~4) Cj(ω) for gravity and acoustic modes (j=1~4) 2. Earthquake source parameters: 1) Source locations and dimensions of the uplifted and 1) Source locations and dimensions of the uplifted and subsided regions, Lj, Wj (j=1~8) subsided regions, Lj, Wj (j=1~8) 2) Source spreading velocity v r (rupture velocity on the fault) 2) Source spreading velocity v r (rupture velocity on the fault) 3) Average displacements Dj of uplift and subsidence 3) Average displacements Dj of uplift and subsidence (j=1~8) (j=1~8) 4) Rise time of the displacements τ 4) Rise time of the displacements τ
 to a surface source and receiver: Spectral amplitude response Aj(ω) and phase velocity Spectral amplitude response Aj(ω) and phase velocity Cj(ω) for gravity and acoustic modes (j=1~4) Cj(ω) for gravity and acoustic modes (j=1~4) 2. Earthquake source parameters: 1) Source locations and dimensions of the uplifted and 1) Source locations and dimensions of the uplifted and subsided regions, Lj, Wj (j=1~8) subsided regions, Lj, Wj (j=1~8) 2) Source spreading velocity v r (rupture velocity on the fault) 2) Source spreading velocity v r (rupture velocity on the fault) 3) Average displacements Dj of uplift and subsidence 3) Average displacements Dj of uplift and subsidence (j=1~8) (j=1~8) 4) Rise time of the displacements τ 4) Rise time of the displacements τ.")
18
Green’s functions for propagating gravity (GR0) and acoustic (S0 & S1) modes, from 2U with a point source and a step time function, to MAT GR 0 S0 S1 SUM
 and acoustic (S0 & S1) modes, from 2U with a point source and a step time function, to MAT GR 0 S0 S1 SUM")
20
Source Region of the 2004 Sumatra-Andaman Earthquake 1U,2U,3U,4U: Uplifted Zones 1D,2D,3D,4D: Subsided Zones

21
Synthetic Waveforms for MAT from Uplifted and Subsided Zones 4U4U 3U3U 2 U 1U1U 4D4D 3D 3D 2D2D 1D 1D X3. 5

22
Synthetic barograms for MAT with various displacements at 2U + 2D Uplift Displacement Dju / Subsidence Displacement Djd = 2 (assumed) D2u/Dju 1 2 3 3 4 6
 D2u/Dju")
23
Synthetic barograms for MAT with various rise times and rupture velocities Synthetics τ (sec) 60 18 3 Synthetics Vr (km/s) 2.5 2.0 1.7
 Synthetics Vr (km/s)")
24
Comparison between the recorded and synthetic barograms at MAT 10 Pa CH12 Obser ved Synthe tic 41

25
Comparison between the recorded and synthetic barograms (left), and between the filtered and synthetic barograms (right) at KAM Filte red Synthe tic 41 Obse rved Synthe tic 41 5 Pa
, and between the filtered and synthetic barograms (right) at KAM Filte red Synthe tic 41 Obse rved Synthe tic 41 5 Pa")
26
Frequency response of the barographs used at IMS stations (provided by Le Pichon, 2007)
")
27
Comparison between the filtered record and two different synthetic barograms at DGR I52H2 Filtered Synthetic 41 0.5 Pa Filtered I52H2 Synthetic 61

28
Comparison between the filtered record and synthetic barogram at PAL IS39H2 Filtered Synthetic 41 1 Pa

29
Summary 1. Very low-frequency (~0.0016 Hz) acoustic-gravity waves with a group velocity around 305~315 m/s can be identified on the records at a few high-sensitivity microbarograph stations including Matsushiro, Kamioka,Diego Garcia (IS52) and possibly Palau (IS39), (up to a maximum distance of ~5.500 km). 2. We attempt to model synthetic barogram waveform to the stations, on the basis of dynamic response of the lower atmosphere with the ARDC standard thermal structure up to an altitude of 220 km,taking into account seismic information. For this modeling, we incorporate the spreading velocity of the source region, the source dimensions of subdivided zones, the vertical displacement ofground and sea-surface uplift and subsidence and their rise times.
 acoustic-gravity waves with a group velocity around 305~315 m/s can be identified on the records at a few high-sensitivity microbarograph stations including Matsushiro, Kamioka,Diego Garcia (IS52) and possibly Palau (IS39), (up to a maximum distance of ~5.500 km). 2. We attempt to model synthetic barogram waveform to the stations, on the basis of dynamic response of the lower atmosphere with the ARDC standard thermal structure up to an altitude of 220 km,taking into account seismic information. For this modeling, we incorporate the spreading velocity of the source region, the source dimensions of subdivided zones, the vertical displacement ofground and sea-surface uplift and subsidence and their rise times..")
30
Preliminary Conclusions Preliminary Conclusions 1. Some combinations of these source parameters provide the synthetic waveforms well consistent with the general the synthetic waveforms well consistent with the general features of the observed low-frequency records. features of the observed low-frequency records. 2. The results suggest that the uplift in the south-central Nicobar region may be more than a few times larger than that in the other regions, and also that the northern half of the entire region Nicobar region may be more than a few times larger than that in the other regions, and also that the northern half of the entire region appears to contribute only a small portion to the generation of the observed acoustic-gravity waves. appears to contribute only a small portion to the generation of the observed acoustic-gravity waves. 3. The time constant for generating these waves may be shorter than a few minutes, as in the case of the 1964 shorter than a few minutes, as in the case of the 1964 Alaskan earthquake (Mw=9.0) Alaskan earthquake (Mw=9.0)
 Alaskan earthquake (Mw=9.0).")
31
Estimated uplift and subsidence in two zones (Bilham et al., 2003)
")
32
Uplift and subsidence measured from field surveys on the Andaman to Sumatra islands in the Indian Ocean (Metzler et al., 2005)
")
33
1964 Alaskan Earthquake

34
Comparison between the recorded and synthetic barograms at Berkeley, California (Mikumo,1968)
")
Similar presentations


, P. Papadimitriou (1), K. Makropoulos.>")


 What is Moment Magnitude?>")

>")


