Download presentation
Presentation is loading. Please wait.

1
CENSUS 2011: XLSX Spreadsheet and KZN Spatial Viewer JENNY BARNARD DIS COGTA SEPTEMBER 2013

2
OVERVIEW: MARCH 2013 Census 2011 Spreadsheet KZN Spatial Viewer 2012/13: Census data on backlogs, population, income, councillors, age, dwelling type, employment, low income levels. Infrastructure footprints (DWA, Eskom) Projects Boundaries, roads, rivers, locational data, satellite imagery, etc
 Projects Boundaries, roads, rivers, locational data, satellite imagery, etc.")
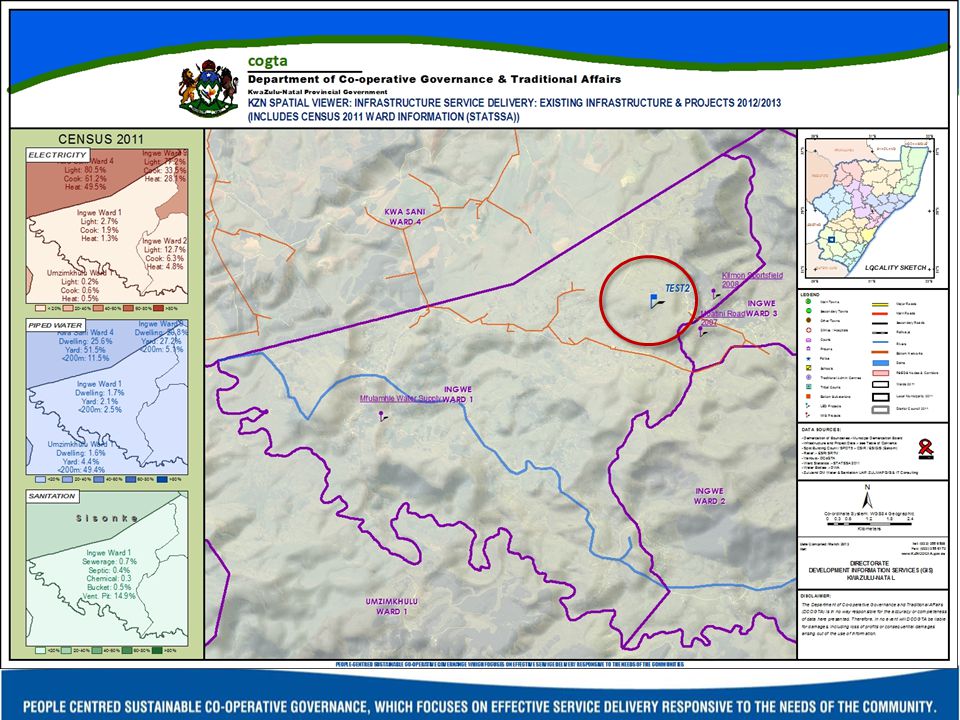
3
CENSUS 2011 SPREADSHEET

10
KZN SPATIAL VIEWER 2012/13: Census data on backlogs, population, income, Councillors (2011), age, dwelling type, employment, low income levels. Infrastructure footprints (DWA, Eskom) Projects Boundaries, roads, rivers, location data, satellite imagery, etc
 Projects Boundaries, roads, rivers, location data, satellite imagery, etc.")
13
ADD XY POINTS: ARCREADER Click with the “i” button (identify) Copy and paste to the User_Projects sheet in Projects.xls Save Projects.xls and refresh ArcReader
 Copy and paste to the User_Projects sheet in Projects.xls Save Projects.xls and refresh ArcReader")
15
2013/14 June: Provincial September: Local Municipalities December: Wards / Sub Places with updated infrastructure and project information

16
2013/14 June: Provincial September: Municipalities December: Wards / Subplaces with updated infrastructure and project information

17
2013/14 June: Provincial September: Municipalities December: Wards / Subplaces with updated infrastructure and project information

18
2013/14 June: Provincial September: Municipalities December: Wards / Subplaces with updated infrastructure and project information INGWE WARD 1 2011: 2.7% electrified 2012: 34.1% electrified

19
Thank you CONTACT DETAILS: Jenny Barnard: jennybarnard157@gmail.comjennybarnard157@gmail.com Dumisani Khumalo: Dumisani.Khumalo@kzncogta.gov.zaDumisani.Khumalo@kzncogta.gov.za

Similar presentations