Download presentation
Presentation is loading. Please wait.

1
The Educational Imperative: What Do We Know about Student Achievement? OVAE: American's Career Resource Network (ACRN) National Training Conference Alexandria, Virginia, March 17, 2004 Craig Jerald, Education Trust
 National Training Conference Alexandria, Virginia, March 17, 2004 Craig Jerald, Education Trust.")
2
12th Grade Achievement In Math and Science is Up Somewhat

3
High School Achievement: Math and Science: NAEP Long-Term Trends Source: NAEP 1999 Trends in Academic Progress.

4
In Reading, 12th Grade Achievement is Headed Downward

5
HIGH SCHOOL ACHIEVEMENT: READING AND WRITING NAEP Long-Term Trends

6
What about different groups of students? During seventies and eighties, much progress.

7
Gaps Narrow 1970-88 NAEP Reading 17 Year-Olds Source: US Department of Education, National Center for Education Statistics. NAEP 1999 Trends in Academic Progress (p. 107) Washington, DC: US Department of Education, August 2000
 Washington, DC: US Department of Education, August")
8
Gaps Narrow 1973-86 NAEP Math Scores, 13 Year-Olds Source: US Department of Education, National Center for Education Statistics. NAEP 1999 Trends in Academic Progress (p. 108) Washington, DC: US Department of Education, August 2000
 Washington, DC: US Department of Education, August")
9
Between 1988-90, that progress came to a halt…and gaps began to widen once again.

10
Source: US Department of Education, National Center for Education Statistics. NAEP 1999 Trends in Academic Progress (p. 108) Washington, DC: US Department of Education, August 2000 Gaps Narrow, Then Hold Steady or Widen: NAEP Math Scores, 17 Year-Olds 20 32
 Washington, DC: US Department of Education, August 2000 Gaps Narrow, Then Hold Steady or Widen: NAEP Math Scores, 17 Year-Olds")
11
After 1988, Gaps Mostly Widen NAEP Reading, 17 Year-Olds Source: US Department of Education, National Center for Education Statistics. NAEP 1999 Trends in Academic Progress (p. 107) Washington, DC: US Department of Education, August 2000 21 31
 Washington, DC: US Department of Education, August")
12
How much learning takes place at each level?

13
Students Make More Growth Grades 5 to 8 than Grades 9 to 12

14
Academic Growth Grades 4-8, 8-12

15
Value Added in High School Declined During the Nineties

16
Value Added Declining in High School Math... Age 13-17 Growth Source: NAEP 1999 Trends in Academic Progress

17
…Still Age 13-17 Growth Source: Main NAEP 1996, 2000

18
Reading: Students Entering Better Prepared, But Leaving Worse Source: NAEP 1996 Trends in Academic Progress

19
Reading Growth From Grade 9 and 12 Still Declining: Main NAEP

20
Hormones?

21
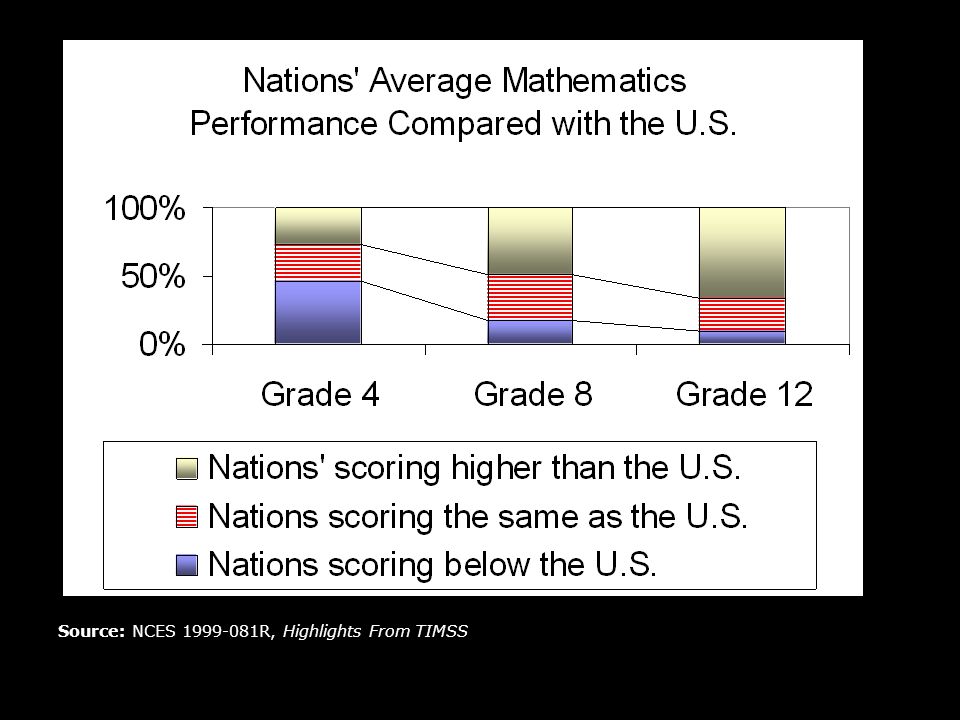
Students in Other Countries Gain far More in Middle and High School

22
TIMSS

23
Source: NCES 1999-081R, Highlights From TIMSS

25
PISA

26
US 15 Year-Olds Rank Near Middle Of The Pack Among 32 Participating Countries

27
One measure on which we rank high? Inequality!

28
Source: OECD, Knowledge and Skills for Life: First Results From PISA 2000, 2001. *Of 27 OECD countries Performance Of U.S. 15 Year-Olds Highly Variable

29
Where are we now?

30
NAEP Mathematics Performance 2000

31
By Race, Ethnicity: NAEP 12th Grade Math 2000 Source: USDOE, NCES, National Assessment of Educational Progress (NAEP)
")
32
By Income: 12th Grade Math (2000) Source: USDOE, NCES, National Assessment of Educational Progress (NAEP) Summary Data Tables
 Source: USDOE, NCES, National Assessment of Educational Progress (NAEP) Summary Data Tables")
33
By Race, Ethnicity NAEP 12th Grade Reading 2002 Source: USDOE, NCES, National Assessment of Educational Progress (NAEP)
")
34
By Income 12th Grade Reading (2002) Source: USDOE, NCES, National Assessment of Educational Progress (NAEP) Summary Data Tables
 Source: USDOE, NCES, National Assessment of Educational Progress (NAEP) Summary Data Tables")
35
African American and Latino 17 Year Olds Do Math at Same Levels As White 13 Year Olds Source: NAEP 1999 Long Term Trends Summary Tables (online)
")
36
African American and Latino 17 Year Olds Read at Same Levels as White 13 Year Olds Source: Source: NAEP 1999 Long Term Trends Summary Tables (online)
")
37
Too Few 17 Year-Olds Demonstrate Strong Reading Skills Source: USDOE, NCES, 1999 NAEP Summary Data Tables

38
Too Few 17 Year-Olds Demonstrate Strong Math Skills Source: USDOE, NCES, 1999 NAEP Summary Data Tables

39
These patterns are reflected, too, in high school completion, college entry and college graduation rates.

40
Students Complete High School At Different Rates, 2000 Source: US Bureau of Census, Current Population Reports, Educational Attainment in the United States: March 2000, Detailed Tables No. 2 Age 18-24

41
On Time Completion of Regular H.S. Diploma, 2001 Source: Manhattan Institute, Public High School Graduation and College Readiness Rates in the United States.

42
More and more students going on to college Source: The Condition of Education 2003.

43
Most high school grads go on to postsecondary within 2 years Source: NELS: 88, Second (1992) and Third (1994) Follow up; in, USDOE, NCES, “Access to Postsecondary Education for the 1992 High School Graduates,” 1998, Table 2.
 and Third (1994) Follow up; in, USDOE, NCES, Access to Postsecondary Education for the 1992 High School Graduates, 1998, Table 2.")
44
Half of Low Achieving Grads Go On To Postsecondary Source: NELS: 88, Second (1992) and Third Follow up (1994); in, USDOE, NCES, Condition of Education 1997, p. 64

45
What happens when they get there?

46
Unfortunately, when these new freshmen arrive in college, many must take remedial (high-school) level courses Source: National Center for Public Policy and Higher Education,
 level courses Source: National Center for Public Policy and Higher Education,")
47
Do they get caught up?

48
Students Requiring Extensive Remediation Graduate at Lower Rates Source: Adelman, Cliff in Crosstalk, Vol 6, No 3, Summer 1998.

49
College Freshmen Not Returning for Sophomore Year Source: Tom Mortensen, Postsecondary Opportunity, No. 89, November 1999

50
African American and Latino Freshmen Complete College at Lower Rates Source: Adapted from Adelman, Clifford, U.S. Department of Education, “Answers in the Toolbox,” 1999.

51
ADD IT ALL UP...

52
Of Every 100 White Kindergartners: (25-to 29-Year-Olds) Source: US Department of Commerce, Bureau of the Census. March Current Population Surveys, 1971-2001, in The Condition of Education 2002.

53
Of Every 100 African American Kindergartners: (25-to 29-Year-Olds) Source: US Department of Commerce, Bureau of the Census. March Current Population Survey, 1971-2001, In The Condition of Education 2002.

54
Of Every 100 Latino Kindergartners : (25-to 29-Year-Olds) Source: US Department of Commerce, Bureau of the Census. March Current Population Surveys, 1971-2001, In The condition of Education 2002.

55
Of Every 100 American Indian/Alaskan Native Kindergartners: (24 Year Olds)
")
56
College Graduates by Age 26 Source: Tom Mortenson, Research Seminar on Public Policy Analysis of Opportunity for Post Secondary, 1997.

57
WHY?

58
What We Hear Adults Say: They’re poor; Their parents don’t care; They come to schools without breakfast; Not enough books Not enough parents...

59
But if they’re right, then why are poor and minority children performing so high in...

60
Some schools...

61
Hambrick Middle School, Aldine, TX 94% African American and Latino (state = 56%) 85% low-income (state = 50%) Has performed in the top fifth of all Texas middle schools in both reading and math in both 7 th and 8 th grades over a 3-year period.
 85% low-income (state = 50%) Has performed in the top fifth of all Texas middle schools in both reading and math in both 7 th and 8 th grades over a 3-year period.")
62
Inman Middle School, Atlanta, GA 60% Low Income 60% African American and Latino –(58% African American and 2% Latino) Outperformed about 95% of other GA schools on average* in both 2001 and 2002. Over 90% of 6 th graders, 7 th graders, and 8 th graders met state standard in reading in 2002. Source: The Education Trust, Dispelling the Myth Online. *Composite measure averaging across grades and subject areas tested.

63
Johnson County Middle School, Kentucky 95% Low Income Outperformed 2/3 of other Kentucky middle schools in both math and reading for three years in a row (2000- 2002). In 2002, performed better than about 90% of all KY middle schools in both math and reading. Source: The Education Trust, Dispelling the Myth Online. Based on scale score in KY CATS assessment system.

64
Prince Edward County High, Farmville VA Sources: Virginia Department of Education Web site, http://www.pen.k12.va.us/VDOE/Assessment/2002SOLpassrates.html.http://www.pen.k12.va.us/VDOE/Assessment/2002SOLpassrates.html (715 students – 55% African American and Latino)
")
65
Ramsay High School Birmingham, Alabama Total Enrollment - 687 90% African American 2% Asian 4% Latino 4% White 34 % Low Income Student achievement in top 10 percent of state for three consecutive years Source: Alabama State Department of Education www.alsde.eduwww.alsde.edu * Reflects Enrollment on First Day of Testing

66
High Performance at Ramsay High 2003 Math Alabama High School Graduation Exam Source: Alabama State Department of Education – Accountability Reporting Systemwww.alsde.edu/Accountability

67
Source: Education Trust analysis of data from National School-Level State Assessment Score Database (www.schooldata.org).www.schooldata.org

68
Source: Education Trust analysis of data from National School-Level State Assessment Score Database (www.schooldata.org).www.schooldata.org

69
Source: Education Trust analysis of data from National School-Level State Assessment Score Database (www.schooldata.org).www.schooldata.org

70
MA: Passing HS Competency Exam Source: Massachusetts Department of Education Web site.

71
MA: Narrowing the High School Competency Gap Source: Massachusetts Department of Education Web site.

72
MA: Narrowing the High School Competency Gap Source: Massachusetts Department of Education Web site.

73
MA: Narrowing the High School Competency Gap Source: Massachusetts Department of Education Web site.

74
SOURCE: U.S. Department of Education, Institute of Education Sciences, National Center for Education Statistics, National Assessment of Educational Progress (NAEP)
.")
76
What Students Say: Yes, some blame themselves. But they also say... some teachers don’t know their subjects; counselors underestimate our potential; principals dismiss concerns; expectations wretchedly, boringly low.

77
SO, WHAT CAN WE DO? A Few Things Worth Thinking About

78
#1. Can we agree on a single, overarching goal for high school that will give clearer purpose, focus to our reform efforts?

79
Both professors and employers have similar worries Most employers and professors question whether high school graduates have the knowledge and skills required on the job or in the college classroom. Percentage of employers and professors rating graduates’ skills as “fair” or “poor”

80
Consequences serious both for students and for taxpayers In a single state, employers and postsecondary education institutions spend an estimated $134.3 million a year on remedial education. Estimated annual spending on remedial education in Michigan

81
Source: US bureau of Labor Statistics and Bureau of the Census, Current Population Survey, March 2002 Education Pays: Annual Earnings of 25-34 yr-olds by Attainment, 2001

82
Expectations Differ: Plans For Students After High School Source: “Metropolitan Life, Survey of the American Teacher 2000: Are We Preparing Students for the 21st Century?,” September 2000.

83
Clearly, we’ve got a problem Students are following all the rules; Meeting all of the requirements for the diploma; and Falling in the cracks between high school and the expectations of postsecondary institutions.

84
To break through these old attitudes, cannot equivocate. ALL students must graduate from high school ready for postsecondary education.

85
#2. It is increasingly clear that student success--in college, on assessments, and in gaining access to good jobs-- depends on completing a rigorous, college prep-level curriculum.

86
Transcript Study: single biggest predictor of college success is QUALITY AND INTENSITY OF HIGH SCHOOL CURRICULUM Cliff Adelman, Answers in the Tool Box, U.S. Department of Education.

87
Better alignment has major benefits: A strong h.s. curriculum* improves college completion and narrows gaps *Completing at least “Algebra II” plus other courses. Source: Adapted from Adelman, Clifford, U.S. Department of Education, Answers in the Toolbox, 1999. 28% 11%

88
But college prep curriculum has benefits far beyond college.

89
Students of all sorts will learn more...

90
Source: USDOE, NCES, Vocational Education in the United States: Toward the Year 2000, in Issue Brief: Students Who Prepare for College and Vocation *Grade 8-grade 12 test score gains based on 8th grade achievement. Low Quartile Students Gain More From College Prep Courses*

91
They will also fail less often...

92
Challenging Curriculum Results in Lower Failure Rates, Even for Lowest Achievers Source: SREB, “Middle Grades to High School: Mending a Weak Link”. Unpublished Draft, 2002. Ninth-grade English performance, by high/low level course, and eighth-grade reading achievement quartiles

93
And they’ll be better prepared for the workplace.

94
Take Manufacturing, for example…

95
Requirements for Tool and Die Makers Four or five years of apprenticeship and/or postsecondary training; Algebra, geometry, trigonometry and statistics; Average earnings: $40,000 per year.

96
Requirements for Sheet Metal Workers Four or five years of apprenticeship; Algebra, geometry, trigonometry and technical reading;

97
African American and Latino Students Less Likely to Complete Advanced Math and Science Courses Source: U.S. Department of Education, NCES, Condition of Education 2002, p 86. Data from 1998 NAEP High School Transcript Study.

98
African American, Latino & Native American youth are less likely to be enrolled in full college prep track percent in college prep SOURCE: Jay P. Greene, Public High School Graduation and College Readiness Rates in the United States, Manhattan Institute, September 2003. Table 8. 2001 high school graduates with college-prep curriculum.

99
“But,” we hear, “isn’t it also a matter of ambition?”

100
Advanced Math Classes: Minority Interest Far Exceeds Availability Source: National Action Council for Minorities in Engineering, Progress Toward Power: A Follow-Up Survey of Children’s and Parents’ Attitudes About Math and Science. Research Letter, October 2001. Survey conducted by Harris Interactive, 1999. 8 29

101
Who’s Discouraging Students from Taking Advanced Math? Source: National Action Council for Minorities in Engineering, Progress Toward Power: A Follow-Up Survey of Children’s and Parents’ Attitudes About Math and Science. Research Letter, October 2001. Survey conducted by Harris Interactive, 1999..

102
Why Kids Drop Out “Students mainly consider dropping out because they are not engaged by the school. Students are most likely to cite the following reasons for considering dropping out: School was boring (76%); and They were not learning enough (42%).” Source: Metropolitan Life, Survey of the American Teacher 2002: Student Life: School, Home and Community, p. 9.
; and They were not learning enough (42%). Source: Metropolitan Life, Survey of the American Teacher 2002: Student Life: School, Home and Community, p. 9..")
103
Leading districts, states making college prep the default curriculum.

104
BUT… it is clear from the NAEP data that we’re not getting the gains from those courses we should expect; and, it is also clear that course labels don’t always tell much about standards.

105
Historically, most of the really important decisions about what students should learn and what kind of work was “good enough” left to individual teachers.

106
Result? A System That: Doesn’t expect very much from MOST students; and, Expects much less from some types of students than others.

107
14 SC High Schools Calibrated: Gaps Between Standards and Assignments Largest in Upper Grades

108
Texas Algebra I Course Performance vs. End-of-Course Test Performance Source: Texas Education Agency, Texas Student Assessment Program Student Performance Results, 1999-2000, Section VI: A Study of the Correlation between Course Performance in Algebra I and Algebra I End-of-Course Test Performance.

109
Texas Algebra I Course Performance vs. End-of-Course Test Performance Source: Texas Education Agency, Texas Student Assessment Program Student Performance Results, 1999-2000, Section VI: A Study of the Correlation between Course performance in Algebra I and Algebra I End-of-Course Test Performance.

110
Students can do no better than the assignments they are given...

111
Grade 10 Writing Assignment A frequent theme in literature is the conflict between the individual and society. From literature you have read, select a character who struggled with society. In a well-developed essay, identify the character and explain why this character’s conflict with society is important.

112
Grade 10 Writing Assignment Write a composition of at least 4 paragraphs on Martin Luther King’s most important contribution to this society. Illustrate your work with a neat cover page. Neatness counts.

113
High Performing Schools and Districts Have clear and specific goals for what students should learn in every grade, including the order in which they should learn it; Provide teachers with common curriculum, assignments; Create vehicles to work toward consistent understandings of “good enough”; Assess students every 4-8 weeks to measure progress; ACT immediately on the results of those assessments.

114
#3. Organizing Time and Staff in Pursuit of Different Outcomes

115
Poor and Minority Students Get More Inexperienced* Teachers *Teachers with 3 or fewer years of experience. “High” and “low” refer to top and bottom quartiles. Source: National Center for Education Statistics, “Monitoring Quality: An Indicators Report,” December 2000.

116
High-Poverty Schools Get More Low- Scoring* Teachers *Teachers scoring in the bottom quartile on on SAT/ACT. “High-poverty” schools have 2/3 or more students eligible for reduced-price lunch. Source: Education Week, “Quality Counts 2001,” January 2001.

117
More Classes in High-Poverty, High-Minority Schools Taught by Out-of-Field* Teachers *Teachers lacking a college major or minor in the field. Data for secondary-level core academic classes. Source: Richard M. Ingersoll, University of Pennsylvania. Original analysis for the Ed Trust of 1999-2000 Schools and Staffing Survey.

118
African American Students More Likely To Have Ineffective Teachers: Tennessee Source: Sanders, William L. and Rivers, June C. “Cumulative And Residual Effects of Teachers on Future Student Academic Achievement,” 1996

119
Even Within Schools, Often Big Differences

120
Turn Around This Pattern: UPDRAFT for ALL Students?

121
“By our estimates from Texas schools, having an above average teacher for five years running can completely close the average gap between low- income students and others.” John Kain and Eric Hanushek

122
The Education Trust For More Information... www.edtrust.org Washington, DC: 202-293-1217 Oakland, CA: 510-465-6444

Similar presentations