Download presentation
Presentation is loading. Please wait.

1
Image Aided Discrete Element Modeling (DEM) for Railroad Ballast By Erol Tutumluer Hai Huang Youssef Hashash Jamshid Ghaboussi Association of American Railroads
 for Railroad Ballast By Erol Tutumluer Hai Huang Youssef Hashash Jamshid Ghaboussi Association of American Railroads")
2
Outline BackgroundBackground Problem Statement Current Railroad Track Analysis Approach –Finite Element (FEM) –Discrete Element (DEM) »DEM Theory »Discrete Element Modeling for Railroad Track Analysis Image Aided DEM ApproachImage Aided DEM Approach – Research in University of Illinois Digitalized Image Technique for Aggregates Image Aided DEM Approach Approach Validation Applications on Railroad Ballast –Ballast Strength in terms of Aggregate Shapes –Ballast Settlement under Moving Load Conclusions and Future WorkConclusions and Future Work AcknowledgementAcknowledgement
 –Discrete Element (DEM) »DEM Theory »Discrete Element Modeling for Railroad Track Analysis Image Aided DEM ApproachImage Aided DEM Approach – Research in University of Illinois Digitalized Image Technique for Aggregates Image Aided DEM Approach Approach Validation Applications on Railroad Ballast –Ballast Strength in terms of Aggregate Shapes –Ballast Settlement under Moving Load Conclusions and Future WorkConclusions and Future Work AcknowledgementAcknowledgement")
3
Problem Statement A large portion of a railroad company’s annual budget to sustain the railway track system goes into maintenance and renewal of track ballastA large portion of a railroad company’s annual budget to sustain the railway track system goes into maintenance and renewal of track ballast A better basic understanding of the ballast behavior is essential for mitigating track problems and failures due to: Ballast movement and instability causing track buckle Ballast deformation and degradation Factors affecting ballast strength and stability includes: ballast aggregate gradation, aggregate shape properties, and loading characters A more realistic computational tool is needed to consider all factors which may have impact on ballastA more realistic computational tool is needed to consider all factors which may have impact on ballast

4
Current Railroad Track Analysis Approach : - Finite Element Finite element based numerical solution techniques used for the analysis of railroad tracks assume the railroad ballast bed to be an elastic homogeneous continuum ILLI-TRACK and GEO-TRACK

5
Longitudinal & Transverse 2-D Finite Element Meshes – IILI-TRACK Current Railroad Track Analysis Approach : - Finite Element

6
3-D Finite Element Model – GEO – TRACK Continuum Solution: Elastic Layers, E and Unbound Aggregate Layers “Track Geotechnology and Track Management,” 2000, by Ernest T. Selig and John M. Waters

7
Railroad ballast layers are actually particulate media where individual aggregate particles are surrounded by other particles in contact with air voids in between When ballast is strained due to rail buckle and train wheels, motion takes place that may involve one or all of the following modes: Inter-particle slippage, Particle rotation, particle separation, and Even fracture at particle contacts Current Railroad Track Analysis Approach : - Discrete Element

8
Discontinuous Ballast Layer √ × Discrete Element Analysis Continuum Analysis Current Railroad Track Analysis Approach : - Discrete Element

9
DEM Theory: A DEM model simulates the mechanical response of a particulate medium by explicitly accounting for the dynamics of each particle in the system F1F1 F1F1 F2F2 F2F2 F3F3 F3F3 F4F4 F4F4 F5F5 F5F5 F6F6 F6F6 Current Railroad Track Analysis Approach : - Discrete Element

10
The interaction forces between two particles are represented by a damped spring in the normal direction and a spring in series with a frictional slider in the tangential (shear) direction DEM Theory: Fs Fn A B F F F Current Railroad Track Analysis Approach : - Discrete Element
 direction DEM Theory: Fs Fn A B F F F Current Railroad Track Analysis Approach : - Discrete Element")
11
The acceleration forces of each particle is computed by dividing the net force caused by interactions among neighboring particles Having found the acceleration, the particles velocity and displacement are computed for each time step using explicit integration Newton’s laws of motion DEM Theory: Current Railroad Track Analysis Approach : - Discrete Element

12
Current DEM Research (3D): Research, using ITASCA’s “PFC3D” to model the ballast-geogrid interlock effect, is currently underway Current Railroad Track Analysis Approach : - Discrete Element
: Research, using ITASCA’s PFC3D to model the ballast-geogrid interlock effect, is currently underway Current Railroad Track Analysis Approach : - Discrete Element")
13
Current DEM Research (3D): Tie was modeled by several big balls in the upper layer. Colors represent gradation. Ballast and geogrid system. (UK) Current Railroad Track Analysis Approach : - Discrete Element
 Current Railroad Track Analysis Approach : - Discrete Element.")
14
Can only use spherical particles to model aggregate Particle rotation becomes dominant in contact between particles due to the spherical shape Calculation time is relatively long PLUS Current Railroad Track Analysis Approach : - Discrete Element

15
AREMA (2000) requires ballast material to be angular particles with sharp corners and cubic fragments with a minimum of flat and elongated pieces. Visual Inspection cause error and fairly low reliable result. Uncompacted Voids method is time and labor intensive, subjective, and has inter-lab variability and low repeatability. SOLUTION? ------- Image-DEM Approach Current Railroad Track Analysis Approach : - Discrete Element

16
Flat & Elongated (F&E) Ratio - ASTM D 4791 F&E ratio = Maximum to minimum dimensionF&E ratio = Maximum to minimum dimension –5:1 –3:1 –2:1 IntermediateMaximum Minimum AREMA specs require maximum 5% by weight over 3:1 ratio Digitalized Image Technique for Aggregates
 Ratio - ASTM D 4791 F&E ratio = Maximum to minimum dimensionF&E ratio = Maximum to minimum dimension –5:1 –3:1 –2:1 IntermediateMaximum Minimum AREMA specs require maximum 5% by weight over 3:1 ratio Digitalized Image Technique for Aggregates")
17
n = 1 2 3 n 4 a1a1 a2a2 a3a3 0% Crushed 100% with 2 or More Crushed Faces Crushed Faces 0 100200300400500 Angularity Index (degrees) 40 41 42 43 44 45 46 47 Crushed Stone Gravel 50-50 Blend AREMA specs require ballast aggregates to be angular particles with sharp corners and cubical fragments Digitalized Image Technique for Aggregates
 Crushed Stone Gravel Blend AREMA specs require ballast aggregates to be angular particles with sharp corners and cubical fragments Digitalized Image Technique for Aggregates")
18
University of Illinois Aggregate Image Analyzer - UIAIA Conveyor speed of 3 in./second Particles placed 10 in. apart Images captured within 0.1 second in succession Progressive Scan Video Camera

19
Angularity: 570 Angularity: 570 F&E Ratio: 1:1 F&E Ratio: 1:1 Top, front, and side images Top, front, and side images of an aggregate particle of an aggregate particle Image Aided DEM Approach

20
Library 2 AI = 570 F&E = 1:1 Library 1 AI = 630 F&E = 1:1 Library 3 AI = 448 F&E = 1:1 Library 4 AI = 390 F&E = 1:1 Library 6 AI = 570 F&E = 3 :1 Library 5 AI = 620 F&E = 3 :1 Library 7 AI = 454 F&E = 3 :1 Library 8 AI = 347 F&E = 3 :1 Library 10 AI = 490 F&E = 5 :1 Library 11 AI = 360 F&E = 5 :1 Library 9 AI = 573 F&E = 5 :1 Three orthogonal views of a single aggregate particle obtained using University of Illinois Aggregate Image Analyzer to construct 3D Shape libraries for DEM F&E: 1:1 F&E: 3:1 F&E: 5:1 Image Aided DEM Approach

21
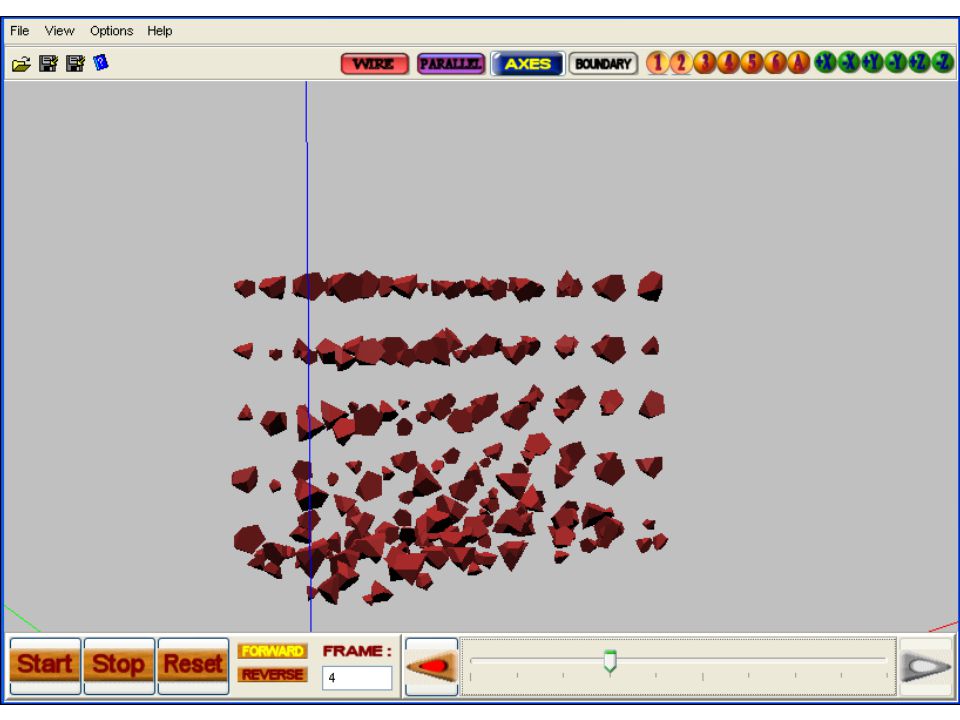
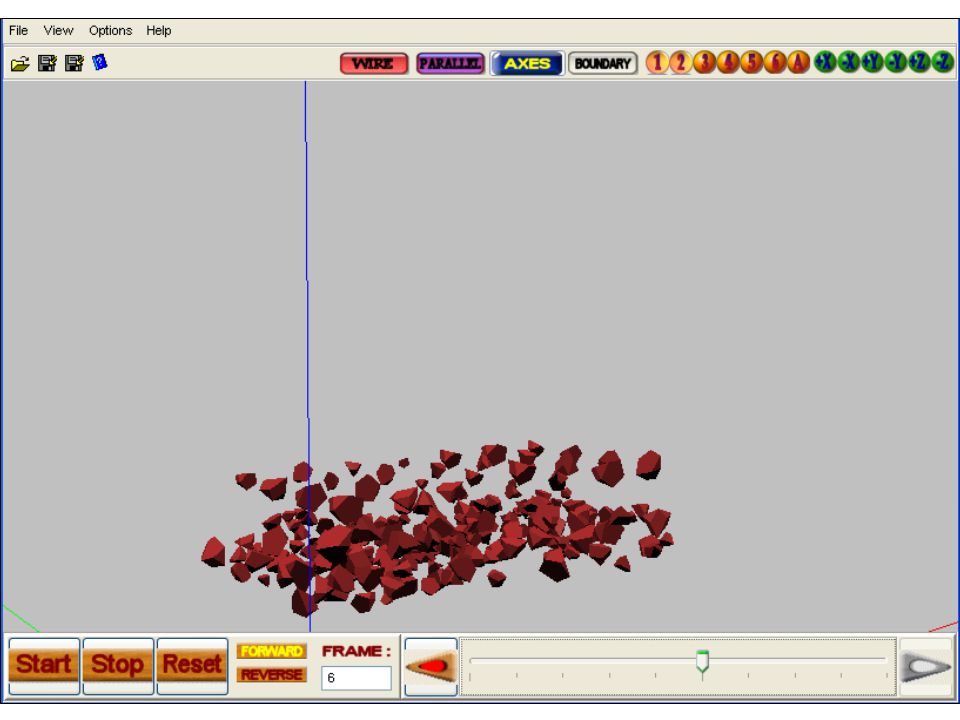
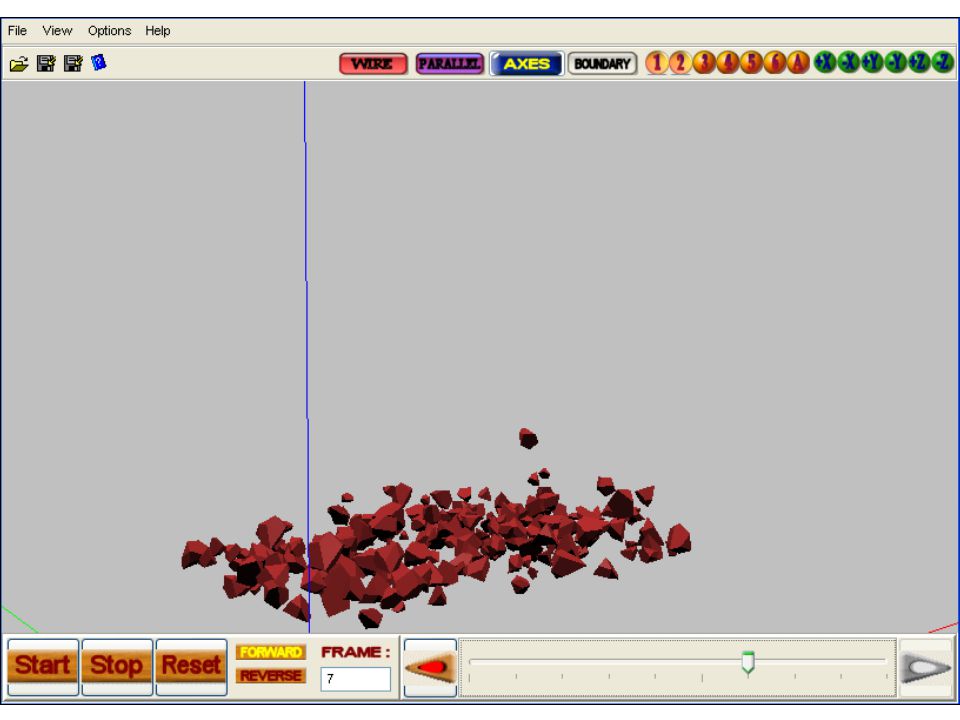
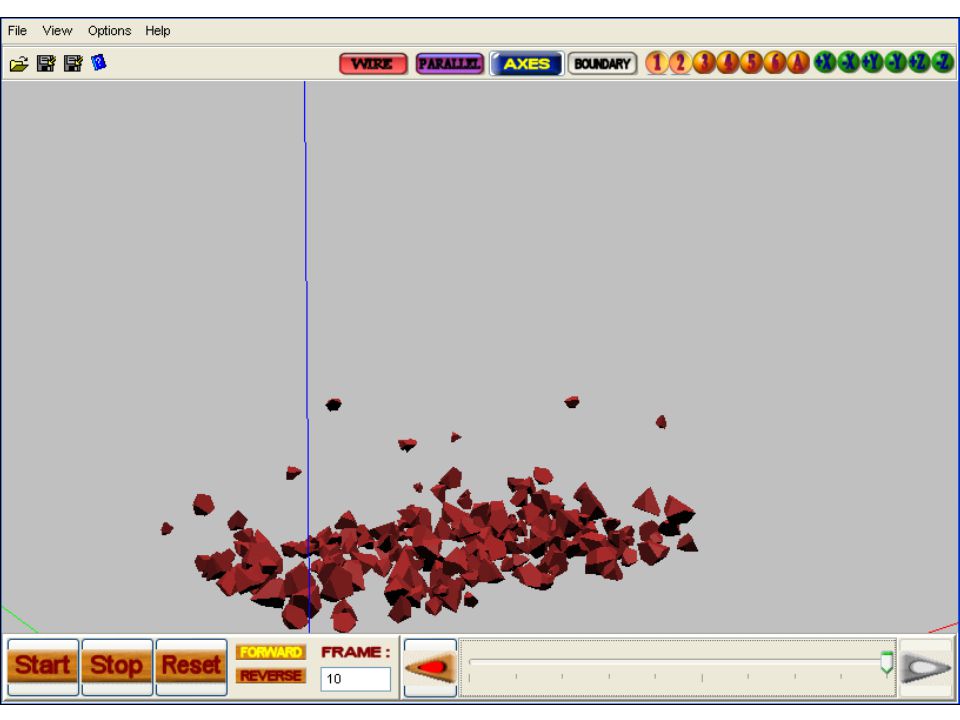
Some applications of Image Aided DEM Approach 1.Drop Particles 2.Compaction 3.Tamping Image Aided DEM Approach

109
Tie Pull-out Test Results – Before & After Tamping F&E = 1:1 AI: 630-390 F&E = 3:1 AI: 620-347 F&E = 5:1 AI: 573-360

110
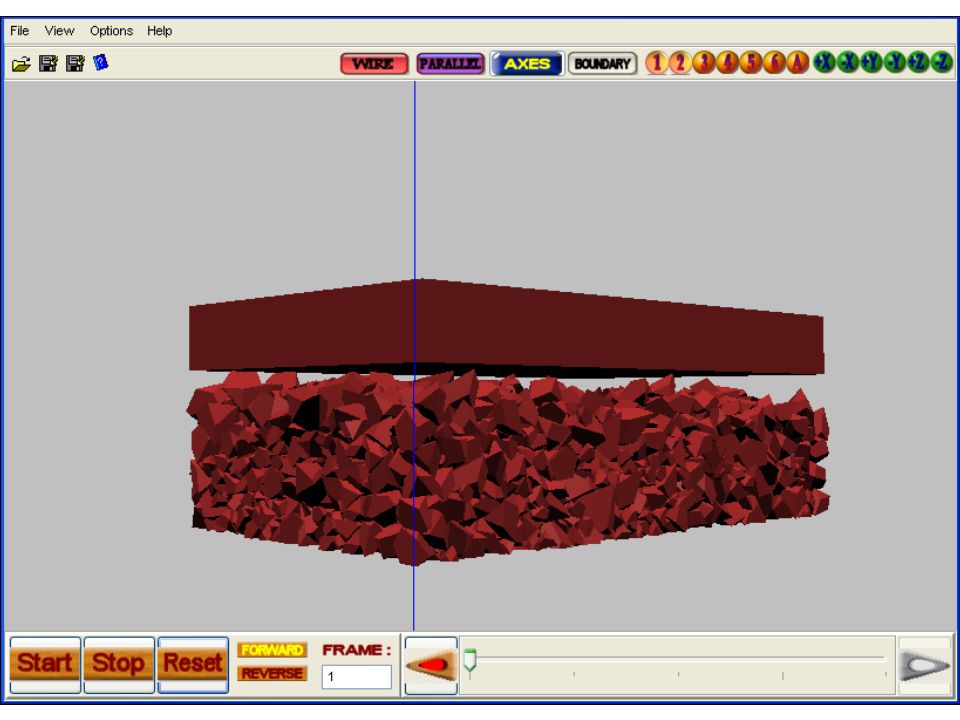
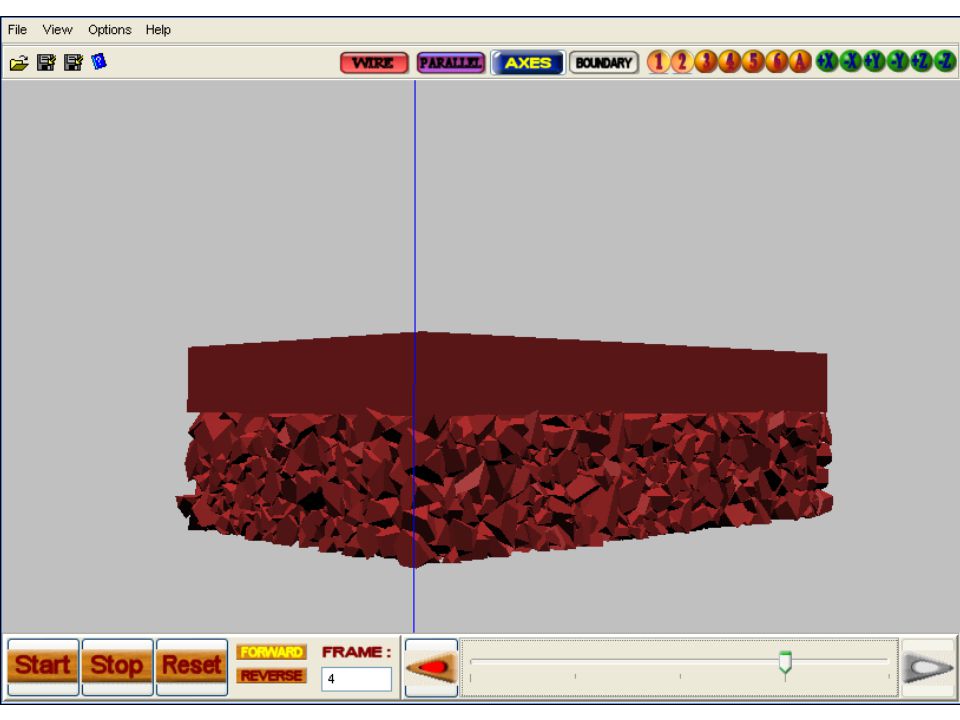
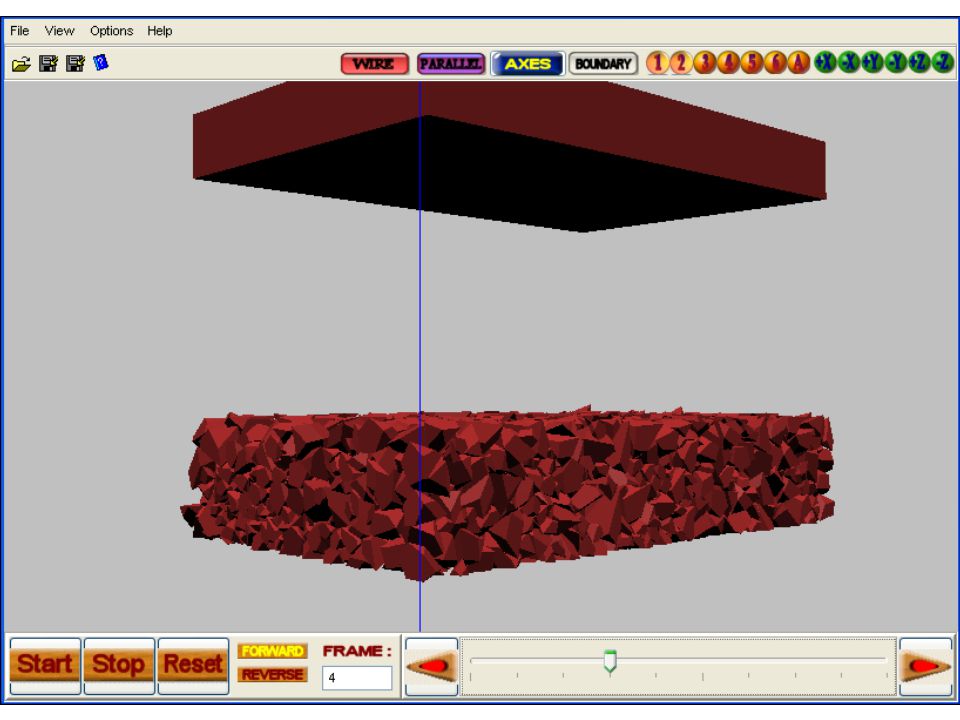
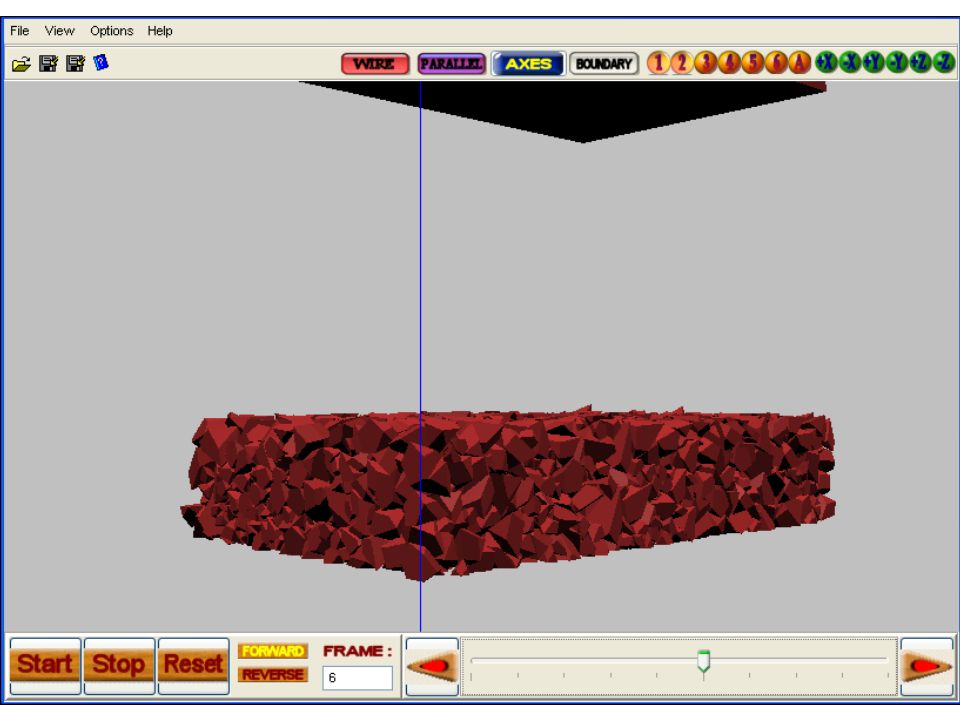
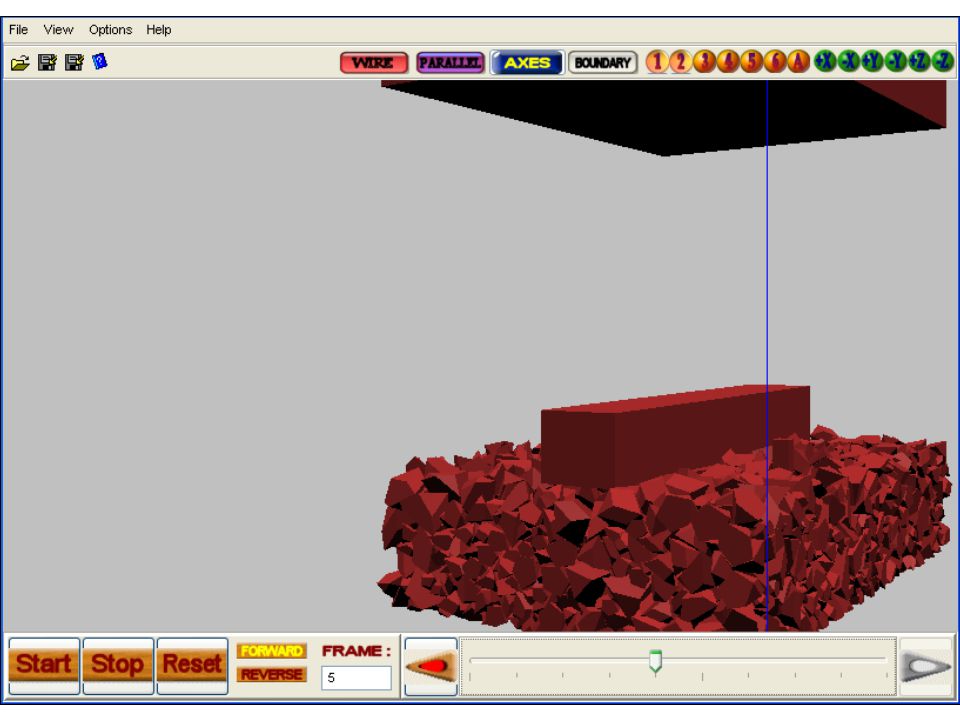
Tie Pull-out Tests – Effect of Tamping Ballast With Aggregate From Library 5 Before Tamping Wheel Load Ballast

111
Ballast With Aggregate From Library 5 After Tamping Wheel Load Ballast Tie Pull-out Tests – Effect of Tamping

112
Validation of Image Aided DEM Approach Direct Shear Box laboratory tests characters Humboldt HM-2560A direct shear device with 100 by 100 mm box Aggregate size: 4.75 – 9.5 mm Laboratory sample has an average AI of 535 and F&E ratio of 1.4:1 Need sensitivity analysis to decide DEM parameters including: Normal Contact Stiffness Shear Contact Stiffness Final set of parameters should make all DEM simulation results close to the laboratory results

113
Real aggregate picture compared to Discrete Element Validation of Image Aided DEM Approach

114
Sensitivity Analysis - First Trial Normal Stiffness: 300000 N/m Shear Stiffness: 300000 N/m Validation of Image Aided DEM Approach

115
Sensitivity Analysis - Second Trial Normal Stiffness: 300000 N/m Shear Stiffness: 500000 N/m Validation of Image Aided DEM Approach

116
Sensitivity Analysis - First Trial Normal Stiffness: 500000 N/m Shear Stiffness: 300000 N/m Validation of Image Aided DEM Approach

117
Final Validation Results Validation of Image Aided DEM Approach

118
Validated Parameters Normal Contact Stiffness500 KN/m Shear Contact Stiffness300KN/m Particle Size4.75~9.5 mm Angularity Index535 Flat & Elongated Ratio1:1.4 Tangent Surface Friction Angle0.7 Validation of Image Aided DEM Approach

119
Ballast Strength in Terms of Aggregate Shapes Direct shear box simulations to investigate the effect of Surface Texture and Angularity Fs Fn A B F F F

120
Ballast Strength in Terms of Aggregate Shapes AI =570, Surface Friction Angle = 40 AI =390, Surface Friction Angle = 15 AI =390, Surface Friction Angle = 40 AI =570, Surface Friction Angle = 15

121
Ballast Strength in Terms of Aggregate Shapes Rough and Angular

122
Ballast Strength in Terms of Aggregate Shapes Rough and Round

123
Ballast Strength in Terms of Aggregate Shapes Smooth and Angular

124
Ballast Strength in Terms of Aggregate Shapes Smooth and Round

125
- Plan View of Ballast Settlement DEM Simulation Center PlaneRail SeatTransverse Vertical Plane Half Tie 0.61 m Application on Railroad Ballast Settlement

126
Ballast Layer Preparation - Ballast Sample of a Half Railroad Section with Angular and Cubical Aggregates of Shape Library 1

127
Need to solve “Moving Load on Track” problem to obtain the load profile on the top of one single tie Application on Railroad Ballast Settlement Observation Tie Load: P; Speed: V; Duration: t Close Form Solution Unequal Tie Spacing Different Tie-Ballast Structure Thermal Stress Arbitrary Excitation

128
Moving Load on Track Observation Tie Load: P; Speed: V; Duration: t Tie Mass Ballast Mass

129
Parameters: EI rail bending rigidity u rail vertical deflection Trail axial thermal force ρ rail unit mass ε rail damping f(t) excitation function δ delta function a m reaction force from substructure mnumber of ties u t tie vertical deflection u b ballast mass deflection K p rail pad stiffness K b ballast stiffness D p rail pad damping D b ballast damping Moving Load on Track
 excitation function δ delta function a m reaction force from substructure mnumber of ties u t tie vertical deflection u b ballast mass deflection K p rail pad stiffness K b ballast stiffness D p rail pad damping D b ballast damping Moving Load on Track")
131
Load Pulse in DEM Loading Magnitude and Frequency in DEM Single Tie Load Pulse of a 286 kip Car Moving @ 28 km/h

132
Simulation Test Matrix Load Magnitude (kN) Frequency (Hz) (Train Speed, km/h) Shape Library 1 (Cubical - Angular) Shape Library 3 (Cubical - Rounded) Shape Library 8 (Elongated - Rounded) 90 1 (28)X X 5 (140)X X 10 (280)X X 120 1 (28)XXX 5 (140)XXX 10 (280)XXX 150 1(28)X X 5 (140)X X 10 (280)X X
 Frequency (Hz) (Train Speed, km/h) Shape Library 1 (Cubical - Angular) Shape Library 3 (Cubical - Rounded) Shape Library 8 (Elongated - Rounded) 90 1 (28)X X 5 (140)X X 10 (280)X X (28)XXX 5 (140)XXX 10 (280)XXX 150 1(28)X X 5 (140)X X 10 (280)X X")
133
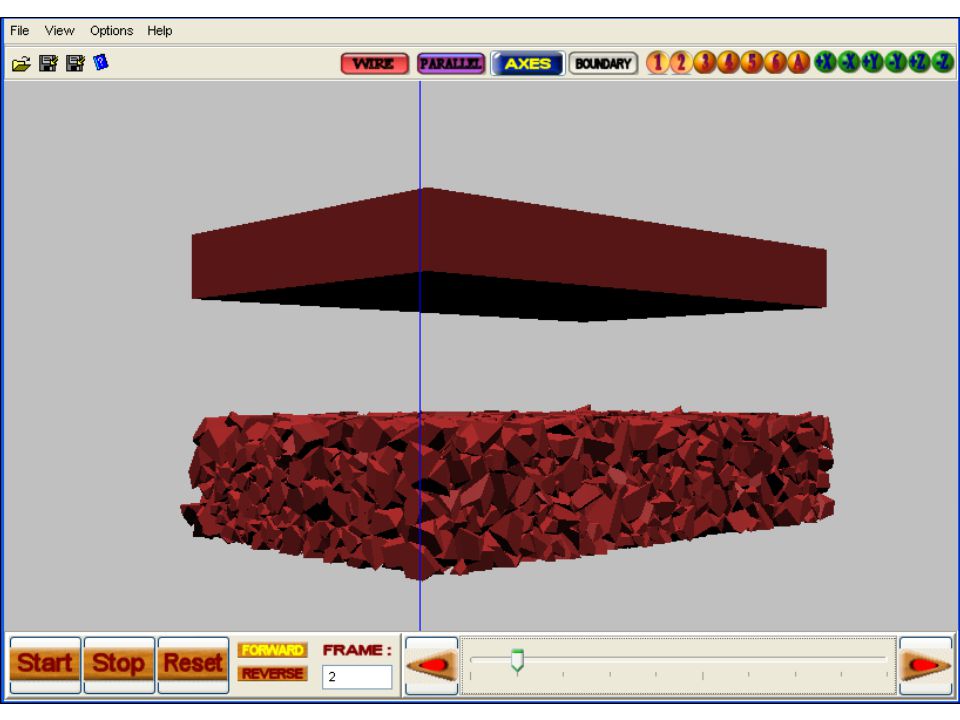
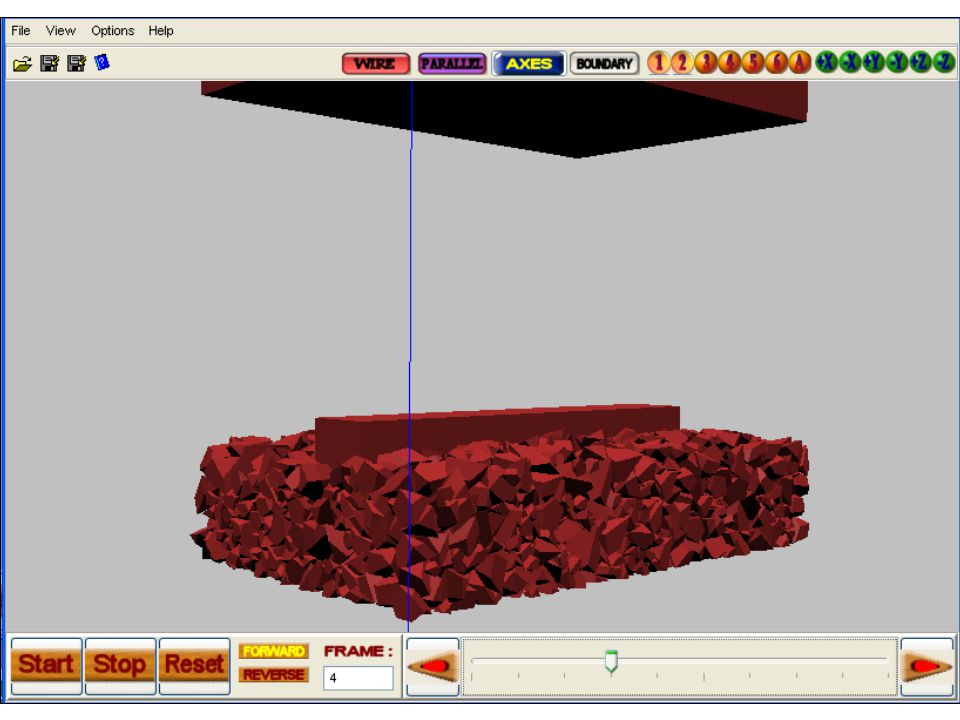
Repeated Loading – Longitudinal view CYCLE 0

134
Repeated Loading – Longitudinal view CYCLE 0

135
Repeated Loading – Longitudinal view CYCLE 0

136
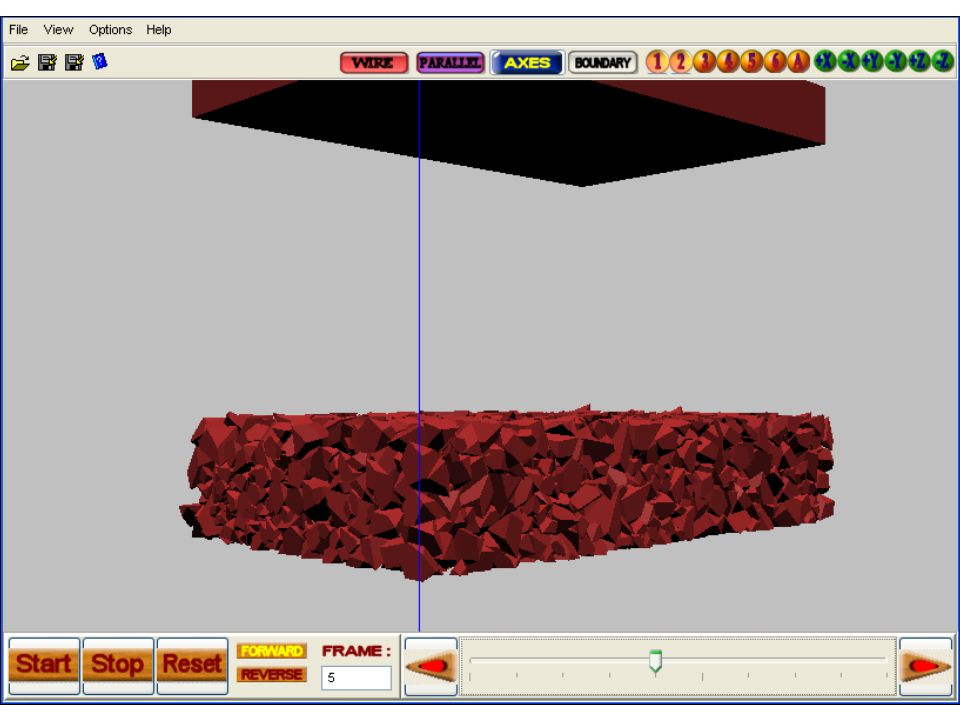
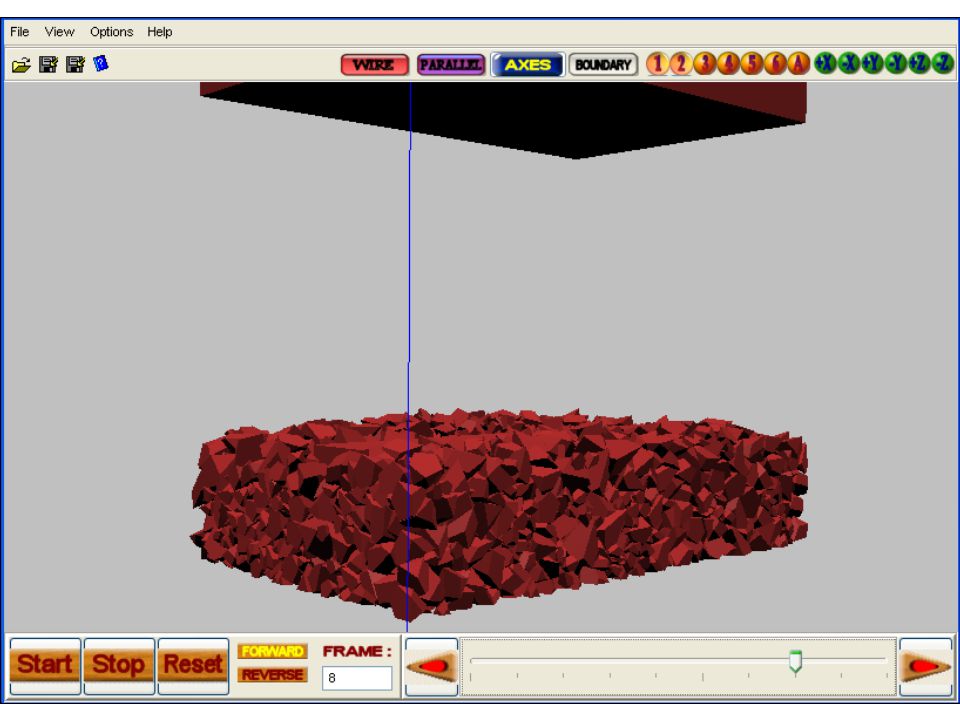
Repeated Loading – Longitudinal view CYCLE 20

137
Repeated Loading – Longitudinal view CYCLE 20

138
Repeated Loading – Longitudinal view CYCLE 20

139
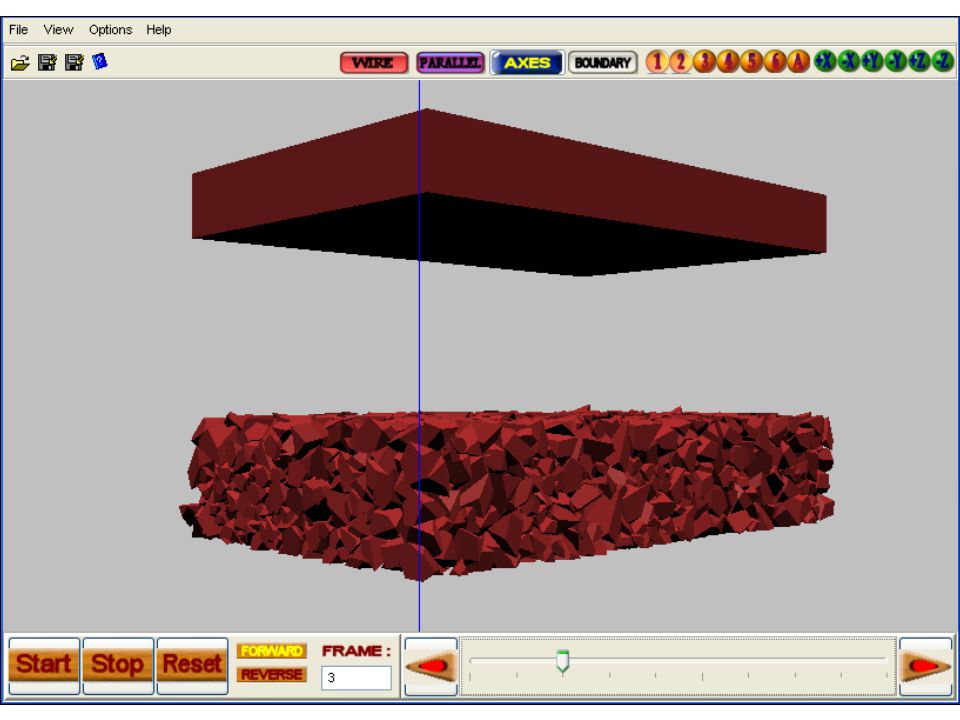
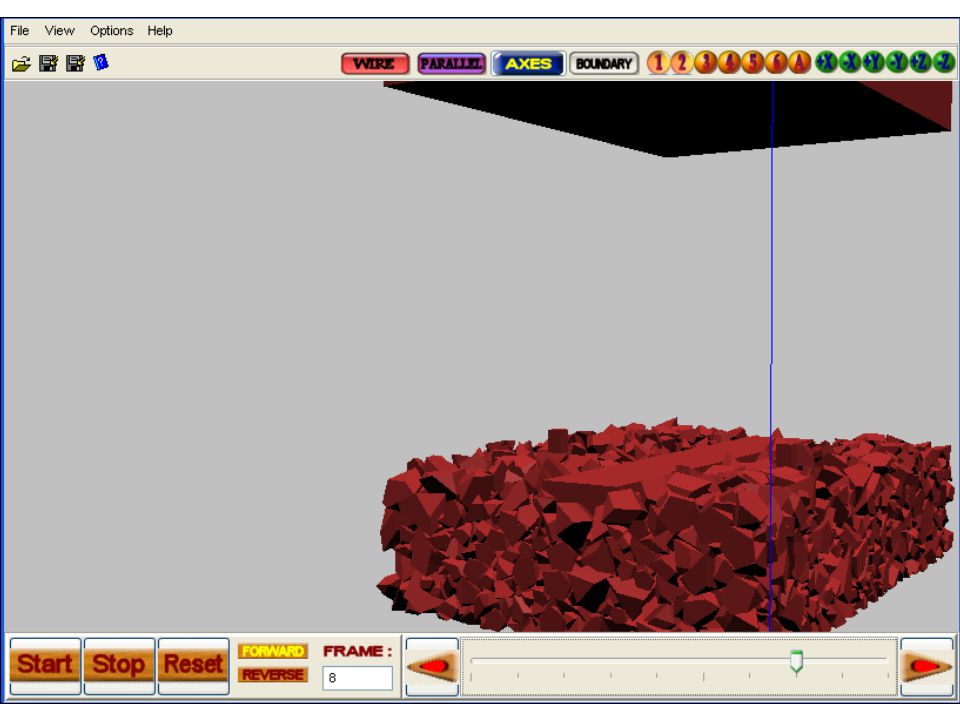
Repeated Loading – Longitudinal view CYCLE 40

140
Repeated Loading – Longitudinal view CYCLE 40

141
Repeated Loading – Longitudinal view CYCLE 40

142
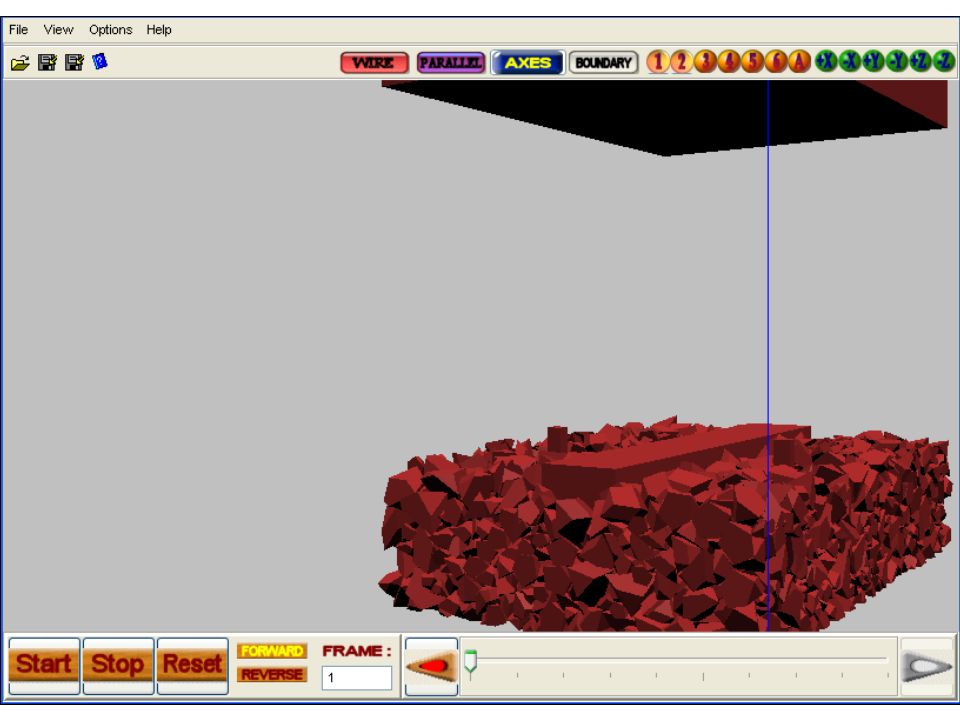
Repeated Loading – Longitudinal view CYCLE 60

143
Repeated Loading – Longitudinal view CYCLE 60

144
Repeated Loading – Longitudinal view CYCLE 60

145
Repeated Loading – Longitudinal view CYCLE 80

146
Repeated Loading – Longitudinal view CYCLE 80

147
Repeated Loading – Longitudinal view CYCLE 80

148
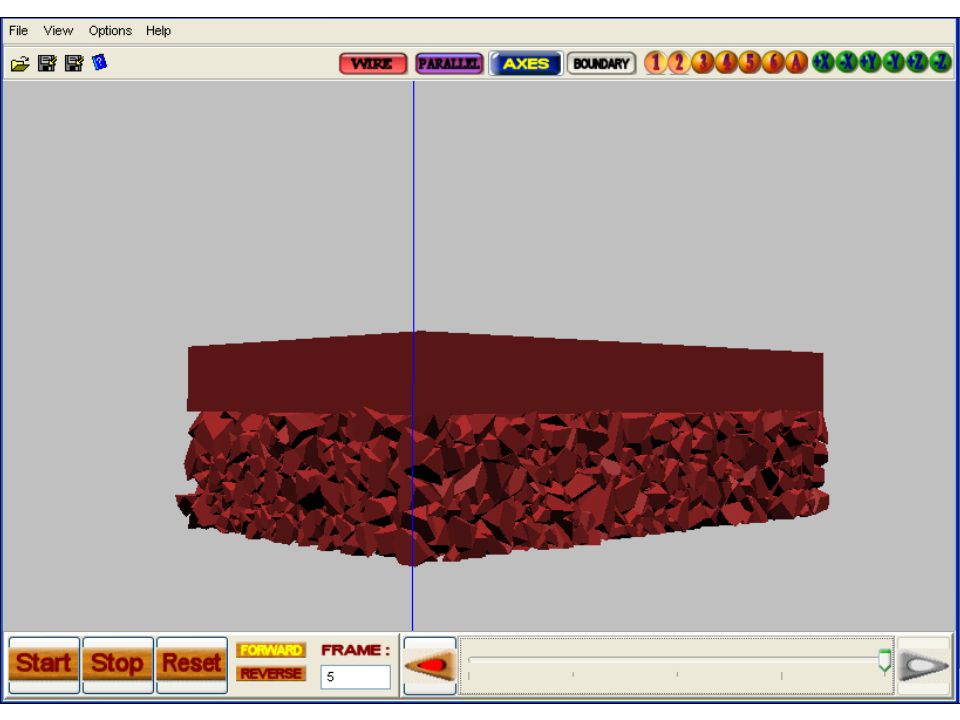
Repeated Loading – Longitudinal view CYCLE 100

149
Repeated Loading – Longitudinal view CYCLE 100

150
Repeated Loading – Longitudinal view CYCLE 100

151
Repeated Loading – Longitudinal view CYCLE 200

152
Repeated Loading – Longitudinal view CYCLE 200

153
Repeated Loading – Longitudinal view CYCLE 200

154
Repeated Loading – Longitudinal view CYCLE 400

155
Repeated Loading – Longitudinal view CYCLE 400

156
Repeated Loading – Longitudinal view CYCLE 400

157
Repeated Loading – Longitudinal view CYCLE 600

158
Repeated Loading – Longitudinal view CYCLE 600

159
Repeated Loading – Longitudinal view CYCLE 600

160
Repeated Loading – Longitudinal view CYCLE 800

161
Repeated Loading – Longitudinal view CYCLE 800

162
Repeated Loading – Longitudinal view CYCLE 800

163
Repeated Loading – Side View CYCLE 0

164
Repeated Loading – Side View CYCLE 0

165
Repeated Loading – Side View CYCLE 0

166
Repeated Loading – Side View CYCLE 20

167
Repeated Loading – Side View CYCLE 20

168
Repeated Loading – Side View CYCLE 20

169
Repeated Loading – Side View CYCLE 40

170
Repeated Loading – Side View CYCLE 40

171
Repeated Loading – Side View CYCLE 40

172
Repeated Loading – Side View CYCLE 60

173
Repeated Loading – Side View CYCLE 60

174
Repeated Loading – Side View CYCLE 60

175
Repeated Loading – Side View CYCLE 80

176
Repeated Loading – Side View CYCLE 80

177
Repeated Loading – Side View CYCLE 80

178
Repeated Loading – Side View CYCLE 100

179
Repeated Loading – Side View CYCLE 100

180
Repeated Loading – Side View CYCLE 100

181
Repeated Loading – Side View CYCLE 200

182
Repeated Loading – Side View CYCLE 200

183
Repeated Loading – Side View CYCLE 200

184
Repeated Loading – Side View CYCLE 400

185
Repeated Loading – Side View CYCLE 400

186
Repeated Loading – Side View CYCLE 400

187
Repeated Loading – Side View CYCLE 600

188
Repeated Loading – Side View CYCLE 600

189
Repeated Loading – Side View CYCLE 600

190
Repeated Loading – Side View CYCLE 800

191
Repeated Loading – Side View CYCLE 800

192
Repeated Loading – Side View CYCLE 800

193
Simulation Results and Analysis - Permanent Settlement of Ballast with Aggregate Shape Library 1 (Cubical – Angular) at three Different Loading Frequencies Library 1 Rutting Trend Line
 at three Different Loading Frequencies Library 1 Rutting Trend Line")
194
Critical Loading Frequency (?) for maximum rutting f = 1 - 5 Hz Library 1 Aggregate 120 kN Load Simulation Results and Analysis - Permanent Deformation Produced by the Static Load and the Same Magnitude Dynamic Loads Applied at Different Frequencies
 for maximum rutting f = Hz Library 1 Aggregate 120 kN Load Simulation Results and Analysis - Permanent Deformation Produced by the Static Load and the Same Magnitude Dynamic Loads Applied at Different Frequencies")
195
Simulation Results and Analysis - Comparisons of Ballast Settlement between Aggregate Shape Library 1 (Cubical – Angular) and Shape Library 8 (Elongated – Rounded) at Three Loading Frequencies Library 8 Rutting Trend Line
 and Shape Library 8 (Elongated – Rounded) at Three Loading Frequencies Library 8 Rutting Trend Line")
196
Simulation Results and Analysis - Comparisons of Ballast Settlement between Aggregate Shape Library 1 (Cubical – Angular) and Shape Library 3 (Cubical – Rounded) at Three Loading Frequencies Library 3 Rutting Trend Line
 and Shape Library 3 (Cubical – Rounded) at Three Loading Frequencies Library 3 Rutting Trend Line")
197
Simulation Results and Analysis Only one tie is simulated in the train moving direction, the interactions between ties are not considered in the DEM simulations and the ballast aggregate movement along the traffic direction is limited by the transverse plane 20000 25000 30000 35000 40000 45000 020406080100120 Loading Cycle Library 3 Library 1 Residual Force on Transverse Vertical Plane (The Middle Plane between Two Ties) (N) More rounded Library 3 has higher lateral confinement to reduce permanent deformation tendency Transverse Vertical Plane 0.61 m
 (N) More rounded Library 3 has higher lateral confinement to reduce permanent deformation tendency Transverse Vertical Plane 0.61 m")
198
Conclusions Aggregate angularity was found to have significant impact on strength of aggregate assembly. Aggregate surface texture, defined as the friction between two particles in contact, was quantified from direct shear box DEM simulations to have even more pronounced impact on the strength of the assembly when compared to aggregate angularity. Reducing the train speed, such as in the slow orders, (or decreasing the applied loading frequency by increasing the load pulse durations) often results in a significant increase in the rut accumulation. However, static loading induced smaller permanent deformations than the 1-Hz loading. Therefore, a critical loading frequency to give maximum rutting was found to be between 1 and 5 Hz loadings. Effects of ballast aggregate shape was also found to influence ballast settlement. The DEM simulations that considered single tie tests resulted in lower ballast settlements for rounded aggregate particles possible due to lesser tendency to shakedown and consolidate. For future ballast settlement simulations, it will be worthwhile to consider a modified ballast box for the half tie and half ballast width railroad track geometry with at least three ties included to model longitudinal confinement and movement of ballast aggregate.
 often results in a significant increase in the rut accumulation. However, static loading induced smaller permanent deformations than the 1-Hz loading. Therefore, a critical loading frequency to give maximum rutting was found to be between 1 and 5 Hz loadings. Effects of ballast aggregate shape was also found to influence ballast settlement. The DEM simulations that considered single tie tests resulted in lower ballast settlements for rounded aggregate particles possible due to lesser tendency to shakedown and consolidate. For future ballast settlement simulations, it will be worthwhile to consider a modified ballast box for the half tie and half ballast width railroad track geometry with at least three ties included to model longitudinal confinement and movement of ballast aggregate..")
199
Future Work Fouling study by combining Image Aided DEM Simulation with Large Direct Shear Box Tests. Field Validation of Image Aided DEM Approach in TTCI “FAST” Track.

200
The Authors would like to thank the Association of American Railroad for their financial support of this research study through the AAR Affiliated Research Laboratory established at the University of Illinois at Urbana-Champaign The Authors would like to thank the Association of American Railroad for their financial support of this research study through the AAR Affiliated Research Laboratory established at the University of Illinois at Urbana-Champaign Acknowledgement Association of American Railroads

Similar presentations


 of representative samples or strength parameters or slope.>")
 Benjamin Leonard Post-Doctoral Research Associate Third Body Modeling Using a Combined.>")


