Download presentation
Presentation is loading. Please wait.

1
Deutsche Presentation Retail Market Dynamics February 2015

2
Section Heading Consumer Position High Income vs. Low & Middle Income markets Relative outperformance but not immune to slowing economy Credit position is the major differentiator Risks: Aspirational shopper has limited resources Stock market performance Possible higher personal taxes

3
Y / Y % Growth Affluent BROOKLYN MALL8.8% LA LUCIA MALL5.6% WALMER PARK9.0% CONSTANTIA VILLAGE6.4% Solid-Middle WATERFALL MALL-1.0% KOLONNADE5.9% WOODMEAD RETAIL PARK4.3% RIVER SQUARE3.8% Lower-Middle NORTHGATE-0.7% LONGBEACH MALL8.2% CBD / Commuter LAKESIDE MALL3.0% ALBERTON CITY-0.4% GOLDEN ACRE10.3% CITY VIEW2.1% CITY MALL-8.7% HATFIELD PLAZA2.8% Annual Trading Densities

4
Y / Y % Growth Affluent BROOKLYN MALL8.8% LA LUCIA MALL5.6% WALMER PARK9.0% CONSTANTIA VILLAGE6.4% Solid-Middle WATERFALL MALL-1.0% KOLONNADE5.9% WOODMEAD RETAIL PARK4.3% RIVER SQUARE3.8% Lower-Middle NORTHGATE-0.7% LONGBEACH MALL8.2% CBD / Commuter LAKESIDE MALL3.0% ALBERTON CITY-0.4% GOLDEN ACRE10.3% CITY VIEW2.1% CITY MALL-8.7% HATFIELD PLAZA2.8% Annual Trading Densities

5
Y / Y % Growth Affluent BROOKLYN MALL8.8% LA LUCIA MALL5.6% WALMER PARK9.0% CONSTANTIA VILLAGE6.4% Solid-Middle WATERFALL MALL-1.0% KOLONNADE5.9% WOODMEAD RETAIL PARK4.3% RIVER SQUARE3.8% Lower-Middle NORTHGATE-0.7% LONGBEACH MALL8.2% CBD / Commuter LAKESIDE MALL3.0% ALBERTON CITY-0.4% GOLDEN ACRE10.3% CITY VIEW2.1% CITY MALL-8.7% HATFIELD PLAZA2.8% Annual Trading Densities

6
Y / Y % Growth Affluent BROOKLYN MALL8.8% LA LUCIA MALL5.6% WALMER PARK9.0% CONSTANTIA VILLAGE6.4% Solid-Middle WATERFALL MALL-1.0% KOLONNADE5.9% WOODMEAD RETAIL PARK4.3% RIVER SQUARE3.8% Lower-Middle NORTHGATE-0.7% LONGBEACH MALL8.2% CBD / Commuter LAKESIDE MALL3.0% ALBERTON CITY-0.4% GOLDEN ACRE10.3% CITY VIEW2.1% CITY MALL-8.7% HATFIELD PLAZA2.8% Annual Trading Densities

7
Y / Y % Growth Affluent BROOKLYN MALL8.8% LA LUCIA MALL5.6% WALMER PARK9.0% CONSTANTIA VILLAGE6.4% Solid-Middle WATERFALL MALL-1.0% KOLONNADE5.9% WOODMEAD RETAIL PARK4.3% RIVER SQUARE3.8% Lower-Middle NORTHGATE-0.7% LONGBEACH MALL8.2% CBD / Commuter LAKESIDE MALL3.0% ALBERTON CITY-0.4% GOLDEN ACRE10.3% CITY VIEW2.1% CITY MALL-8.7% HATFIELD PLAZA2.8% Annual Trading Densities

8
Y / Y % Growth Affluent BROOKLYN MALL8.8% LA LUCIA MALL5.6% WALMER PARK9.0% CONSTANTIA VILLAGE6.4% Solid-Middle WATERFALL MALL-1.0% KOLONNADE5.9% WOODMEAD RETAIL PARK4.3% RIVER SQUARE3.8% Lower-Middle NORTHGATE-0.7% LONGBEACH MALL8.2% CBD / Commuter LAKESIDE MALL3.0% ALBERTON CITY-0.4% GOLDEN ACRE10.3% CITY VIEW2.1% CITY MALL-8.7% HATFIELD PLAZA2.8% Annual Trading Densities

9
Y / Y % Growth Affluent BROOKLYN MALL8.8% LA LUCIA MALL5.6% WALMER PARK9.0% CONSTANTIA VILLAGE6.4% Solid-Middle WATERFALL MALL-1.0% KOLONNADE5.9% WOODMEAD RETAIL PARK4.3% RIVER SQUARE3.8% Lower-Middle NORTHGATE-0.7% LONGBEACH MALL8.2% CBD / Commuter LAKESIDE MALL3.0% ALBERTON CITY-0.4% GOLDEN ACRE10.3% CITY VIEW2.1% CITY MALL-8.7% HATFIELD PLAZA2.8% Annual Trading Densities

10
Dec-13 vs Dec-14 (% Growth) Affluent BROOKLYN MALL9.9% LA LUCIA MALL5.2% WALMER PARK12.6% CONSTANTIA VILLAGE8.2% Solid-Middle WATERFALL MALL1.1% KOLONNADE5.9% WOODMEAD RETAIL PARK5.5% RIVER SQUARE-0.8% Lower-Middle NORTHGATE3.6% LONGBEACH MALL11.2% CBD / Commuter LAKESIDE MALL3.0% ALBERTON CITY-0.4% GOLDEN ACRE10.3% CITY VIEW0.1% CITY MALL-19.0% HATFIELD PLAZA9.2% December Trading Densities
 Affluent BROOKLYN MALL9.9% LA LUCIA MALL5.2% WALMER PARK12.6% CONSTANTIA VILLAGE8.2% Solid-Middle WATERFALL MALL1.1% KOLONNADE5.9% WOODMEAD RETAIL PARK5.5% RIVER SQUARE-0.8% Lower-Middle NORTHGATE3.6% LONGBEACH MALL11.2% CBD / Commuter LAKESIDE MALL3.0% ALBERTON CITY-0.4% GOLDEN ACRE10.3% CITY VIEW0.1% CITY MALL-19.0% HATFIELD PLAZA9.2% December Trading Densities")
11
Dec-13 vs Dec-14 (% Growth) Affluent BROOKLYN MALL9.9% LA LUCIA MALL5.2% WALMER PARK12.6% CONSTANTIA VILLAGE8.2% Solid-Middle WATERFALL MALL1.1% KOLONNADE5.9% WOODMEAD RETAIL PARK5.5% RIVER SQUARE-0.8% Lower-Middle NORTHGATE3.6% LONGBEACH MALL11.2% CBD / Commuter LAKESIDE MALL3.0% ALBERTON CITY-0.4% GOLDEN ACRE10.3% CITY VIEW0.1% CITY MALL-19.0% HATFIELD PLAZA9.2% December Trading Densities
 Affluent BROOKLYN MALL9.9% LA LUCIA MALL5.2% WALMER PARK12.6% CONSTANTIA VILLAGE8.2% Solid-Middle WATERFALL MALL1.1% KOLONNADE5.9% WOODMEAD RETAIL PARK5.5% RIVER SQUARE-0.8% Lower-Middle NORTHGATE3.6% LONGBEACH MALL11.2% CBD / Commuter LAKESIDE MALL3.0% ALBERTON CITY-0.4% GOLDEN ACRE10.3% CITY VIEW0.1% CITY MALL-19.0% HATFIELD PLAZA9.2% December Trading Densities")
12
Rental Affordability TOP 10 CENTRES VALUE (R mil) GLAVALUE / M2 COST OF OCCUPANCY AVE. TRADING DENSITY (12 Months) BROOKLYN MALL (75%)1,95356,06934,8398.8%2,819 WATERFALL MALL1,28749,22826,1427.4%2,649 LAKESIDE MALL1,23467,51518,2707.2%2,056 LA LUCIA MALL1,06636,37929,2957.4%2,921 KOLONNADE (50%)95837,89325,2926.3%2,828 WALMER PARK90143,20220,8586.5%2,530 ALBERTON CITY87747,61518,4147.3%2,135 CONSTANTIA VILLAGE81320,37039,9264.8%6,007 NORTHGATE (50%)75645,32916,66910.4%1,664 WOODMEAD RETAIL PARK73254,89113,3284.9%2,876
 BROOKLYN MALL (75%)1,95356,06934,8398.8%2,819 WATERFALL MALL1,28749,22826,1427.4%2,649 LAKESIDE MALL1,23467,51518,2707.2%2,056 LA LUCIA MALL1,06636,37929,2957.4%2,921 KOLONNADE (50%)95837,89325,2926.3%2,828 WALMER PARK90143,20220,8586.5%2,530 ALBERTON CITY87747,61518,4147.3%2,135 CONSTANTIA VILLAGE81320,37039,9264.8%6,007 NORTHGATE (50%)75645,32916, %1,664 WOODMEAD RETAIL PARK73254,89113,3284.9%2,876.")
13
Rental Affordability TOP 10 CENTRES VALUE (R mil) GLAVALUE / M2 COST OF OCCUPANCY AVE. TRADING DENSITY (12 Months) BROOKLYN MALL (75%)1,95356,06934,8398.8%2,819 WATERFALL MALL1,28749,22826,1427.4%2,649 LAKESIDE MALL1,23467,51518,2707.2%2,056 LA LUCIA MALL1,06636,37929,2957.4%2,921 KOLONNADE (50%)95837,89325,2926.3%2,828 WALMER PARK90143,20220,8586.5%2,530 ALBERTON CITY87747,61518,4147.3%2,135 CONSTANTIA VILLAGE81320,37039,9264.8%6,007 NORTHGATE (50%)75645,32916,66910.4%1,664 WOODMEAD RETAIL PARK73254,89113,3284.9%2,876
 BROOKLYN MALL (75%)1,95356,06934,8398.8%2,819 WATERFALL MALL1,28749,22826,1427.4%2,649 LAKESIDE MALL1,23467,51518,2707.2%2,056 LA LUCIA MALL1,06636,37929,2957.4%2,921 KOLONNADE (50%)95837,89325,2926.3%2,828 WALMER PARK90143,20220,8586.5%2,530 ALBERTON CITY87747,61518,4147.3%2,135 CONSTANTIA VILLAGE81320,37039,9264.8%6,007 NORTHGATE (50%)75645,32916, %1,664 WOODMEAD RETAIL PARK73254,89113,3284.9%2,876.")
14
Rental Affordability TOP 10 CENTRES VALUE (R mil) GLAVALUE / M2 COST OF OCCUPANCY AVE. TRADING DENSITY (12 Months) BROOKLYN MALL (75%)1,95356,06934,8398.8%2,819 WATERFALL MALL1,28749,22826,1427.4%2,649 LAKESIDE MALL1,23467,51518,2707.2%2,056 LA LUCIA MALL1,06636,37929,2957.4%2,921 KOLONNADE (50%)95837,89325,2926.3%2,828 WALMER PARK90143,20220,8586.5%2,530 ALBERTON CITY87747,61518,4147.3%2,135 CONSTANTIA VILLAGE81320,37039,9264.8%6,007 NORTHGATE (50%)75645,32916,66910.4%1,664 WOODMEAD RETAIL PARK73254,89113,3284.9%2,876
 BROOKLYN MALL (75%)1,95356,06934,8398.8%2,819 WATERFALL MALL1,28749,22826,1427.4%2,649 LAKESIDE MALL1,23467,51518,2707.2%2,056 LA LUCIA MALL1,06636,37929,2957.4%2,921 KOLONNADE (50%)95837,89325,2926.3%2,828 WALMER PARK90143,20220,8586.5%2,530 ALBERTON CITY87747,61518,4147.3%2,135 CONSTANTIA VILLAGE81320,37039,9264.8%6,007 NORTHGATE (50%)75645,32916, %1,664 WOODMEAD RETAIL PARK73254,89113,3284.9%2,876.")
15
Listed Retailers GLA Ave. Trading Density (12 Months) Y/Y Growth CHECKERS23,2292,902 PICK 'N PAY73,4202,721 CLICKS13,7813,259 GAME35,8861,941 MR PRICE HOME10,8092,105 MR PRICE APPAREL13,7172,782 FOSCHINI9,1281,937 TRUWORTHS14,2932,505 WOOLWORTHS59,0663,019
 Y/Y Growth CHECKERS23,2292,902 PICK N PAY73,4202,721 CLICKS13,7813,259 GAME35,8861,941 MR PRICE HOME10,8092,105 MR PRICE APPAREL13,7172,782 FOSCHINI9,1281,937 TRUWORTHS14,2932,505 WOOLWORTHS59,0663,019.")
16
Section Heading Retail Space: Supply & Demand Dynamics 2003 - 2008: Strong GDP growth of ≥ 3% : 2002 – 2008 Relative high employment growth : 2004 -2008 Social Grant roll-out : 2004 – 2009 Consumer Credit Growth: Debt/Income Ratio 55% in ’03 to 83% in ’08 2010 – 2012: Recovery driven by unsecured lending

17
Section Heading National Shopping Centre GLA Growth Shopping centres ≥ 30 000m² expansion rate: 1993 – 2012 : 7.8% p.a.2006 – 2009: 12.4% p.a. 2009 – 2012: 9% p.a.2012 onwards: +/- 6% Supply exceeding demand, leading to declining trading densities, higher occupancy costs and margin compression. Landlords experience higher vacancies, lower turnover rental, limited rental growth USA Example USA Mall Health Index (Vacancy ≤ 10%): Deteriorated 94% (2006) to 80% (2014) USA Malls with 10% - 40% vacancy: 5% (2006) to 15% (2014) Shopping centres with combined GLA of 3mil m² are 40%+ vacant
: Deteriorated 94% (2006) to 80% (2014) USA Malls with 10% - 40% vacancy: 5% (2006) to 15% (2014) Shopping centres with combined GLA of 3mil m² are 40%+ vacant.")
18
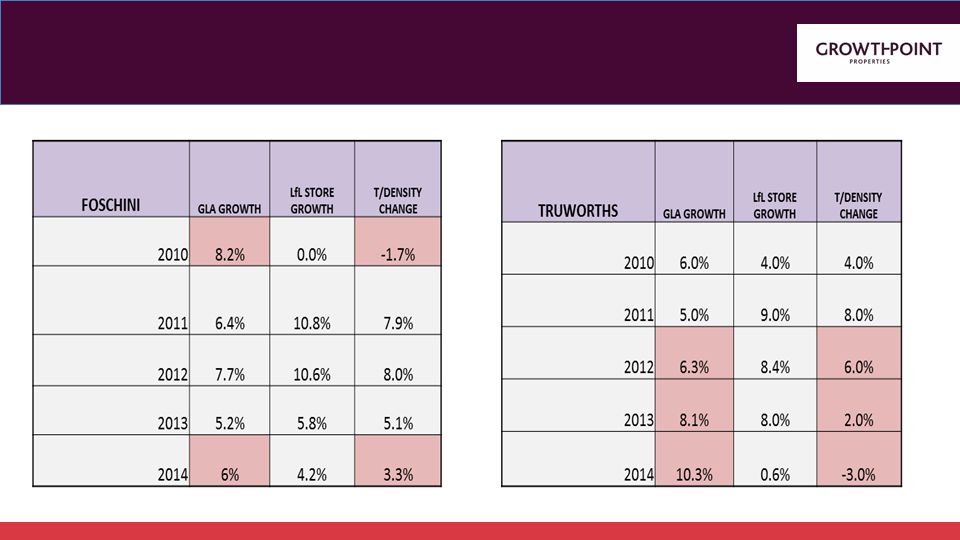
Section Heading Listed Retailer: Trading area growth - Relative performance MR PRICE: Consolidation: (Mr Price Home & Sport) Increasing GLA at performing stores WOOLWORTHS: Enlarging high trading density stores Rental model supporting GLA growth FOSCHINI :New stores underperforming existing Trading density growth decelerating TRUWORTHS: Aggressive growth 2012 - 2014 Negative trading density growth
 Increasing GLA at performing stores WOOLWORTHS: Enlarging high trading density stores Rental model supporting GLA growth FOSCHINI :New stores underperforming existing Trading density growth decelerating TRUWORTHS: Aggressive growth Negative trading density growth")
19
Section Heading

21
New Centre Performance Matlosana Mall Flamwood Mall Waterfall Corner Club Centre Cosmo Centre Forest Hill Mall of Rosebank Redevelopment Newtown

22
Section Heading Impact of new competition Klerksdorp – City Mall impacted by Flamwood & Matlosana Greater Matlosana – 400k population; growth 2001 to 2011 : 1.04% (RSA 1.44%) Northwest GDP/Capita 69% of Gauteng Combined GLA of Flamwood, Tower Mall (Jouberton 2013) and Matlosana – 100 000m² City Mall Trading Density y-o-y change: 2013 vs 2012 – down 4% 2014 vs 2013 – down 8.2% to R1922/m² Dec 2014 vs Dec 2013 – down 19% to R2 776/m² (R14mil loss in sales) ≥ 40% decline: Woolworths, C.N.A., Musica, Red Square, Sterns, Verimark and most cellular shops 20% - 40% decline: All Foschini brands, Legit, The Hub, Wimpy, Sheet Street Positive y-o-y growth: Ackermans, PEP, Webbers, PEP Cel, Signature Cosmetics, Side Step, Spitz, Skipper Bar
 Northwest GDP/Capita 69% of Gauteng Combined GLA of Flamwood, Tower Mall (Jouberton 2013) and Matlosana – m² City Mall Trading Density y-o-y change: 2013 vs 2012 – down 4% 2014 vs 2013 – down 8.2% to R1922/m² Dec 2014 vs Dec 2013 – down 19% to R2 776/m² (R14mil loss in sales) ≥ 40% decline: Woolworths, C.N.A., Musica, Red Square, Sterns, Verimark and most cellular shops 20% - 40% decline: All Foschini brands, Legit, The Hub, Wimpy, Sheet Street Positive y-o-y growth: Ackermans, PEP, Webbers, PEP Cel, Signature Cosmetics, Side Step, Spitz, Skipper Bar")
23
Section Heading Impact of new competition Brooklyn Mall impacted by 1500m² Woolworths stand-alone at Club Centre Woolworths food trading density declined by average 5.1% p.m. y-o-y, reducing overall Woolworths growth to 2.7% in 2014. December up 6.8% Woodmead impacted by Woolworths Food store at Waterfall Corner 2012/2013 Y-o-Y trading density growth – 15.7% 2014/2013 Y-o-Y trading density growth – 6.7% December 2014 Y-o-Y growth – 9.6% 2014 Average trading density: R5000/m²

24
Section Heading Eskom Load Shedding Shopper behaviour: At home & at shopping centres Availability of back-up power: Anchors, Nationals & Line shops Impact on centre operations: Security, parking, equipment Impact on foot counts & trading There is not a visible “loss” of visitors to the mall due to load shedding activities. The rate of new arrivals drop on average with 50% during load shedding hours, but quickly resumes after power is restored. The week day arrival pattern shifts to later during the day, but resumes the normal arrival patterns until close of business. Average dwell times for the specific days in question shows a 200% increase across new visitors and recurring customers

25
Traditional Saturday Pattern 12 months general pattern for normal Saturdays Power Outages on Saturdays 22/11/14 Saturday traffic growth peaks at 11h00 and 19h00 clock With load-shedding the traffic drops in average with 50 % but resumes in growth after load-shedding stopped. There is no substantial decrease in overall volumes. However, average time in mall spend however doubles.

26
12 months normal arrival pattern for Sunday Normal Sunday traffic growth peaks at 11h00 Arrival pattern on a Sunday with Load Shedding

27
Section Heading Eskom Load Shedding Growthpoint position Diesel generators Solar Inverters & UPS Energy saving initiatives Change in trading hours

28
Section Heading International Retailers Rationale for market entry : International foot print, RSA retailer margins. Luxury International Brands Brand recognition & Trading Performance Market size Presence & interest: LV, Gucci, Dior, Burberry, D&G, Prada, Fendi Franchised International Brands Edcon – Topshop, River Island, Tom Taylor, TM Lewin, Lucky Brand, Lipsy, Calvin Klein, Accessorize Busby – Topshop, Guess, Mango, Tumi, Karen Millen Surtee – Hugo Boss, Dunn Hill, Hacket, Armani Other – GAP, Banana Republic, Pringle, Ben Sherman, Tiger of Sweden, Hamleys H&M

29
Section Heading Cotton On Group Market Entry Strategy Pricing Performance in terms of market penetration, market share and trading density Cotton On Factorie Typo CO Kids Impact on RSA retailers Risks

30
Section Heading Inditex / ZARA Market entry strategy Brand Awareness Store Performance Sandton, V&A, KZN, PE, Cresta, Tyger Valley Store roll-out programme Impact on RSA retailers Challenges Currency pressure, product sizing, market knowledge, shrinkage Zara Home

31
Section Heading Questions

Similar presentations


 of Finance City University of Hong Kong.>")


