Download presentation
Presentation is loading. Please wait.

1
Application of Game Theory in Economic Growth. (Control of Pollutant Emission Level) A Presentation by Kashyap Arora (EE02B086)
 A Presentation by Kashyap Arora (EE02B086).")
2
1.Game Theory: A brief Introduction 1.Competition Game 2.Nash Equilibrium 3.Prisoner’s Dilemma 2. Pollutant Emission Level 1.Income and Energy Consumption 2.CO 2 emission levels 3. Kyoto Protocols 3.Simple Environmental Game 1.Corporative and Non-Corporative Behaviors 2.Nash Equilibrium and Socially Optimal Emission Level.

3
Game Theory A branch of applied mathematics that studies strategic situations where players choose different actions in an attempt to maximize their returns. Choice of optimal behavior - given costs and benefits of each option are not fixed, but depend upon the choices of other individuals. Each player has a strategy. Players are assumed to be rational. Various types of games –Symmetric and Asymmetric –Zero sum and Non-Zero sum

4
Competition Game Two players A and B choose a number from 0 to 10. Both players win the minimum of the two numbers in Rupees. BUT, if one player chooses a larger number, then he will have to pay Rs 2 to the other player. e.g. ‘A’ chooses 6 and ‘B’ chooses 3. Both get Rs 3/-, but ‘A’ also has to pay Rs 2 to ‘B’. Total profit of A=3-2=1, total profit of B=3+2=5. If allowed to run for a long period of time, both the players will settle on the (0,0) strategy.
 strategy..")
5
Nash Equilibrium Formal Definition : Let (S, f) be a game, where S is the set of strategy profiles and f is the set of payoff profiles. When each player chooses strategy resulting in strategy profile x = (x1,...,xn) then player i obtains payoff f i (x). A strategy profile is a Nash equilibrium (NE) if no deviation in strategy by any single player is profitable, that is, if for all i f i (x*) f i (x i,x* -i ) Nash Equilibrium: A set of strategies. If each player has chosen a strategy and no player can benefit by changing his or her strategy while the other players keep theirs unchanged, then the current set of strategy choices and the corresponding payoffs constitute a Nash equilibrium. Competition Game: Unique Nash Equilibrium - both players choosing zero. source:http://en.wikipedia.org/wiki/Nash_equilibrium
 then player i obtains payoff f i (x). A strategy profile is a Nash equilibrium (NE) if no deviation in strategy by any single player is profitable, that is, if for all i f i (x*) f i (x i,x* -i ) Nash Equilibrium: A set of strategies. If each player has chosen a strategy and no player can benefit by changing his or her strategy while the other players keep theirs unchanged, then the current set of strategy choices and the corresponding payoffs constitute a Nash equilibrium. Competition Game: Unique Nash Equilibrium - both players choosing zero. source:")
6
Prisoners Dilemma Two prisoners A and B Each prisoner has two strategies: Remain silent or betray Pay-off Matrix: The outcome of each choice depends on the choice of the accomplice. Neither prisoner knows the choice of his accomplice. Nash Equilibrium exists at both prisoners ‘choosing to betray’. Prisoner B stays silentPrisoner B betrays Prisoner A stays silent Both serve six months Prisoner A serves ten years; Prisoner B goes free. Prisoner A betrays Prisoner B serves ten years; Prisoner A goes free Both serve two years

7
Economic Development & Emission Levels Economic Development accompanied by growth in consumption of fuels by industries. Excess Carbon dioxide emission results in greenhouse effect. –Increase in temperature and rise in sea level. –1995 report of the Intergovernmental Panel on Climate Change, by 2100 Increase in mean global temperature : 1.0–3.5 0 C Rise in global sea level 15–95 centimeters. Could lead to –damage of forests and other ecosystems. –Access to safe water could worsen. –Flooding of temperate and humid regions

8
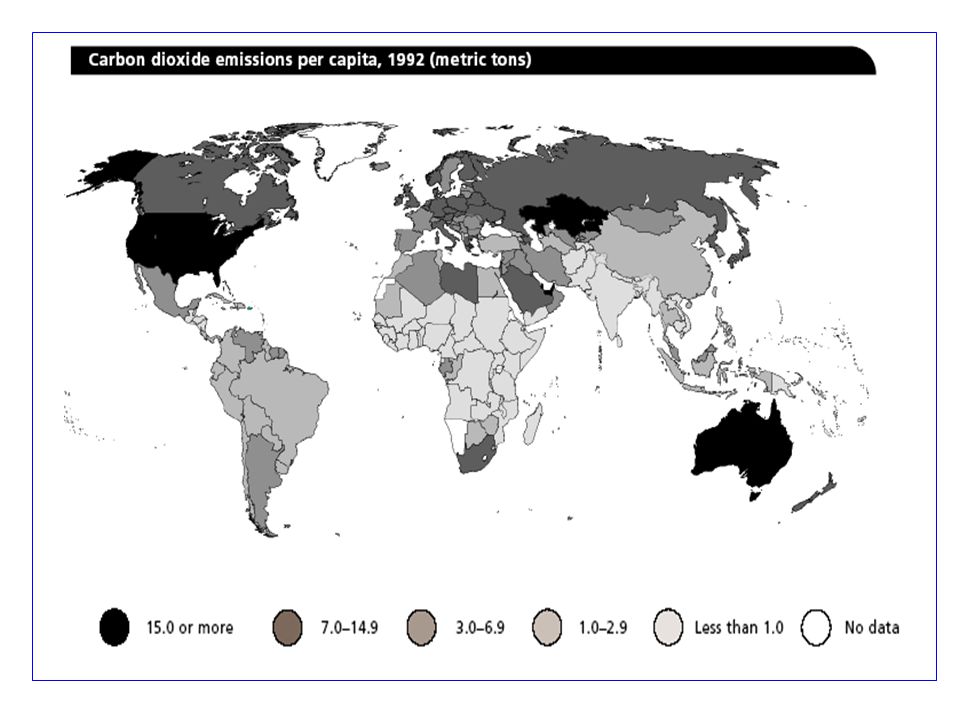
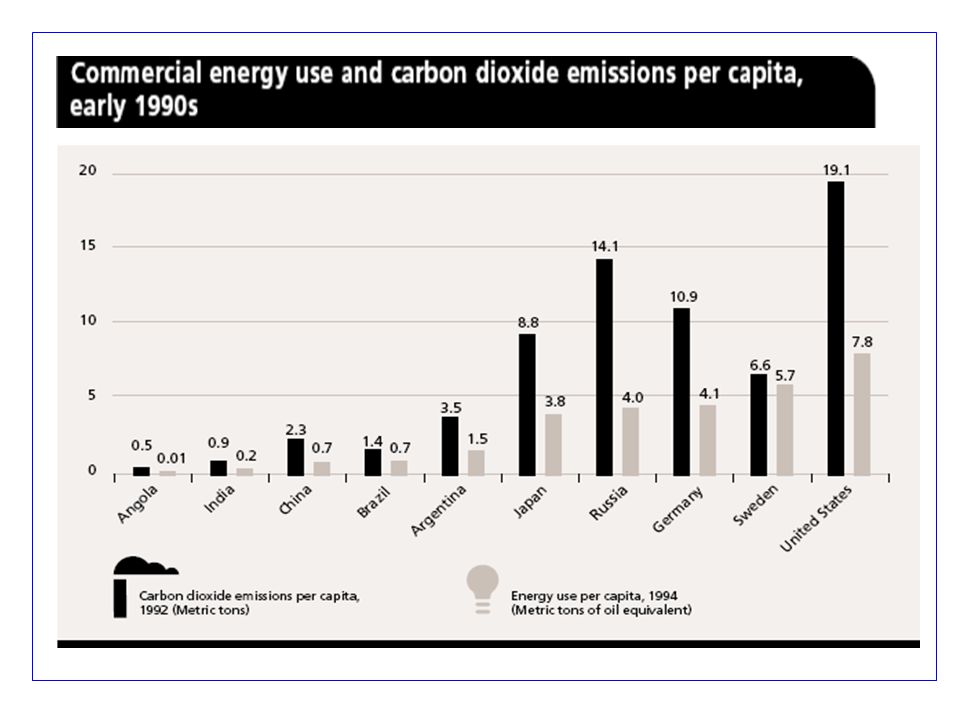
Amount of CO 2 emits depends upon –Level of industrialization –Size of economy –Efficiency of use Developing countries contain most of the world’s population, but their industrial production and energy consumption per capita are relatively low. Risk of Global warming lies with developed economies. United States, contains 4% of world’s population and responsible for 25% of CO 2 emission. Russia: Inefficient energy use. Use older and dirtier technologies. China is the second largest emitter of CO 2

11
Income and Energy Consumption For low and middle income countries, economic growth linked with increased energy consumption and increased CO2 emission At higher income levels, low per capita energy consumption and pollution despite economic growth. Energy use becomes more efficient and environmentally cleaner technologies are used. Moreover, higher income group has a large service sector; less energy intensive than industry.

12
Kyoto Protocols Kyoto Protocols adopted at the United Nations Conference on Climatic Change 1997 Kyoto (Japan). –Kyoto targets are legally binding. –Call on all wealthy nations to reduce greenhouse emission by 6- 8% below the 1990 levels by 2012. Developing countries (including India) refused to commit on reducing greenhouse gas emission. Number of countries with transition economies have joined in the efforts of developed countries. –Russia and Ukraine: not to exceed their 1990 emission level. –Hungary and Poland: to go 6% percent below their 1990 emission level.
 refused to commit on reducing greenhouse gas emission. Number of countries with transition economies have joined in the efforts of developed countries. –Russia and Ukraine: not to exceed their 1990 emission level. –Hungary and Poland: to go 6% percent below their 1990 emission level..")
13
Percent change (per capita) 1990-1998
")
14
How do countries decide there emission levels? Corporative and a Non-Corporative Game.

15
A Simple Environmental Game Two neighboring countries, emitting pollutants. Both countries want to control their level of emission. Trade off! Both the countries have to consider the total cost of their emissions. Total Cost=Environmental damage cost+ Abatement cost Reduced emissions Low environmental damage Increase in cost v/s

16
Let E 1 and E 2 be the level of emissions of the two countries. Total cost of country 1 can be represented as Environment cost increases with total pollution level E. Increases at an increasing rate (square). If E1=a/b then abatement cost is zero i.e. the country is not making any efforts to reduce the emission level. 0<E 1 <a/b E=E 1 +E 2 total emission Environmental damage cost Abatement cost i.e. cost Incurred to reduce emission level to E 1.
. If E1=a/b then abatement cost is zero i.e. the country is not making any efforts to reduce the emission level. 0<E 1 <a/b E=E 1 +E 2 total emission Environmental damage cost Abatement cost i.e. cost Incurred to reduce emission level to E 1..")
17
Similarly for country 2 Country 2 has a different parameter c 2 in the environment damage cost, and also exhibits half the abatement cost. From a social point of view we should minimize the total cost of the society min(TC)=TC 1 +TC 2 where c2 is another constant Analysis cont..
=TC 1 +TC 2 where c2 is another constant Analysis cont...")
18
Socially Optimal Levels Differentiating TC w.r.t. to E 1 and E 2 and equating to zero We obtain the socially optimal levels of E 1 and E 2 And the total emission is given by

19
Modeling as a Game Two countries modeled as the two players Strategies sets are the emissions levels S 1 =S 2 =[0,a/b] Given a strategy, the resulting pay-offs are the (negative) of total cost functions. A non-cooperative game. Given the other countries strategy, find the best response of one country.
![Modeling as a Game Two countries modeled as the two players Strategies sets are the emissions levels S 1 =S 2 =[0,a/b] Given a strategy, the resulting pay-offs are the (negative) of total cost functions.](http://images.slideplayer.com/13/4111693/slides/slide_19.jpg "A non-cooperative game. Given the other countries strategy, find the best response of one country..")
20
From the above equations we get the Nash Equilibrium levels as 0 )( 1 1 E TC Finding Nash Equilibrium
( 1 1 E TC Finding Nash Equilibrium")
21
Interpretation Total equilibrium emission level The equilibrium emission levels are (E 1 N,E 2 N ). If say country 1 deviates from this equilibrium then its total cost function increases. Non-corporative behavior, (and assuming the countries to be rational) they will settle at the Nash Equilibrium levels (E 1 N,E 2 N ). Socially Optimal Emission < Nash Equilibrium Emission Therefore, countries can corporate to reach a better agreement.
 they will settle at the Nash Equilibrium levels (E 1 N,E 2 N ). Socially Optimal Emission < Nash Equilibrium Emission Therefore, countries can corporate to reach a better agreement..")
22
Further Reading Finus and Rundshagen (1998b) –considered a similar model with N countries. –Analyzed coalition formation process to reduce the total emission. Farrell and Maskin (1989) –Considered the stability for the two country model case.
 –Considered the stability for the two country model case..")
23
John F. Nash Jr. Born June 13 th July 1928 PhD from Princeton University 1950 with a dissertation on non-corporative games. PhD dissertation a mere 27 pages! 1959: diagnosed with paranoid schizophrenia –Remained in and out of mental hospitals till 1970 1978: Awarded the John Von Neumann Theory Prize for his invention of Nash Equilibrium. Awarded the Nobel Prize in Economics in 1994. Currently holds an appointment in Mathematics at Princeton. –Current research interests logic, game theory, and cosmology and gravitation. (As mentioned on his web-page http://www.math.princeton.edu/jfnj)

24
Bibliography Journal of Institutional and Theoretical Economics- Alfred Endres and Micheal Finus ‘International Environmental Agreements, How policy instrument affects Equilibrium Emission and Welfare’ Game Theory and Economic Modeling David M Kreps Labor Supply : Mark Killingsworth Wikipedia Other Websites http://www.math.princeton.edu/jfnj/ http://www.tutor2u.net/decks/econdeck50.asp http://nobelprize.org/economics/laureates/1994/nash- autobio.html

25
That’s All Folks!

Similar presentations

Model: Energy Technology and Climate Change Youngho Chang Division of Economics and Nanyang Technological University.>")


 game theory 2-person game theory (e.g., prisoner’s dilemma)>")


>")

